Scientific Investigations Report 2009–5221
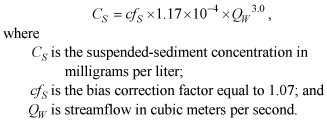
Estimates of Sediment LoadVariability in the magnitude, timing, and frequency of streamflow can greatly influence the amount of sediment transport that occurs from year to year. In analyzing the results of sediment monitoring for any given year, the discharge conditions for that year should be considered relative to the historical record. The magnitude and timing of streamflow during the study period relative to the mean daily streamflow for the period of record at the Elwha River at McDonald Bridge gaging station is shown in figure 4. Similar to most mountain-fed rivers in the Pacific Northwest, most of the annual streamflow in the Elwha River usually occurs during winter, as a result of direct runoff from precipitation and during summer, as a result of melting snowpack. Compared to the long-term annual mean streamflow at the McDonald Bridge gaging station (42.8 m3/s, based on the 92-year period of record), streamflow for water year 2006 was average (42.4 m3/s), and for water year 2007 was 14 percent above average (48.7 m3/s) (U.S. Geological Survey, 2008). Peak river flows during the study period occurred as a result of “pineapple-express” events, a type of regional weather pattern characterized by unseasonably warm temperatures and intense rainfall. The largest of these peaks occurred in early November during water year 2007, 346 m3/s at the gaging station upstream of Lake Mills and 592 m3/s at the gaging station at McDonald Bridge (U.S. Geological Survey, 2008). By comparison, peak flows occurred in late December during water year 2006, 262 m3/s at the gaging station upstream of Lake Mills and 329 m3/s at the gaging station at McDonald Bridge (U.S. Geological Survey, 2008). Elwha River above Lake Mills (12044900)Suspended-sediment data collected from the Elwha River at the gaging station upstream of Lake Mills during water years 2006–07 are summarized in table 1. Most samples were collected using the EDI method and samples with low suspended-sediment concentrations generally were composited in the laboratory prior to analysis. The highest suspended-sediment concentrations and river flows recorded during the study period occurred near the peak of a precipitation-driven flood on November 6, 2006, for which an instantaneous streamflow of 346 m3/s was recorded at 10:45 AM (Pacific Standard Time). Two sets of EDI measurements (10 samples) and 2 grab samples were collected near the peak of the flood. Suspended-sediment concentrations in these samples ranged from 5,703 to 7,325 mg/L and were higher than concentrations recorded during the 1994 drawdown study by Childers and others (1999). Suspended-sediment samples also were collected 3 days prior to the flood peak and ranged from 304 to 504 mg/L, and streamflow was about 85 m3/s (fig. 5). The mass percentage of suspended sediment finer than 0.0625 mm was determined for all EDI samples collected before and during the flood peak. Results from this limited size analysis (fig. 5) indicate that the percentage of fine suspended sediment (that is, silts and clays) increased as the flood progressed. This increase in fine sediment load likely was due to the magnitude and timing of this precipitation-driven event, which was exceptionally large and the “first flush” of the river basin following a dry summer. Because a continuous record of suspended-sediment concentration was not available at this site for 2006–07, a regression model was determined for suspended-sediment concentration and streamflow to estimate monthly and annual suspended-sediment loads. Concentration data from samples collected during water years 2006–07 (table 1) and data collected by the USGS at this site during water years 1995–98 (appendix A) were used with corresponding streamflow data to develop the regression model. During development of the model, it was observed that streamflow measurements less than 30 m3/s heavily influenced the coefficients of the regression line, yet the percentage of total suspended-sediment load contributed from streamflows less than 30 m3/s was minor (less than 0.5 percent). Because the regression line was unduly influenced by concentrations measured in this flow range, these measurements were trimmed from the data set and were not used in the model (fig. 6). This approach is consistent with the method of developing sediment-transport curves over specific flow regimes as outlined by Glysson (1987), except that a separate curve for low flows was not necessary for this analysis. To consider possible hysteresis, data points with concentrations greater than 50 mg/L were identified as having been measured on a rising or falling limb of a flood peak. However, no evidence for hysteresis was apparent due to the limited data set at the upper end of the flow regime. The OLS regression equation, which includes a correction factor for bias associated with the log-transformation of variables, is expressed as:
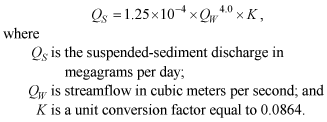
The coefficient of determination (R2) for the regression equation is 0.92. The regression model (equation 3) and the continuous streamflow record at the gaging station were used with GCLAS to estimate monthly and annual suspended-sediment loads (appendix B). The annual suspended-sediment load at the gaging station upstream of Lake Mills was estimated at 186,000 and 233,000 Mg for water years 2006 and 2007, respectively. To quantify the uncertainty in the regression model, the 95 percent confidence intervals for prediction and the mean were computed. The confidence interval for prediction is the likely range of suspended-sediment concentrations for a single measurement made at a particular streamflow, whereas the confidence interval for the mean is the likely range of concentrations for the mean of a set of independent measurements made at a particular streamflow (Helsel and Hirsch, 1992). Suspended-Sediment DischargeThe rate of suspended-sediment discharge in a river can be calculated from the product of the mean suspended-sediment concentration and the streamflow (Guy, 1970). The regression model developed for determining suspended-sediment concentration as a function of streamflow, equation 3, was modified to calculate suspended-sediment discharge as follows:
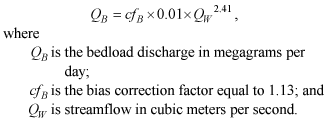
Bedload DischargeDuring water years 1995–98, 25 bedload measurements were made on the Elwha River at the gaging station upstream of Lake Mills (appendix C). Bedload discharge for each cross section measured was calculated using equation 2. During the 1994 Lake Mills drawdown study by Childers and others (1999), 19 measurements were made at this site and were included in this analysis. All measurements were matched with corresponding streamflows recorded at the gaging station and an OLS regression on log-transformed variables was used to describe a bedload transport curve relating bedload as a function of streamflow (fig. 7). The transport curve equation used for estimating bedload discharge is:
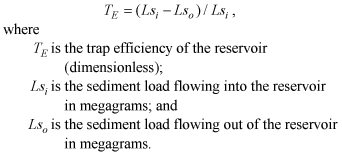
The R2 for the linear-regression equation is 0.77. The uncertainty in the bedload transport model for prediction and mean was determined at the 95 percent confidence level. Total Sediment Load EstimatesThe regression models developed for suspended-sediment and bedload transport as a function of streamflow were used to estimate the total sediment load into Lake Mills. A flow-duration/sediment-rating curve approach as outlined by Julien (1998) was used to estimate total load. The flow-duration curve is a cumulative-frequency curve showing the percentage of time specific streamflows were equaled or exceeded (Searcy, 1959). A flow-duration curve based on 8 years of daily streamflow data (water years 1995–98 and 2005–08) obtained from the gaging station upstream of Lake Mills was developed using the Weibull plotting position formula as explained by Helsel and Hirsch (1992). The flow-duration curve was combined with the sediment transport equations for suspended sediment (equation 4) and bedload (equation 5) to determine an estimate of total annual sediment load (appendix D). Using this approach, the total load at the gaging station upstream of Lake Mills was estimated to be 327,000 Mg/yr with a range of uncertainty of +57 to -34 percent (217,000–513,000 Mg/yr) at the 95 percent confidence level. The percentage of suspended-sediment load was estimated at 77 percent (251,000 Mg/yr), and the percentage of annual bedload was estimated to be 23 percent (75,500 Mg/ yr). Elwha River at McDonald Bridge (12045500)An automated sampler was used to collect 451 pumped samples from the Elwha River at the gaging station at McDonald Bridge during water years 2006–07 and 16 EDI measurements were made in water year 2006 (table 2). The highest recorded suspended-sediment concentration at this site was 946 mg/L from a pumped sample during the pineapple express flood of November 6, 2006. The peak streamflow recorded during this flood was 592 m3/s at 12:45 PM. The flood was anticipated, and the sampling frequency of the pump sampler was increased to 4-hour intervals 3 days prior to the flood peak and continued throughout the peak and during the recession. During the course of the flood, the peak in suspended-sediment concentration lagged the streamflow peak by about 8 hours (fig. 8). Delayed sediment peaks of 2–3 days were measured in the reservoir drawdown study by Childers and others (1999) when streamflow was much lower than during the November 2006 flood event. During the November 2006 event, delayed sediment peaks were the result of slower sediment transport through the reservoir relative to the propagation of the flood peak. A limited particle-size analysis was done on 16 automated pump samples collected from December 2005 to January 2006, with suspended-sediment concentrations ranging from 69–454 mg/L. Of these, 14 samples were predominantly fine sediment (less than 0.0625 mm) with an average of 91 percent by mass. The percentage of fine sediment in samples at this site generally was higher than samples collected from the site upstream of Lake Mills, indicating that sand-sized particle settling occurs in Lake Mills. Suspended-sediment concentrations of samples collected using the EDI method and automated pump sampler were combined in GCLAS with the record of instantaneous streamflow at this gaging station to calculate the daily, monthly, and annual suspended-sediment loads (appendix E). Comparisons of Sediment Load and Determination of Trap Efficiency of Lake MillsMonthly suspended-sediment loads determined at both gaging stations on the Elwha River indicate that most sediment transport occurs during the winter flood season (November–February) with a smaller contribution occurring during mid-summer as a result of higher flows from snowmelt (fig. 9). At the gaging station upstream of Lake Mills, the annual suspended-sediment load was 186,000 Mg in water year 2006 and 233,000 Mg in water year 2007 (appendix B). Downstream of Glines Canyon Dam, the annual suspended-sediment load at the McDonald Bridge gaging station was 49,300 Mg in water year 2006 and 75,200 Mg in water year 2007 (appendix E). The suspended-sediment yield for the basin upstream of the gaging station upstream of Lake Mills, calculated from the annual load divided by the drainage area (513 km2), was 363 Mg/km2 for water year 2006 and 454 Mg/km2 for water year 2007. The ability of a reservoir to force the deposition of suspended particles and accumulate sediment over time can be quantified as the trap efficiency. The trap efficiency of a reservoir can be calculated as:
The trap efficiency for Lake Mills was determined from the annual loads calculated at the gaging stations upstream and downstream of the reservoir. However, because the Lake Mills and McDonald Bridge gaging stations are not immediately upstream and downstream of the dam (4.3 km upstream and 7.6 km downstream, respectively), the additional sediment loads contributed from the drainage areas of these reaches were estimated using the sediment yield determined for the basin upstream of the gaging station upstream of Lake Mills. To estimate the additional loads, the sediment yield was multiplied by the drainage areas associated with the reaches immediately upstream and downstream of the dam (122 and 62 km2, respectively). The resulting estimated load upstream of the dam was added to the annual sediment load at the gaging station upstream of Lake Mills to determine Lsi. The estimated load downstream of the dam was subtracted from the annual load determined at the McDonald Bridge gaging station to determine Lso. The mean trap efficiency calculated from equation 6 was 0.86 for water years 2006 and 2007. |
For additional information contact: Part or all of this report is presented in Portable Document Format (PDF); the latest version of Adobe Reader or similar software is required to view it. Download the latest version of Adobe Reader, free of charge. |

![]() U.S. Department of the Interior | U.S. Geological Survey
U.S. Department of the Interior | U.S. Geological Survey
URL: http://
pubsdata.usgs.gov
/pubs/sir/2009/5221/section4.html
Page Contact Information: Contact USGS
Page Last Modified:
Thursday, 10-Jan-2013 19:39:40 EST

 (3)
(3) (4)
(4) (5)
(5) (6)
(6)