Scientific Investigations Report 2010–5153
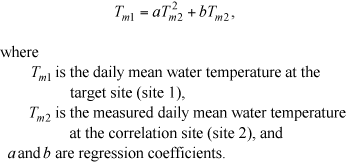
Methods and ModelsSeveral methods were used to estimate the flow and water temperature conditions that would occur at the target dam sites in the absence of those dams, and then track those effects downstream. Dam-Site Flow EstimationThe downstream flow and thermal effects of Willamette River basin dams cannot be modeled without first estimating the flows that would occur at the dam sites in the absence of the dams. In some cases, flow estimates also were needed to help estimate without-dam water temperatures at the dam sites, particularly when more than one reservoir was located on the same tributary. One method was used to estimate flows at the USACE dam sites, and a different method was used to estimate flows at the River Mill dam site on the Clackamas River. For the USACE dam sites, without-dam flows were computed using net inflow estimates that are routinely calculated by USACE from measured dam releases and measured changes in reservoir storage. To estimate the actual total inflow rate to each reservoir, it was necessary only to adjust the net inflow estimates to account for evaporative losses in the reservoir. (The effects of precipitation are included in the analysis through an assumption that any rainfall collected by the surface of the reservoir would result in a similar amount of streamflow in the absence of that reservoir.) Evaporation rate measurements at each reservoir were available from USACE (see section, “Data Sources”). The maximum evaporation rates were measured in July and ranged from 4.36 to 6.22 in/mo; minimum evaporation rates were assumed to be 1.00 in/mo (table 2). For a reservoir with a large surface area such as Fern Ridge Lake (9,000 acres at full pool), the maximum evaporative loss is substantial (62.2 ft3/s) and can be as large as the incoming streamflow at times. Evaporative losses were assumed to vary in a smooth sinusoidal-like fashion from a minimum in winter to a maximum in summer as in figure 3. Evaporation adjustments for the re-regulating reservoirs (Dexter and Big Cliff) were negligible and therefore were not included in the without-dam flow estimates. The Clackamas River has multiple dams and hydropower diversions, which complicates the process of estimating streamflow in the absence of those features. For this river system, however, a model had been constructed for PGE’s dam relicensing process, and one of the model scenarios was a simulation of conditions in the absence of the dams and hydropower projects. That model scenario was provided to ODEQ and was used in support of the Willamette River temperature TMDL (Oregon Department of Environmental Quality, 2006b). The modeled “no-project” flows were used as no-dam flow estimates for the River Mill dam site on the Clackamas River for the period in 2001 that overlapped the period of interest for this study. No-dam flows after September 30, 2001, were estimated through a correlation of the available no-project flows with estimated no-dam flows at Big Cliff Dam on the North Santiam River. Dam-Site Temperature EstimationThe methods used to estimate without-dam water temperatures at each of the dam sites of interest varied depending on the availability of upstream data and the presence of additional dams upstream. The flow chart in figure 4 illustrates the general process. For a reservoir with only one major inflow, no upstream reservoirs, and a complete record of upstream water temperature, the upstream water temperatures simply were adjusted to account for any warming that would occur during summer as the water travels downstream to the dam site. If the upstream water-temperature dataset was incomplete, or if data were only available for a different time period, then regression techniques were applied using measured water temperatures from nearby or similar streams to estimate temperatures for the period of interest. For reservoirs with more than one major inflow, energy and mass balances were applied to generate temperature estimates at the confluence of those inflows in the reservoir. Finally, if more than one dam is located on the same major tributary, such as Green Peter and Foster Dams in the South Santiam River basin, then the estimation procedures were applied to the most upstream dam first and then to the dam(s) downstream. RegressionsRegression techniques were used to estimate water temperatures at sites upstream of reservoirs if the available datasets did not fully correspond to the period of interest. The available water-temperature data were correlated with water-temperature data from a nearby or similar site, paying particular attention to match the elevation and geographic characteristics of the two sites. Site elevation and upstream geographic characteristics are important in determining a stream’s water temperature. A stream that has a significant fraction of its headwaters in the High Cascades, for example, is likely to be cooler in mid-summer than a stream entirely in the Western Cascades or Coast Range because flow in High Cascade streams typically is driven by snowmelt and high-elevation springs, whereas streams in other geographic areas of the Willamette River basin tend to be rainfall driven (Conlon and others, 2005; Tague and others, 2007). The best water-temperature regressions were obtained when the target site and its correlated site were in the same geographic area and at similar elevations. Separate regressions typically were constructed to predict a site’s daily mean water temperature and its daily temperature range, in order to avoid phase errors that might occur if the hourly or half-hourly data were compared directly. Phase errors in a time series comparison can be caused by subtle timing discrepancies, such as (1) differences in the duration of daylight caused by site location or shading characteristics, or (2) undocumented errors in the time datum (daylight savings time versus standard time). For example, if a site is located far enough west relative to the target site, the timing of sunrise and sundown will occur a fraction of an hour later and delay the daily warming and cooling cycle; direct comparison of water-temperature time series from the two sites would contain a phase error that can be difficult to remove. Producing separate regressions for the daily mean and the daily range in water temperature is a simple way to circumvent such problems. Extrapolation of the regression often was necessary to extend incomplete temperature datasets (typically available only for the warmer summer months) to the rest of the year. For some comparisons, a linear regression worked well, but extrapolation of a linear model could result in winter temperature predictions below freezing under some conditions. To remedy that situation, a linear regression could be forced to have a zero intercept, but that might result in a poorer fit to the data in summer. Instead, a more robust regression could be produced for all temperature ranges by fitting a quadratic curve with a zero intercept:
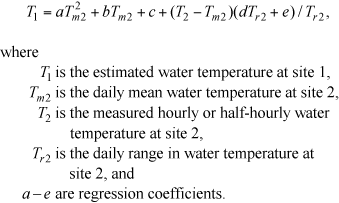
When this approach was necessary, the coefficient for the quadratic term in the equation typically was small, indicating that only a slight curvature was needed to force the regression curve through zero. Similar approaches were used to correlate the daily range in water temperature at pairs of sites. When separate daily mean and daily range regressions were used, they were combined to produce a time series of estimated water temperatures by assuming that the timing of any daily variation in temperature at site 1 was similar to that at site 2. The combined equation, allowing for a quadratic or linear regression of the daily means and a linear regression of the daily ranges, would take the following general form:
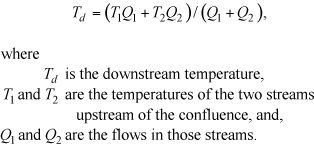
The first three terms are from the daily mean regression, whereas the other terms are used to superimpose a scaled level of daily variation on top of the estimated daily mean. This equation illustrates a typical approach, but the method varied depending on the site. Mass and Energy BalancesAt the confluence of two streams, both mass and energy are preserved in the mixed waterbody downstream. When the flow in both streams is known, it is trivial to compute the temperature downstream of the confluence by applying an energy balance:
If flow data are not available, the upstream drainage areas of each stream can be substituted for the flow data as an approximation. This energy balance technique is required for the estimation of without-dam water temperatures when more than one major stream enters the reservoir of interest or if one or more inflows have measurement stations upstream of tributary junctions. Application of the energy balance is best done at each of the relevant stream confluences that would occur in the absence of the reservoir. Downstream WarmingDuring periods of strong solar heating, particularly in summer, water temperatures upstream of a reservoir generally are cooler than the without-dam temperatures that would occur at the downstream dam site. Some amount of warming is likely to occur as the water travels downstream. Several methods could be used to estimate the amount of warming that would result, including (1) estimates based on trends in historical data, (2) measurements of warming in nearby or similar streams, and (3) application of a model that simulates the heat budget of the stream or a similar or idealized stream. Temperature models of the rivers upstream of and within the reaches now occupied by Willamette River basin reservoirs do not currently exist. Until such models are constructed, which is beyond the scope of this study, any downstream warming must be estimated. CE-QUAL-W2 models are available for the major rivers downstream of most of the dams of interest (see section, “Flow and Temperature Models”). Those models could be used to assess the general magnitude of warming that occurs during summer months just downstream of the dams, provided that the upstream flow and temperature boundary conditions imposed on those models are representative of a no-dams scenario. When that type of no-dam scenario was run for the SF McKenzie River, the simulated warming trend in the daily mean water temperature for the 4 mi downstream of the Cougar dam site was 0.14 °C/mi (range: -0.03–0.28 °C/mi) for June through September. For the North Santiam River, the simulated warming trend in the first 4 mi downstream of the Big Cliff dam site was 0.08 °C/mi (range: 0.00–0.16 °C/mi) for the same time period. These rivers, however, may have different characteristics (width, shading) downstream of the dam sites compared to reaches upstream; therefore, these downstream warming trends are only approximate. Downstream warming rates also can be derived from historical data. Water-temperature data collected from 381 stream sites in Oregon were compiled and documented by Moore (1964) for 1947–62, which spans the period when about half of the major dams were built in the Willamette River basin (table 1). Included in those datasets were pairs of sites on unregulated streams that could be used to assess the magnitude of warming or cooling that occurs as water travels downstream. Results typically showed warming in the downstream direction, with periodic cooling trends during winter. In the warmest summer months, downstream warming could be as much as 0.56 °C/mi (1 °F/mi in the original data units), but normally was much less. An analysis of the data by Moore (1967) indicated that a summertime average downstream warming trend was closer to 0.11 °C/mi (0.2 °F/mi). Indeed, a downstream gradient of exactly 0.11 °C/mi was measured in the Middle Fork (MF) Willamette River for July–September 1951–53, just prior to the completion of Lookout Point Dam and within the river reach now occupied by Lookout Point Lake (Moore, 1967). These measured downstream warming rates are almost identical to those that were simulated in the 4 mi downstream of the Cougar and Big Cliff dam sites for a no-dams scenario. Therefore, a summertime maximum downstream warming rate of 0.11 °C/mi was used in this study for estimating without‑dam temperatures at the dam sites. The amount of downstream warming varies seasonally, with more warming during summer and proportionally less in spring and autumn. Downstream warming in this study was applied as a maximum of 0.11 °C/mi during the warmest months and a linearly decreasing rate for time periods when the stream temperature was cooler. No warming was applied outside of the April through October time period. Stream temperature is a strong function of flow and meteorological conditions and therefore is a good indicator of time periods when the stream is warming. Downstream warming, therefore, was applied only if the stream’s upstream temperature exceeded some lower threshold, with the rate linearly increasing until an upper threshold was reached, above which the maximum warming rate was applied. For most of the rivers in this study, subjective lower and upper thresholds of 10 and 16 °C were used. For rivers with a substantial drainage area in the High Cascades, slightly lower thresholds (6 and 14 °C for the North Santiam River; 6 and 12 °C for the SF McKenzie River) were applied to account for their colder snowmelt sources. Future studies could refine these thresholds by taking into account the different physiographic areas of the basin and determining how the warming rate of a stream tapers off at high temperatures, but no data were available in this study to support the exploration of these threshold dependencies. Water-temperature data upstream and downstream of reservoirs can provide additional insights into the seasonal pattern of warming and cooling caused by those reservoirs. Moore (1967) quantified this effect for several of the dams of interest in this study. The warming or cooling effects documented by Moore (1967), however, were reported only as monthly temperature changes to the nearest whole degree Fahrenheit. In the absence of measured upstream temperatures (where previously described regression methods could be applied), these monthly warming or cooling patterns could be used to estimate an upstream temperature from a measured temperature downstream of a dam, followed by application of a downstream warming rate to compute a without-dam temperature at the dam site. This method is subject to larger errors than the regression methods used in this study, primarily because observed monthly reservoir warming or cooling patterns neglect shorter-term variations and may differ somewhat from year to year because of variability in dam operations. This approach had to be used for Fern Ridge Dam on the Long Tom River. Flow and Temperature ModelsThe flow and temperature effects of Willamette River basin dams downstream of the USACE and PGE dams was simulated by imposing the without-dam flow and temperature estimates as upstream boundary conditions to the Willamette River TMDL models. The suite of Willamette models is composed of nine models that can be linked together by passing the output of upstream models to the input of downstream models. The models simulate the entire Willamette River and its largest tributaries as far upstream as the first major dam on each tributary (fig. 1). The nine river models include the following reaches:
All nine river models were constructed using CE-QUAL-W2, a state-of-the-art two-dimensional, laterally averaged flow and water-quality model from USACE that is jointly maintained by Portland State University (PSU) (Cole and Wells, 2002). Most of the models were constructed, calibrated, and tested by Dr. Scott Wells’ research team at PSU (Annear and others, 2004a, 2004b; Berger and others, 2004). The South Santiam River model was constructed by ODEQ with assistance from the PSU team. The Santiam and North Santiam River model was built, calibrated, and tested by USGS (Sullivan and Rounds, 2004). These flow and temperature models were calibrated and used to simulate periods during 2 years when data were available for model calibration; June 1–October 31, 2001, and April 1–October 31, 2002. Flow conditions were relatively typical in the summer of 2002, whereas 2001 was a drought year with some reservoirs that did not fill and streamflows at many locations that fell below the lowest 7-day average streamflow that would be expected to occur once in 10 years (7Q10). Modeled water temperatures were in good agreement with measured data; mean absolute errors generally were less than 1.0 °C. Much more information about CE-QUAL-W2, its application to these river reaches, and its use in the TMDL is available from Annear and others (2004a, 2004b), Berger and others (2004), and Sullivan and Rounds (2004). In an attempt to simulate water temperatures that would occur if certain anthropogenic influences were minimized or eliminated, the Willamette River temperature TMDL included a reference condition called Natural Thermal Potential (NTP). Under this NTP condition, point sources were removed, riparian vegetation was restored with some level of natural disturbance, and several instream hydropower projects at Willamette Falls and along the McKenzie River were eliminated (Oregon Department of Environmental Quality, 2006b). Upstream dams and instream withdrawals, however, remained in the NTP model scenario. The models used in this study were based on the NTP scenario used in the TMDL, but included several small modifications to correct errors, remove instabilities, and make the models more usable. Some of these model changes were documented by Rounds (2007) in a study that used the TMDL models to assess the thermal effects of point sources, riparian shading, and dam operations. During this study, additional modifications were required to run the models under the no-dam flow conditions. For example, large withdrawals for agricultural and municipal use along the South Santiam River downstream of Foster Dam can amount to more flow than is present under no-dam conditions. The largest withdrawal in that reach, the Lebanon-Santiam Canal (USGS station 14187600), by itself averaged more than 100 ft3/s during mid-summer in 2001 and 2002. As part of the no-dam scenario, withdrawals from the South Santiam River had to be decreased to keep the model stable and prevent the river from becoming dry. Other modifications also were made to the calibrated water-balance flows in the Middle Fork and Coast Fork Willamette River model, and a small error in the distributed tributary temperatures for several branches of the Upper Willamette River model was corrected. The details of these corrections are discussed in section, “Downstream Effects of Willamette Basin Dams.” Data SourcesWithout-dam streamflows and water temperatures were estimated using data from USGS, ODEQ, and USACE. USGS streamflow and water-temperature data were obtained from measurements stored in the USGS National Water Information System database, parts of which can be accessed online (U.S. Geological Survey, 2010a). Daily mean data and other daily statistics are available from http://waterdata.usgs.gov/or/nwis/sw/ (U.S. Geological Survey, 2010b), and subdaily data from some sites can be accessed at http://or.water.usgs.gov/grapher/ (U.S. Geological Survey, 2009). USGS streamflow and temperature data not available online are available upon request. USGS protocols and quality assurance procedures for the collection of streamflow and water temperature have been published by Rantz and others (1982) and Wagner and others (2006), respectively; water-temperature measurements typically are accurate to within 0.2 °C. Upstream drainage areas, when needed as a surrogate for streamflow data, were obtained from the USGS Streamstats program, accessible online at http://water.usgs.gov/osw/streamstats/oregon.html (U.S. Geological Survey, 2007). In addition to the USGS data, water-temperature data from many sites were obtained from ODEQ’s LASAR database (Oregon Department of Environmental Quality, 2007) at http://deq12.deq.state.or.us/lasar2/. ODEQ has detailed protocols for the collection and quality assurance of water-temperature data (Oregon Department of Environmental Quality, 2009a). Data from the LASAR database were used in this study only if those data passed the quality assurance checks imposed by ODEQ. USACE data of various types (streamflow, reservoir releases, evaporation rates, etc.) were obtained either directly from USACE staff in the Portland District, or online through the USACE Dataquery tool (U.S. Army Corps of Engineers, no date) at http://www.nwd-wc.usace.army.mil/perl/dataquery.pl. |
First posted August 17, 2010 For additional information contact: Part or all of this report is presented in Portable Document Format (PDF); the latest version of Adobe Reader or similar software is required to view it. Download the latest version of Adobe Reader, free of charge. |

![]() U.S. Department of the Interior |
U.S. Geological Survey
U.S. Department of the Interior |
U.S. Geological Survey
URL: http://pubsdata.usgs.gov/pubs/sir/2010/5153/section3.html
Page Contact Information: GS Pubs Web Contact
Page Last Modified: Thursday, 10-Jan-2013 19:14:23 EST

 (1)
(1) (2)
(2) (3)
(3)