Scientific Investigations Report 2010–5153
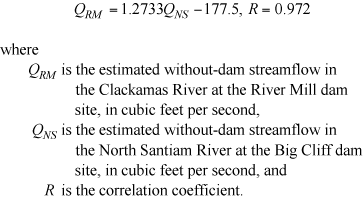
Thermal Effects of Dams in the Willamette River BasinWithout-Dam Flow Estimates at Dam SitesEstimates of without-dam streamflow at 11 of the USACE dam sites were constructed from measured dam releases, estimated changes in storage as a function of reservoir stage measurements, and a correction for evaporative losses from the reservoirs. Net inflow estimates based on measured releases and storage changes were obtained from USACE. Measured evaporation rates and known reservoir surface areas were used to correct the net inflows to produce a gross inflow estimate. It was assumed that the flow-regulating dams (Big Cliff and Dexter) had little effect on the net inflow estimates from the much larger dams directly upstream (Detroit and Lookout Point, respectively). Without-dam streamflows for the Clackamas River at the River Mill dam site were estimated from models and regressions. Simulated no-project flows at the River Mill site were obtained from ODEQ for 2001 through the end of September (Oregon Department of Environmental Quality, 2006b). After that date, and for 2002, the estimated without‑dam streamflows were determined through a regression of the available 2001 no-project flows against estimated without-dam flows at the Big Cliff dam site on the North Santiam River. That regression was:
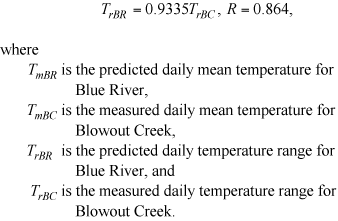
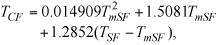
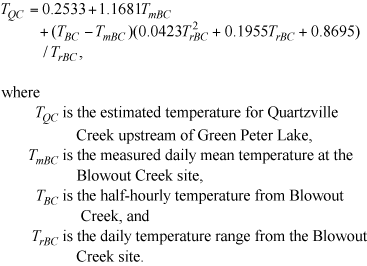
A comparison of with- and without-dam streamflows at most of the dam sites reveals the effects of operating these dams for wintertime flood control and summertime flow augmentation. Dams on the MF Willamette River, for example, stored peak inflows for later release, resulting in lower peak flows in winter (9,970 versus 21,700 ft3/s) and higher minimum flows in summer (approximately 1,020 versus 633 ft3/s) at the Dexter dam site during 2001–02 than might have occurred otherwise (fig. 5, table 3). Dam operation also typically results in streamflows that are relatively constant over periods of weeks, and that change abruptly when gates or spillways are opened to augment flows or make room for additional flood storage, or closed to fill the reservoir or protect downstream areas from flooding. In contrast, streamflow responds quickly to rainfall and snowmelt without the dams, and has a characteristic exponential transition from high-flow to low-flow conditions in the spring to summertime period. Dam operations likely will change in the future, however, as flow variations and higher peak flows increasingly are recognized as important to downstream fish populations and the health of off-channel, wetland, and floodplain ecosystems (Gregory and others, 2007). The with- and without-dam streamflow comparison shows important differences between the 2001 drought conditions and the more-normal 2002 hydrologic conditions. The winter of 2000–01 was uncharacteristically dry, with insufficient precipitation to allow most of the key storage reservoirs to fill, including Detroit, Green Peter, Blue River, Cougar, Lookout Point, and Hills Creek Lakes. As a result, summertime releases in 2001 were less than those in 2002. Summertime releases from Dexter Dam (and Lookout Point Dam just upstream) on the MF Willamette River in 2001 were roughly one-half of mid-summer releases in 2002. The decreased storage in these dams in 2001 resulted in Willamette River flows that were at or near post-dam 7Q10 levels during summer. Because 2001 was a drought year and 2002 was a more typical year, the without-dam temperature estimates from this study reflect a range of hydrologic conditions, which is useful for showing a range of thermal responses. The with- and without-dam streamflow patterns for two of the shorter dams included in this study, River Mill Dam on the Clackamas River and Fern Ridge Dam on the Long Tom River, show less difference than the streamflow patterns for the larger storage dams. River Mill Dam in particular is more of a run-of-the-river dam. Storage capacities of River Mill Dam and the other upstream dams on the Clackamas River are minimal, which results in without-dam flow estimates that are quite similar to measured flows with the dams in place. The storage capacity of Fern Ridge Dam is substantial despite its relatively short height (table 1); the dam is operated to provide a flood-protection benefit, but its summertime releases for downstream irrigators provides less of a contrast in seasonal flow compared to the with- and without-dam streamflows for some of the larger dams. Measured with-dam and estimated without-dam streamflows for all dam sites included in this study are graphed in appendix A for 2001–02. Those comparisons illustrate the same general patterns and trends discussed above, but two items discernible in those data merit additional discussion. First, the similarity of with- and without-dam flows at the Cougar dam site during 2002 is a result of the reservoir being drawn down for the construction of a selective withdrawal tower. The reservoir did not fill in 2001, but was drawn down for construction from 2002 through 2004. Second, the estimated without-dam streamflow in the South Santiam River at the Foster dam site decreased during summer to as low as 140 ft3/s in 2001 and 100 ft3/s in 2002. The autumn rains arrived earlier in 2001 than in 2002, or the low‑flow minimum in 2001 might have been comparable to that in 2002. Withdrawals from the South Santiam River downstream of Foster Dam can easily exceed the low-flow levels without the dams, especially the diversion through the Lebanon-Santiam Canal, which provides municipal water to the city of Albany and was measured at approximately 90–100 ft3/s during the summers of 2001–02. Clearly, that level of surface-water diversion could not be supported without the storage provided by upstream dams. Without-Dam Temperature Estimates at Dam SitesWithout-dam water temperatures were estimated at the dam sites using a combination of several different methods, following the general process shown in figure 4. When water‑temperature data were available upstream of the reservoirs at each of the major inflows, those temperatures were combined using flow- or drainage-area-weighting techniques and adjusted to account for warming that typically would occur as that water moved downstream to the dam site during summer. Measured temperatures upstream of the reservoirs, however, usually were not available for the entire 2001–02 time period. As a result, regressions between the measured or adjusted temperatures and those from nearby or similar sites were needed to extend the estimates to the entire calendar years of 2001 and 2002. In the sections that follow, the methods used to estimate without-dam water temperatures at each of the dam sites are discussed along with the results. The order of presentation is alphabetical, as listed in table 1. These estimation methods are neither definitive nor unique, but are meant to illustrate the type of estimation method that could be applied, and to emphasize the importance of several types of data sources that are critical to this type of analysis. Big Cliff and Detroit DamsBig Cliff and Detroit Dams are located on the North Santiam River, which is one of the major Willamette River tributaries draining the Cascade Range (fig. 1). Big Cliff Dam is a relatively small re-regulating dam that smoothes the flow releases from Detroit Dam, which impounds one of the largest storage reservoirs in the Willamette River basin (table 1). The Big Cliff/Detroit dam complex generates more hydropower than any of the other dams in this study. Summertime releases from Detroit Dam during 2001–02 primarily were through its power penstocks, and at a depth that was below the thermocline in mid-summer; therefore, releases at that time were relatively cold. The downstream temperature effects of these dams have been documented previously (Moore, 1967; Laenen and Hansen, 1985; Sullivan and Rounds, 2004; Sullivan and others, 2007). Upstream of Detroit Lake, the three major inflows (North Santiam River, Breitenbush River, and Blowout Creek) are all gaged; streamflow and water-temperature data are available for the entire 2001–02 time period. As a result, it was relatively simple to compute a flow-weighted mean temperature for the major inflows, and adjust for the warming that probably would have occurred in the 11.8 mi from the head of Detroit Lake to the Big Cliff dam site. The resulting without-dam temperatures at the Big Cliff dam site are plotted in figure 6A along with measured temperatures just downstream of Big Cliff Dam at USGS station 14181500. The comparison shows a characteristic shift of the annual maximum water temperature from July or August without dams to September or October. Such a shift is typical downstream of a large storage reservoir that has a mid-level or deeper release point. Releases from Detroit Dam are primarily from the power penstocks, which are below the lake’s thermocline in mid-summer, resulting in relatively cold downstream temperatures in July and August. The process of drawing down the lake in September to make room for flood storage, however, brings warmer surface waters down to the power penstocks, resulting in warmer downstream temperatures in September and October. The comparison of with- and without-dam water temperatures clearly shows that the dams have both a cooling and a warming effect. During mid-summer, Big Cliff and Detroit Dams release water that is as much as 8 °C cooler than might occur without the dams, whereas releases in September or October can be 6–8 °C warmer than without the dams. Because the releases from Detroit Dam are from deep within the lake, little daily variation in water temperature occurs with the dams in place, compared to a daily range of about 4 °C without the dams in mid-summer. Oregon’s maximum water-temperature standard specifies a 7dADM water temperature for comparison to numeric criteria (Oregon Department of Environmental Quality, 2009b). Without the dams, the maximum water temperature at the Big Cliff dam site is relatively consistent from 2001 to 2002, with a 7dADM temperature between 17 and 18 °C in late July or early August (table 4). The maximum without-dam 7dADM temperature was slightly higher in 2001 than in 2002, a difference that probably is due to lower streamflow during the 2001 drought conditions. With the dams, the maximum measured 7dADM temperature was as low as 13.7 °C in 2002. Because the lake did not fill in 2001, the warmer surface water was closer to the power penstock intake level, resulting in a higher maximum release temperature. Comparing these temperatures as cumulative frequency curves, it is clear that the without-dam dataset contains both cooler and warmer temperatures (fig. 7). For example, temperatures were estimated to be cooler than 8 °C during 2001–02 about 59 percent of the time without dams, but only about 50 percent of the time with dams. The distribution is more similar in the 11–15 °C range, above which the curves diverge, where the without-dam temperatures increase to a maximum that is 1.6 °C higher than the with-dam maximum. The shape of the with-dam curve, of course, is greatly affected by dam operations and the fact that Detroit Lake did not completely fill in 2001. More important than the distribution of annual temperatures, however, is the shift of the annual maximum from mid-summer without dams to early autumn with dams because of the effect of that seasonal pattern on the timing of fish migration and spawning. The seasonal pattern in water temperature is of critical importance to the life cycle and survival of anadromous fish, and the temperature of water released by dams is an important controlling factor affecting that seasonal pattern (Caissie, 2006). Without-dam temperature estimates are affected by several sources of uncertainty. Because measured flows and temperatures were available for the entire 2001–02 time period upstream of Detroit Lake, the uncertainty derives primarily from the estimated rate of downstream heating for the warmer periods during summer. A model was not available to account for the actual travel time and the degree of topographic shading as the water moved from the head of Detroit Lake to the Big Cliff dam site. Downstream of the dam, however, a model of the North Santiam River was used to determine a downstream warming rate of 0.08 °C/mi (range: 0.00 to 0.16 °C/mi), which is close to the assumed maximum warming rate of 0.11 °C/mi. Applied over a distance of 11.8 mi, a warming rate of 0.11 °C/mi produces a maximum warming of 1.3 °C. If the warming rate was in error by as much as 0.05 °C/mi, an uncertainty of as much as 0.6 °C could result. Combined with measurement errors of ±0.2 °C, the without‑dam temperature estimates at the Big Cliff dam site are likely to have an uncertainty of no more than 0.5 to 0.8 °C (table 5). Blue River DamBlue River Dam is located on Blue River, which is a tributary to the McKenzie River just downstream of the SF McKenzie River confluence (fig. 1). The entire drainage of Blue River is in the Western Cascades physiographic province, which means that its flow is generated more from rainfall than from snowmelt, and it does not benefit from the cold springs and higher baseflow characteristics of High Cascades streams (Tague and others, 2007). The temperature effects of Blue River and Cougar Dams on McKenzie River temperatures has been studied in previous research by Hansen (1988). Estimation of without-dam water temperatures at the Blue River dam site provides an excellent example of the regression procedure used in this study. No temperature data upstream of Blue River Lake were available for the period of interest in 2001 or 2002, but upstream water temperatures were measured by ODEQ from June 15 through August 23, 2000, at a site 11.6 mi upstream of the dam (site 23910, data from ODEQ’s LASAR database, Oregon Department of Environmental Quality, 2007). A correlation to measured water temperatures at a nearby or similar site was needed to estimate water temperatures in Blue River for the 2001–02 time period. A comparison of the available data showed that Blue River temperatures during the summer were not at all similar to those from the SF McKenzie River upstream of Cougar Reservoir, a nearby site with a long dataset; the dissimilarity probably was the result of the SF McKenzie River having its headwaters in the High Cascades whereas Blue River has its headwaters entirely within the Western Cascades. A nearby site on Blowout Creek in the North Santiam River basin only about 30 mi to the north, however, has a continuous temperature record and is similar to the Blue River site in terms of its general elevation, physiographic province, and basin size. A comparison between the temperature data from 2000 for Blue River and Blowout Creek showed a strong similarity. The available Blue River temperature data from the summer of 2000 were correlated with measured temperatures for the same period from the Blowout Creek site (USGS station 14180300). To avoid phase errors derived from the fact that the two sites probably are affected by different topographic shading characteristics and the timing of local sunrise and sundown, the daily means and daily ranges were correlated separately. The regressions with the best fit are described by the following equations:
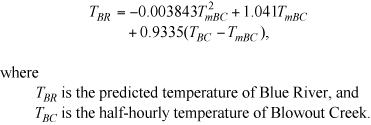
Both regressions provided good fits to the data with correlation coefficients (R) greater than 0.85; the correlation of the daily means was particularly good. These equations indicate that the daily temperature range of Blue River is about 93 percent of the daily temperature range of Blowout Creek, and the daily mean temperature of Blue River is about 4 percent larger than the daily mean temperature of Blowout Creek. A small quadratic term was included in the regression of the daily means so that an extrapolation from summer to winter conditions would not cause a bias. Measured water temperatures at these sites are quite similar, and the regressions bear that out. Combining these equations and assuming that the timing in the daily variation of water temperature at Blue River is similar to that at Blowout Creek, the following equation is derived:
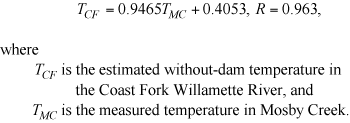
The resulting predicted temperatures are an excellent match for the measured temperatures of Blue River (fig. 8). The predicted Blue River temperatures from the regression analysis do not reflect temperatures that would occur 11.6 mi downstream at the Blue River dam site. A maximum downstream warming rate of 0.11 °C/mi was assumed (see section, “Methods and Models”) and applied for those times in summer when the stream was likely to be warming. The final estimated without-dam water temperatures at the Blue River dam site are plotted in figure 6B along with measured water temperatures at that site in 2001–02. As was the case for temperatures at the Big Cliff dam site on the North Santiam River, without-dam temperatures in Blue River at the dam site are relatively consistent from year to year. An annual maximum 7dADM water temperature was estimated to be about 21 °C without the dam and would occur in the July to August time period (table 4). With the dam in place, in contrast, the measured annual maximum 7dADM occurred in September or October. Blue River Lake did not fill in 2001, causing warmer releases downstream because the warmer surface layer was closer to the elevation of the lake outlet. In 2002, the lake did fill and releases were cooler throughout the summer and autumn. The annual maximum temperature estimated for Blue River without Blue River Dam (about 21 °C) is warmer than the annual maximum without-dam temperature estimated for the North Santiam River at the Big Cliff dam site (17–18 °C). The difference probably is a result of the upstream drainage characteristics, a theme that recurs throughout this report. The Blue River drainage is entirely within the Western Cascades physiographic province, whereas a large fraction of the North Santiam River upstream of Big Cliff Dam drains from the High Cascades area (fig. 2). Annual maximum temperatures typically are higher for Western Cascade streams than for High Cascade streams because the latter derive a large proportion of their flow from cold springs and groundwater fed from snowmelt, whereas Western Cascade streams lack that consistently cold source of water during the low-flow season. Uncertainties in the without-dam temperature estimates for Blue River can be attributed to errors in the regressions as well as errors in the estimated rate of downstream warming from the correlation site to the dam site. An analysis of the regression data from the summer of 2000 shows little error in the prediction of the daily mean temperature, with an insignificant mean error (ME, bias) of only -0.005 °C and a small mean absolute error (MAE, typical error for any data point) of 0.25 °C. Errors in the predicted daily minimum or maximum temperature are larger, with an MAE of 0.35–0.58 °C and an ME of -0.21 °C. Estimates of measurement error (±0.2 °C ), error in the rate of downstream warming (< 0.6 °C), and regression prediction errors (0.3–0.6 °C) are difficult to combine, but the overall uncertainty in the summertime temperature estimates for Blue River is likely to be in the range of 0.5 to 1.4 °C (table 5). Cottage Grove DamCottage Grove Dam is located on the Coast Fork Willamette River just upstream of Cottage Grove, Oregon. The upstream drainage mostly lies within the Western Cascades physiographic area, with a small fraction in the Willamette Lowlands area (fig. 2). Along with Fern Ridge Dam, Cottage Grove Dam was one of the first USACE dams built in the Willamette River basin. Its storage volume is relatively small compared with most of the other USACE reservoirs in the basin. The best estimates of without-dam temperatures at the dam sites make use of measured temperatures upstream of the reservoirs. Measured temperatures were available from ODEQ for the Coast Fork Willamette River upstream of Cottage Grove Lake at London (LASAR site 28614) for August 2–September 26, 2001, and April 21–September 9, 2002. A maximum downstream heating adjustment of 0.11 °C/mi was applied for the 6.5 mi to the dam site, but only for those periods during summer when heating was likely (see section, “Methods and Models”). To estimate without-dam water temperatures for the rest of 2001–02, correlations with data from other sites were required. In 2001, measured water temperatures in Mosby Creek downstream of Row River Trail were available from ODEQ (LASAR site 28103) for June 21–October 3. A correlation between these temperatures from Mosby Creek and the adjusted without-dam temperatures for the Coast Fork Willamette River showed an excellent similarity, with no need to correlate the daily means and daily ranges separately:
This regression was used for the periods June 21–August 2 and September 26–October 3 in 2001. Prior to June 21 and after October 3 in 2001, a correlation with measured water temperatures in the SF McKenzie River upstream of Cougar Reservoir (USGS station 14159200) provided a good fit, despite the fact that the SF McKenzie River drains water from the High Cascades. A correlation with data from Blowout Creek in the Western Cascades did not fit as well. Separating the daily means from the daily ranges, the following regression was used:
where the temperatures on the right-hand side of the equation are from the SF McKenzie River site and the m subscript indicates the daily mean. The daily mean and daily range regressions produced correlation coefficients of 0.934 and 0.678, respectively. Measured water temperatures were available from June 20 to November 19, 2002, for Mosby Creek at Laying Road (LASAR site 30638), which is a nearby unregulated tributary to the Row River near Cottage Grove. A comparison of these water-temperature data from Mosby Creek with temperatures from the Coast Fork Willamette River upstream of Cottage Grove Lake indicated that the data were similar enough to be used without further adjustment. No downstream heating adjustment was applied because the elevation of the Mosby Creek site is similar to the elevation of Cottage Grove. These data were used to fill out the 2002 without-dam temperature time series after September 9, 2002. A correlation with measured temperatures in the SF McKenzie River upstream of Cougar Reservoir was used for the period prior to April 21, 2002. (As for the 2001 data, a correlation with Blowout Creek temperatures was not as successful.) A new regression was prepared for the 2002 data, and the results were similar to the regression used for 2001:
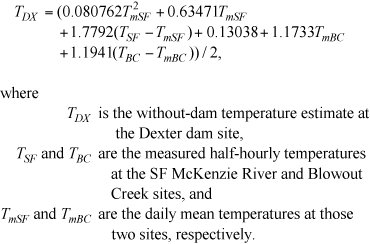
This regression was used to estimate without-dam water temperatures for the Coast Fork Willamette River for January 1–April 21, 2002. Correlation coefficients for the daily mean and daily range regressions were 0.964 and 0.591, respectively. The 2001 and 2002 datasets could have been combined and a single regression constructed, but the results would not have been different enough to be of concern. The without-dam water-temperature estimates at the Cottage Grove dam site show a seasonal pattern that is similar to those estimated at other dam sites, with peak annual temperatures occurring in July or August rather than in September with the dam in place (fig. 6C). The annual maximum 7dADM without-dam temperature is about 23.5 °C, which is warmer than the estimates for the Blue River dam site, despite both sites draining areas in the Western Cascades. That difference is consistent with the lower elevation at Cottage Grove. Uncertainties in the without-dam temperature estimates at the Cottage Grove dam site vary depending on whether those estimates were derived from upstream measurements, from nearby sites, or from correlations with sites farther away. The downstream warming was applied over only 6.5 mi compared to about 11.5 mi for the previous two dam sites, so the uncertainty in that adjustment might account for an error of 0.3 °C or less. Errors associated with the regressions are likely to be higher (about 0.5–1.0 °C). Overall, these without-dam temperatures probably have uncertainties on the order of 0.5 to 1.5 °C (table 5). Cougar DamCougar Dam is located on the SF McKenzie River about 4.5 mi upstream of its confluence with the McKenzie River. Built in 1963, Cougar Dam is the second tallest dam in the Willamette River basin and impounds the fifth largest volume of water in Cougar Reservoir. USGS maintains a streamflow-gaging station upstream of Cougar Reservoir (station 14159200) where water temperature also is measured and available for the entire 2001–02 period of interest. The SF McKenzie River is the major inflow to Cougar Reservoir, with minor contributions from Walker Creek and the East Fork of the SF McKenzie River. Without-dam water temperatures at the Cougar dam site were estimated by applying a reasonable downstream warming rate to the water temperatures measured upstream of Cougar Reservoir at USGS station 14159200. A maximum downstream heating rate of 0.11 °C/mi was applied for the 6 mi from the measurement site to the dam site. This maximum heating rate was applied when the upstream measured temperatures exceeded 12 °C. No downstream heating adjustment was applied when upstream temperatures were less than 6 °C, and a linearly interpolated fraction of the maximum rate was applied for upstream temperatures between 6 and 12 °C. These temperature thresholds are lower than those applied at most of the other sites, primarily because summertime temperatures in the SF McKenzie River tend to be colder than those upstream of the other reservoirs. Because the SF McKenzie River derives a substantial fraction of its flow from the High Cascades during summer, it tends to be relatively cool (Tague and others, 2007). Measured with-dam and estimated without-dam water temperatures at the Cougar dam site show the characteristic shift of annual maximum temperatures caused by dam operations in 2001 but not in 2002 (fig. 9A). Cougar Reservoir did not fill during the drought winter of 2000–01, but releases were still cool in mid-summer because water was released from deep in the lake. In 2002, the lake had been drawn down to allow for the construction of a selective withdrawal tower at the dam. With little water in storage, a more natural seasonal temperature pattern occurred in 2002, but some warming exceeding the without-dam condition occurred as a result of the impoundment, capture of solar radiation, and no ability to release water from a cooler hypolimnion. Without-dam annual maximum 7dADM temperatures at the Cougar dam site were estimated to be just over 15 °C, colder than the estimates from any other dam site in this study (table 4). Maximum without-dam temperatures at the Big Cliff dam site are the next coolest, but still warmer by more than 2 °C. Both sites are located at approximately 1,200 ft above sea level and derive much of their flow from the High Cascades, but temperatures in the SF McKenzie River upstream of Cougar Reservoir (USGS station 14159200) are colder in mid-summer by about 2 °C compared to temperatures in the North Santiam River just upstream of Detroit Lake (USGS station 14178000). Uncertainties in the without-dam water temperatures at the Cougar dam site are derived primarily from errors in the downstream warming rate, which are on the order of 0.3 °C for this site. Overall, errors in the without-dam temperatures at this site should be less than 0.5 °C (table 5). Dexter and Lookout Point DamsDexter Dam is a re-regulating dam located just downstream of Lookout Point Dam on the Middle Fork (MF) Willamette River not far from Eugene, Oregon (fig. 1). Lookout Point Dam impounds one of the two largest storage reservoirs in the Willamette River basin and has a large upstream drainage area that encompasses portions of both the Western Cascades and the High Cascades. The MF Willamette River and its major tributaries—the North Fork of the Middle Fork (NFMF) Willamette River, Salt Creek, and Salmon Creek—all have contributing areas in the High Cascades. The process of estimating without-dam water temperatures at the Dexter dam site had to begin upstream of Hills Creek Dam, also on the MF Willamette River. The first step was to determine the availability of water-temperature data upstream of Hills Creek Dam and in the other major tributaries (Salt Creek, Salmon Creek, and the NFMF Willamette River), and then work downstream by applying energy and mass balances at each major tributary confluence. Measured temperatures upstream of Hills Creek Lake were available from Hills Creek (LASAR site 27974) and from the MF Willamette River upstream (LASAR site 27992) for most of June through September 2001. Streamflow data for Hills Creek were not available, so the energy balance for the Hills Creek and MF Willamette River confluence was done by weighting the measured temperatures with their upstream drainage areas (59.9 mi2 upstream of the Hills Creek site, and 330 mi2 upstream of the MF Willamette River site) after first accounting for summertime warming as water moved from the two temperature-measurement sites to the Hills Creek dam site. The Hills Creek and MF Willamette River sites are 7.5 and 13.4 mi upstream of that confluence, respectively. A maximum downstream warming rate of 0.11 °C/mi was applied as described previously, using thresholds of 10 and 16 °C for no warming and maximum warming. Downstream of the Hills Creek dam site, water‑temperature data were available from Salt Creek (LASAR site 28010) and from the mouth of the NFMF Willamette River (LASAR site 28003), but no temperature data from Salmon Creek and no flow data from any of these tributaries were available. Temperatures from Salmon Creek, therefore, were assumed to be similar to those from Salt Creek and the NFMF Willamette River, and the combined flow contribution of these tributaries was determined by subtracting the without-dam streamflow at the Hills Creek dam site from the without-dam streamflow at the Dexter dam site. When temperature data were available from Salt Creek and the NFMF Willamette River (June 7–September 30, 2001), their upstream drainage areas (114 and 248 mi2, respectively) were used as weighting factors in an energy balance computation after accounting for the downstream warming of the Salt Creek water from its measurement site to the confluence of the NFMF with the MF Willamette River (6.4 mi). The combined flow and temperature effects of these tributaries then were merged with the without-dam flow and temperature in the MF Willamette River, again accounting for any downstream warming that would occur from the Hills Creek dam site to the confluence of the NFMF and MF Willamette Rivers. Finally, downstream warming estimates from that location to the Dexter dam site (20.8 mi) were applied, with a maximum warming rate of 0.11 °C/mi and minimum and maximum thresholds of 10 and 16 °C as before. This calculation resulted in without-dam temperature estimates at the Dexter dam site for June 4–September 30, 2001. Far fewer data were available from these or similar sites in 2002; therefore, 2002 without-dam temperatures at the Dexter dam site could not be derived from upstream temperature measurements. To extend the without-dam temperature estimates for summer 2001 at the Dexter dam site to the rest of 2001–02, regressions of those estimates with measured temperatures at other sites were constructed. Daily mean and daily range regressions were tested using water-temperature data from the two long-term USGS sites used previously in this study: Blowout Creek in the North Santiam River basin and SF McKenzie River upstream of Cougar Reservoir. Both regressions provided relatively good models for predicting without-dam temperatures at the Dexter dam site, with correlation coefficients greater than 0.91 and 0.76 for the daily mean and daily range models, respectively. The SF McKenzie River regression, however, produced temperature estimates that were biased slightly high in spring and early summer and slightly low in late summer. In contrast, the Blowout Creek regression produced temperature estimates that were too high in late summer and early autumn. Mean absolute errors were 0.92 and 1.03 °C for the SF McKenzie River and Blowout Creek regressions, respectively. Averaging the results from the two regressions eliminated some of the bias from each and reduced the MAE to 0.59 °C. Therefore, the average of the two regressions was used to estimate without-dam water temperatures at the Dexter dam site for January 1–June 3 and October 1–December 31, 2001 and for the entire year in 2002. The final combined regression equation is:
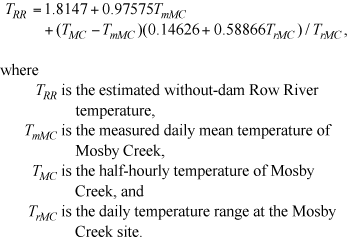
This regression indicates that the daily range in without-dam temperature at the Dexter dam site is about 78 percent larger than the measured range at the SF McKenzie River site, and about 19 percent larger than the measured range at Blowout Creek. For 2002, few measured water temperatures upstream of Lookout Point Lake were available, but some data from the MF Willamette River upstream of Hills Creek Lake were used to check the regression estimates at Dexter. The measured MF Willamette River temperatures upstream of Hills Creek Lake (LASAR site 30500) were compared to regression results at the Dexter dam site after applying the same type of downstream warming to the measured temperatures, using a maximum warming rate of 0.11 °C/mi over 40.4 mi. The comparison was favorable, with relatively good agreement for the daily maximum temperature in mid-summer and good agreement in general for April through June. The estimated without-dam temperatures are compared to the measured with‑dam temperatures at the Dexter dam site in figure 9B. The patterns for with- and without-dam temperatures at the Dexter dam site are somewhat similar to those from the Cottage Grove dam site. Annual maximum without-dam 7dADM temperatures at Dexter are approximately 23.5 °C, similar to those at Cottage Grove, whereas the with-dam annual maximum 7dADM temperatures at Dexter ranged from 18.8 to 20.4 °C (table 4). The shift in annual maximum temperature from July or August to September as a result of the dams is evident at Dexter just as it is at most of the other dam sites. Without-dam temperature estimates are warmer at Dexter than at the Blue River, Cougar, or Big Cliff dam sites because of the lower elevation of Dexter and the greater distance downstream from its cold High Cascade headwaters. The greatest uncertainties in the without-dam temperature estimates at the Dexter dam site probably result from the downstream warming rate that was applied, despite the fact that the maximum warming rate applied in this study was an exact match to the warming gradient measured in the MF Willamette River in July–September of 1951–53 (Moore, 1967) prior to the completion of Lookout Point, Dexter, and Hills Creek Dams. Given the large distance over which the warming rate was applied (20.8 mi from the North Fork confluence, as far as 42 mi from the MF Willamette River site upstream of Hills Creek Lake), a small error in the warming rate might produce a significant error in the estimated without-dam temperature at Dexter. An error of 0.03 °C/mi, for example, would result in a predictive error of 0.6–1.1 °C at Dexter during mid-summer, which may be sufficient reason to justify the construction of river models to provide a better prediction of the warming rate. Still, applying measurement error, regression error, and potential errors in the estimated downstream warming rate, the uncertainty in the without-dam temperatures at Dexter are likely to be no more than 1.5 °C most of the time (table 5). Dorena DamDorena Dam is located on the Row River near Cottage Grove, Oregon. Completed in 1949, the dam impounds a relatively small reservoir compared to most of the other USACE dams in the Willamette River basin, but still more than twice the storage of nearby Cottage Grove Lake. The upstream drainage area is entirely within the Western Cascades physiographic area, but the dam site is at an elevation of only about 800 ft above sea level, which is only slightly higher than the elevation of the Cottage Grove dam site but about 400 ft lower than the Blue River dam site. Measured water temperatures were available for the Row River upstream of Dorena Lake (LASAR site 28613) for August 2–September 26, 2001, and April 21–September 9, 2002. A maximum downstream warming rate of 0.11 °C/mi was applied to account for the heating that normally would occur as the water moved from the temperature-measurement site downstream 6 mi to the Dorena dam site. To help estimate without-dam water temperatures for the rest of 2001 and 2002, nearby measurements of water temperature were examined. For June 21–October 3, 2001, measured temperatures from Mosby Creek downstream of Row River Trail (LASAR site 28103) were obtained from ODEQ. The Mosby Creek temperatures appeared to have a larger daily variation than the Row River temperatures. Therefore, the daily means and daily ranges of these two datasets were correlated separately, and the resulting regression was obtained:
Correlation coefficients for the daily mean and daily range regressions were 0.989 and 0.747, respectively. This regression was used to estimate Row River without-dam temperatures for June 21–August 2 and September 26–October 3 of 2001, and it produced a good match to both the mean and range of the measured Row River temperatures. Extending the without-dam predictions to winter, spring, and autumn, a correlation with SF McKenzie River temperature data upstream of Cougar Reservoir for 2001 was constructed, also using separate regressions for the daily mean and daily range. The correlation produced the following equation:
where the variables are similar to those from the previous equation, except the SF subscript refers to data from the SF McKenzie River site. Again, the regression provided a good fit (correlation coefficients of 0.945 and 0.852 for the daily means and daily ranges, respectively), and this equation was used to estimate without-dam Row River temperatures for January 1–June 21 and October 3–December 31, 2001. For 2002, measured water temperatures were available from nearby Mosby Creek at Laying Road (LASAR site 30638) for June 20–November 19. A regression of the Mosby Creek data against the without-dam Row River temperatures gave the following result:
This regression provided a good fit to the available without-dam temperatures in 2002 and was used to extend the estimates from September 9 to November 19. To extend the estimates to the rest of 2002, a correlation with SF McKenzie River temperatures upstream of Cougar Reservoir again was constructed. This time, however, only the 2002 without‑dam estimates from April 21 to June 9 were used; using all available 2002 without-dam Row River temperatures did not produce as good a correlation. The resulting regression equation is:
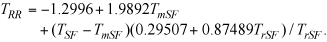
This regression was used to estimate without-dam Row River temperatures in 2002 for January 1–April 21 and November 19–December 31. The final compilation of without-dam temperature estimates at the Dorena dam site shows patterns and extremes that are similar to those at the nearby Cottage Grove dam site (fig. 9C). The annual maximum without-dam 7dADM temperatures at Dorena are the warmest of all dam sites included in this study, exceeding 25 °C. Cooler temperatures occur with the dam in place, despite the lack of a natural seasonal pattern. Although these without-dam temperature estimates include the warmest temperatures estimated in this study, they are based on measured upstream and nearby temperatures, which decreases the inherent uncertainty of the estimates. Uncertainties associated with the without-dam temperatures at the Dorena dam site are likely to be no more than 0.5 °C in mid-summer (table 5), based on a typical measurement error of 0.2 °C and a maximum warming estimation error of 0.3 °C (6 mi times a potential error of 0.05 °C/mi). Fall Creek DamFall Creek Dam impounds a reservoir on Fall Creek about 7 mi from its confluence with the MF Willamette River, and that confluence is about 5.5 mi downstream of Dexter Dam (fig. 1). The dam site elevation is less than 700 ft above sea level, and the upstream drainage area is located entirely within the Western Cascades physiographic area. Fall Creek Lake captures the inputs from Fall Creek as well as Winberry Creek, a major tributary that joins Fall Creek from the south and close to the dam site. Without-dam water temperatures at the Fall Creek dam site were estimated first using measured temperatures upstream of Fall Creek Lake for the period of interest. Measured water temperatures were available from sites upstream of Fall Creek Lake on both Winberry Creek (LASAR site 28013) and Fall Creek (LASAR site 27969) for mid-June through mid-October 2001. Temperature data were not available for these creeks during 2002. USGS maintains a streamflow gage on Winberry Creek (station 14150800). Using measured flows in Winberry Creek and the estimated without-dam streamflow at the Fall Creek dam site, estimates of streamflow in Fall Creek were obtained by difference. Measured temperatures in Winberry Creek (7.7 mi upstream of the dam site) and Fall Creek (11.2 mi upstream of the dam site) were adjusted to account for a typical amount of downstream heating that would occur during warm summer periods, using techniques previously described in the section, “Methods and Models.” To extend the without-dam temperature estimates to the rest of the 2001–02 period, a correlation of these estimated temperatures to measured temperatures at a site with similar characteristics was constructed. The only nearby unregulated stream site with a complete temperature dataset is the SF McKenzie River upstream of Cougar Reservoir; however, that river derives a substantial part of its flow from the snowmelt and spring-fed High Cascades, which does not match the characteristics of the Fall Creek and Winberry Creek drainages. A dataset from a site farther away, then, but from a stream whose drainage area is entirely in the Western Cascades, might be better suited for this correlation. To test this hypothesis, the Fall Creek without-dam temperature estimates were correlated to measured water temperatures from the SF McKenzie River upstream of Cougar Reservoir (USGS station 14159200) and from Blowout Creek near Detroit (USGS station 14180300). Both tests correlated the daily means and daily ranges separately. The Blowout Creek regression produced better predictions (MAE of 0.71 °C versus 0.93 °C for the SF McKenzie River regression), particularly early in the summer. The following equation from the Blowout Creek regression, therefore, was used:
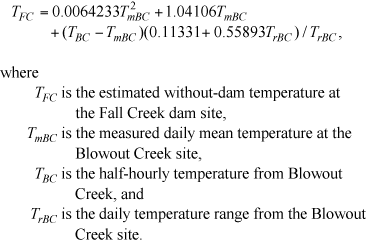
Correlation coefficients for the daily mean and daily range regressions were 0.962 and 0.800, respectively. This regression was used to estimate Fall Creek without‑dam temperatures for January 1–June 12 and October 17–December 31 of 2001 and for the entire year of 2002. A comparison of the estimated 2002 temperatures with data from nearby Little Fall Creek (LASAR site 28092), an unregulated stream in the adjacent drainage to the north, demonstrated that the without-dam temperature estimates for Fall Creek were representative, at least for the July–August period when data from Little Fall Creek were available. Without-dam water temperature estimates for the Fall Creek dam site (fig. 10A) compare favorably with those from the Blue River dam site, another site with a drainage area entirely within the Western Cascades. The annual maximum without-dam 7dADM temperatures for these two sites are nearly identical, with those from Fall Creek slightly warmer at about 21.5 °C (table 4). The without-dam temperatures have the same seasonal pattern as those from other sites with maximum temperatures occurring in July or August, whereas the with-dam temperatures are affected by dam operations and the choice of release point. It is obvious, for example, that the release point from Fall Creek Dam was changed to a point deeper in the reservoir on September 3, 2002, because the downstream temperature decreased abruptly at that time. Errors in the without-dam temperature estimates at the Fall Creek dam site are derived from measurement error, errors in the application of the estimated downstream warming rate, and regression prediction errors. The downstream warming was applied over a relatively short distance (7.7 mi on Winberry Creek and 11.2 mi on Fall Creek), so an error of as much as 0.05 °C/mi would result in an error no larger than 0.6 °C. Measurement errors typically are no larger than 0.2 °C, and the mean absolute error associated with the Blowout Creek regression was 0.7 °C. Uncertainties associated with the without-dam temperatures, therefore, likely are no larger than 0.8 to 1.5 °C (table 5). Fern Ridge DamFern Ridge Dam is located on the Long Tom River northwest of Eugene, Oregon. At only 44 ft high, it is the shortest dam included in this study, but it impounds almost as much water as Fall Creek Dam, which is four times taller. Upstream of the dam is Fern Ridge Lake, a large but shallow reservoir that has high value for wildlife and recreation in addition to providing flood control and irrigation water for downstream populations. The dam and lake are situated in the Willamette Lowlands physiographic area, with an upstream drainage area that extends into the Coast Range (fig. 2). Few measured temperature data were available upstream of Fern Ridge Lake for 2001–02. Data were available from Coyote Creek, a tributary to the lake, and from a site on the Long Tom River 28.3 mi upstream of the dam. The Coyote Creek temperatures, however, appeared to be too warm to be representative of Long Tom River temperatures upstream of Fern Ridge Lake because mid‑summer Coyote Creek temperatures were as warm as or warmer than measured temperatures downstream of Fern Ridge Dam. Similarly, the available upstream Long Tom River data were from a site that was far upstream and in a different physiographic province (Coast Range), characteristics making those data less representative of temperatures that would occur in the valley bottom. An alternate method of estimating without-dam temperatures at the Fern Ridge dam site was needed. Temperature measurements upstream and downstream of Fern Ridge Lake from 1946 to 1962 were compiled and analyzed by Moore (1964, 1967) to assess the thermal effects of Fern Ridge Dam. The analysis was based on spot measurements, and the aggregated monthly results illustrate the heating effects of the lake in spring through autumn and the cooling effects in winter (fig. 11). A nonlinear equation was fitted to those data as an estimate of the heating or cooling effect of the lake as a function of the day of year. Using measured temperatures just downstream of the dam, those heating or cooling effects of the lake could be removed by subtracting the fitted function in figure 11 to estimate water temperatures that might have occurred upstream of Fern Ridge Lake. Measured temperatures near the dam were available for all of 2002 and starting August 2001 from the USGS station at Alvadore (14169000). Temperatures for June and July 2001 were estimated for that site by PSU (Annear and others, 2004a). After applying the reservoir-heating correction to estimate water temperatures upstream of Fern Ridge Lake, those results were used to estimate without-dam temperatures at the Fern Ridge dam site. A maximum downstream warming rate of 0.11 °C/mi was applied over the 11.9 mi from the upstream site to the dam site for those times when warming was likely to occur. With-dam annual maximum 7dADM temperatures at the Fern Ridge dam site are warmer than without-dam counterparts during 2001 and 2002, demonstrating that Fern Ridge Lake typically warms the Long Tom River during summer (table 4, fig. 10B). The seasonal temperature patterns for with- and without-dam conditions are similar, which is consistent with Fern Ridge Dam not being tall enough to keep and release any significant quantity of cold water at the bottom of Fern Ridge Lake. Errors inherent to the monthly heating and cooling pattern in figure 11 are on the order of 0.8 °C. Uncertainties in the without-dam temperature estimates for this site, however, probably are larger than 0.8 °C because the process used to estimate temperatures upstream of the lake retains the daily temperature variations measured downstream of the dam, which are smaller than those that might occur in the absence of the dam. This method, therefore, underestimates the without-dam daily temperature range in mid-summer, resulting in errors that are likely to be about 1.0 °C and at times perhaps as large as 2.0 °C (table 5). Foster DamFoster Dam is located on the South Santiam River near Sweet Home, Oregon, southeast of Albany. Foster Dam serves partially as a re-regulating dam downstream of the much larger Green Peter Dam on the Middle Santiam River. Foster Lake is a popular recreational area during summer. The upstream drainage area for both Foster and Green Peter Lakes lies entirely within the Western Cascades physiographic region. Estimation of without-dam water temperatures at the Foster dam site relied on methods similar to those used for the Dexter dam site. Foster and Dexter Dams have other dams upstream, so the estimation process began upstream of the most-upstream reservoir. In 2002, hourly water-temperature data upstream of Green Peter Lake were available from Quartzville Creek (LASAR site 10791) and the Middle Santiam River (LASAR site 23805), which are the two major inflows to the lake. Downstream of Green Peter Dam, the other major inflow to Foster Lake is the South Santiam River. Water-temperature data from the South Santiam River upstream of Foster Lake were available in 2002 from ODEQ (LASAR site 30514). Flow in the South Santiam River upstream of Foster Lake was estimated as the difference between the without-dam streamflows at the Foster and Green Peter dam sites, and flow in the Middle Santiam River upstream of Green Peter Lake was estimated as the without-dam flow at Green Peter minus the measured flow in Quartzville Creek at USGS station 14185900. A flow-weighted energy balance was used to combine these three temperature datasets, but only after accounting for the warming that would occur as water from each of these sites traveled downstream to the Foster dam site. The Quartzville Creek, Middle Santiam, and South Santiam temperature measurements sites were 17.6, 19.2, and 9.0 mi upstream of Foster Dam, respectively. A maximum downstream warming rate of 0.11 °C/mi was applied, with minimum and maximum thresholds of 10 and 16 °C as applied previously for other sites. This method resulted in without-dam water temperatures at the Foster dam site for April 23–September 11, 2002. The datasets for Quartzville Creek and the South Santiam River for this time period had sizeable gaps. When data for Quartzville Creek were absent, the Middle Santiam River data were the only measurements of temperature upstream of Green Peter Lake. Similarly, when South Santiam River temperatures were absent, temperature estimates at the Foster dam site were derived only from data upstream of Green Peter Dam. For 2001, a similar approach was used, but with data from slightly different sites. The measured temperatures in the Middle Santiam River upstream of Green Peter Lake in 2001 were rated as poor by ODEQ and therefore were not used. A comparison of the 2002 temperatures from Quartzville Creek and the Middle Santiam River showed great similarity, both in their daily means and daily ranges. Using only the Quartzville Creek data to represent temperatures upstream of Green Peter Lake, therefore, was justified. The temperature measurement site on the South Santiam River was at a different location in 2001 (LASAR site 28615, 5.1 mi upstream of Foster Dam). Applying a flow-weighted energy balance and an appropriate level of downstream warming as described previously (maximum rate of 0.11 °C/mi, etc.), without-dam temperature estimates were obtained for August 3–September 28, 2001. The without-dam temperature estimates at the Foster dam site were extended to the rest of 2001–02 using correlations to measured water temperatures at the Blowout Creek site in the North Santiam River basin (USGS station 14180300). The Blowout Creek site was a good choice because its drainage area and the drainage area upstream of Foster Dam are both entirely within the Western Cascades. Separate regressions were made for the 2001 and 2002 datasets, and the results were similar, demonstrating that the input datasets for the two time periods showed consistent patterns and magnitudes. A combined regression could have been constructed, but the results would not have been significantly different. Separate regressions were made for the daily means and daily ranges, and the following equations were determined:
Correlation coefficients for the daily mean and daily range regressions were 0.977–0.997 and 0.872–0.881, respectively. If the datasets had been combined, it is clear that similar coefficients would have been derived, with the daily mean temperature at the Foster dam site approximately 20 percent higher than that at Blowout Creek, and a daily temperature range about 76 percent of the range at Blowout Creek. The estimated without-dam temperatures at the Foster dam site are much warmer in mid-summer than the measured with-dam temperatures at Foster Dam (fig. 10C). The cooler measured temperatures are a direct result of the large volume of cold water released from Green Peter Dam upstream. The without-dam temperatures are similar to those derived for the Dorena, Dexter, and Cottage Grove dam sites, with annual maximum 7dADM temperatures of about 24.5 °C (table 4). These maxima are substantially warmer than their with-dam counterparts (about 13.2 °C). Uncertainties in the without-dam temperature estimates at the Foster dam site are derived from measurement error (0.2 °C), inaccuracies in the applied downstream warming rates (as much as 0.8 °C), and regression error (approximately 0.6 °C). An approximate total uncertainty, therefore, is likely to be in the range of 0.8–1.5 °C (table 5). Green Peter DamGreen Peter Dam impounds Green Peter Lake on the Middle Santiam River upstream of Foster Lake. The two major inputs are Quartzville Creek and the Middle Santiam River, with the former providing about 30–40 percent of the flow during summer. The entire upstream drainage area lies within the Western Cascades (fig. 2). Flow data are available from a USGS gaging station on Quartzville Creek upstream of the lake (station 14185900). ODEQ temperature data are available at or near that streamflow-gaging station (LASAR site 10791) during parts of 2001–02, and USGS temperature data are available at the gaging station beginning in 2008. Some temperature data also are available on the Middle Santiam River upstream of the lake (LASAR site 23805), but the data from 2001 were rated poor by ODEQ, and the 2002 data were comparable to the Quartzville Creek temperatures. Although the 2002 without-dam temperature estimates at the Foster dam site were derived from both the Quartzville Creek and Middle Santiam River temperatures upstream of Green Peter Lake, the similarity of the temperatures at these sites and the longer record at the Quartzville Creek site led to a decision to base the without-dam temperatures at the Green Peter dam site only on the Quartzville Creek data. Using those data (August 3–September 28, 2001, April 23–May 31, 2002, and July 12–September 11, 2002), a regression was developed with measured temperatures at the Blowout Creek site (USGS station 14180300), which is located in an adjacent drainage to the east. An excellent fit was derived, with a mean absolute error of only 0.44 °C (see equation 19).
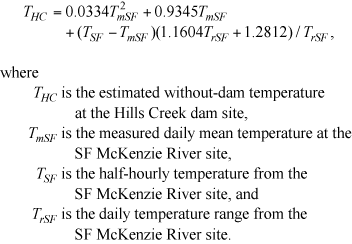
Correlation coefficients were 0.991 and 0.675 for the daily mean and daily range regressions, respectively. Without-dam temperatures at the Green Peter dam site were estimated using the measured and correlated Quartzville Creek temperatures upstream of Green Peter Lake. A maximum downstream warming rate of 0.11 °C/mi was applied over the 10.2 mi distance from the temperature measurement site to the dam site (see section, “Methods and Models”). The resulting without-dam temperature estimates are plotted along with a limited dataset of measured temperatures at the Green Peter dam site in figure 12A. The without-dam temperatures at the Green Peter dam site are nearly identical to the without-dam temperature estimates at the Foster dam site, but slightly cooler. The without-dam temperatures at the Green Peter dam site fall neatly into a group with those from the Foster, Dexter, Dorena, and Cottage Grove dam sites, all of which are similar by having a substantial drainage area in the Western Cascades (table 4). Estimates for the Blue River dam site are slightly cooler, probably as a result of a higher elevation. Uncertainties in the Green Peter without-dam temperatures can be estimated on the basis of measurement error (0.2 °C), correlation error (0.4 °C), and error in the downstream warming rate (<0.5 °C), for a total range of approximately 0.5–1.0 °C (table 5). Hills Creek DamHills Creek Dam is located on the MF Willamette River near Oakridge, Oregon, and upstream of both Dexter and Lookout Point Dams. Major inflows to the lake are from Hills Creek and the MF Willamette River. The Hills Creek drainage area primarily is in the Western Cascades, but the MF Willamette River extends up into the High Cascades. As a result, summertime inflows to Hills Creek Lake are fed partially by the snowmelt and colder springs of the High Cascades. Combined with an elevation of about 1,250 ft above sea level, temperatures in the MF Willamette River at the Hills Creek dam site should be relatively cool in mid-summer compared to lower elevation sites and sites that do not derive flow from the High Cascades. Without-dam temperatures at the Hills Creek dam site were derived from measured temperatures upstream of Hills Creek Lake. Temperature data were available for both Hills Creek (LASAR site 27982) and the MF Willamette River (LASAR site 27986) upstream of the lake for June 5–September 30, 2001, but temperature data were not available for Hills Creek for 2002. Streamflow data were not available for either inflow, but an energy balance could be derived by weighting those temperatures with their upstream drainage areas (52.8 mi2 for Hills Creek, 258 mi2 for the MF Willamette River) after accounting for the warming that was likely to occur from those sites to the dam site. A maximum downstream warming rate of 0.11 °C /mi was applied over a distance of 4.2 mi from the Hills Creek site to the dam, and 8.5 mi on the MF Willamette River. To extend these temperature estimates to the entire 2001–02 time period, the without-dam data were correlated against measured temperatures in the SF McKenzie River above Cougar Reservoir (USGS station 14159200). A correlation to Blowout Creek data also was constructed, but the correlation to the SF McKenzie River data was better, with a mean absolute error of 0.51 °C as opposed to 0.85 °C. This result is not surprising, as SF McKenzie River data are more representative of the magnitude and patterns of temperature in a High Cascades stream, whereas Blowout Creek data are more representative of temperatures in a Western Cascades stream. Separate regressions were constructed for the daily means and daily ranges, resulting in the following equation:
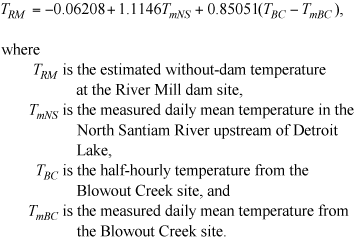
Correlation coefficients for the daily mean and daily range regressions were 0.931 and 0.889, respectively. The without-dam temperature estimates at the Hills Creek dam site have a similar seasonal pattern but are several degrees cooler in mid-summer than the without-dam temperature estimates at the Dexter dam site (fig. 12B, fig.9B). Annual maximum without-dam 7dADM temperatures at the Hills Creek dam site are less than 20 °C, cooler than all dam sites that have substantial drainage areas in the Western Cascades (Blue River, Cottage Grove, Dexter, Dorena, Fall Creek, Foster, Green Peter), but warmer than dam sites that have a substantial fraction of their drainage in the High Cascades (Big Cliff and Cougar). Uncertainties in the without‑dam temperatures at the Hills Creek dam site are relatively small because errors in the downstream warming rate are accumulated over a short distance (maximum 8.5 mi, perhaps as large as 0.4 °C), and the correlation to SF McKenzie River temperatures was good (MAE 0.5 °C). A typical error in the without-dam estimates then should be no more than 0.5–1.0 °C (table 5). River Mill DamRiver Mill Dam is located on the Clackamas River near Estacada, Oregon, and is the most downstream of a series of hydropower projects owned and operated by Portland General Electric in the Clackamas River basin. Like the North Santiam and McKenzie Rivers, the Clackamas River derives some of its flow from the High Cascades but also has a substantial drainage area in the Western Cascades (fig. 2). The hydropower projects in the Clackamas River system recently underwent a relicensing process overseen by the Federal Energy Regulatory Commission (FERC). As part of that process and a related water-quality certification process through ODEQ, models of the Clackamas River were constructed to determine the flow and temperature effects of the hydropower projects. One of the model scenarios was a “no-project” scenario to simulate the river without the hydropower dams and diversions (Oregon Department of Environmental Quality, 2006b). No-project temperature predictions from the Clackamas River model at the River Mill dam site from April 9, 2000, to September 30, 2001, were used as obtained from ODEQ to represent without-dam temperatures at that location. To cover the rest of 2001 and all of 2002, the no-project temperatures were correlated with measured temperatures at nearby sites. Five different correlation sites were tested using the 2001 no-project estimates including all three major inflows to Detroit Lake and a site on the Little North Santiam River in the adjacent North Santiam River basin to the south. The daily means and daily ranges were correlated separately to reduce timing (phase) errors. All tested regressions captured most of the seasonal pattern in the no-project temperatures, but the regression with North Santiam River temperatures upstream of Detroit Lake (USGS station 14178000) produced the best fit (MAE 0.61 °C). Expanding the dataset by adding the 2000 data did not improve the correlation. The seasonal pattern in the daily temperature range from the North Santiam River site was not the best match for the seasonal pattern in the daily temperature range from the Clackamas River dataset. The North Santiam River regression produced a smaller daily range in late summer and early autumn than was evident in the Clackamas River dataset. A correlation with daily ranges from the Blowout Creek site provided a better match. The final regression, therefore, relied on daily mean temperatures from the North Santiam River upstream of Detroit Lake and daily temperature ranges from Blowout Creek, illustrating the wide variety of regression models that might be constructed. The final equation was:
Correlation coefficients were 0.993 and 0.902 for the daily mean and daily range regressions, respectively. This regression model produced an MAE of 0.55 °C, and was used to estimate without-dam temperatures at the River Mill dam site for September 30, 2001–December 31, 2002. A comparison of the modeled and estimated without-dam and measured with-dam temperatures at or near the River Mill dam site shows a great similarity in the two datasets (fig. 12C). The seasonal patterns are nearly identical, and the annual maximum 7dADM temperatures are roughly comparable (table 4), but the measured temperatures downstream of River Mill Dam have a much smaller daily variation than the without-dam temperature estimates. The similar seasonal patterns probably are the result of the fact that the hydropower projects on the Clackamas River are largely run-of-the-river; they have limited storage capacity and therefore cannot store a large amount of heat absorbed in mid-summer for release later in the year. Most of the dams in the Clackamas River system, with the possible exception of North Fork Dam, also are not so tall that they generally release water from a hypolimnion that is colder than the surface water. The presence of the dams, however, may account for the lack of daily variation in the with-dams temperatures. Uncertainties in the without-dam Clackamas River temperatures at the River Mill dam site derive from model error and correlation error. Although the correlation error was calculated to be approximately 0.6 °C, the model error for the no-project scenario is somewhat unknown. It is likely that the model as calibrated to existing conditions had a typical error on the order of 0.5 to 1.0 °C, but the no-project scenario error is subject to additional uncertainty inherent to assumptions used to construct that model scenario. Uncertainties in these without-dam temperature estimates, therefore, are likely to be at least 1.0–1.6 °C (table 5). Downstream Effects of Willamette Basin DamsTo determine the effects of Willamette River basin dams on streamflow and water temperature downstream of those projects, the suite of CE-QUAL-W2 models used as the basis of the Willamette River temperature TMDL were run for scenarios with and without the dams in place. These models simulate the entire Willamette River and its major tributaries up to the first major dam on each tributary (see fig. 1). Both scenarios were based on the NTP model runs from the TMDL, which specified that riparian vegetation was restored to a more natural state, instream hydropower projects and power diversions were eliminated (such as those along the McKenzie River and at Willamette Falls on the Willamette River), and point sources were removed. Water withdrawals, upstream dams, and a modern channel shape were retained in the NTP model scenario. To create the without-dams scenario, the upstream flow and temperature boundary conditions were simply switched from the with-dam datasets to without-dam datasets, leaving the rest of the models unchanged as much as possible. Other than the upstream boundary conditions that were used to specify with- or without-dam conditions, several other modifications to the TMDL models were necessary to allow them to run under a no-dams scenario. For example, water withdrawals from the South Santiam River downstream of Foster Dam during mid-summer can exceed the streamflow that would occur in a no-dams scenario. To keep the river from going dry and enabling the model to run and remain stable in a no-dams scenario, those withdrawals had to be reduced. All withdrawals were eliminated if the flow at the Foster dam site was less than 88 ft3/s (2.5 m3/s), and withdrawals were gradually increased to their full amount when flows at Foster were equal to or greater than 177 ft3/s (5.0 m3/s). In addition, the total withdrawal rate was constrained to be less than 90 percent of the 5-day minimum flow at Foster. For the Coast Fork / Middle Fork Willamette River model, modifications were needed for some of the ungaged tributary inputs that were used in the model calibration to adjust river flows to match measured flows. These water-balancing flows had been used in part to eliminate inconsistencies between measured upstream reservoir releases and downstream flow measurements. For the no-dams scenario, such adjustments were no longer entirely applicable, and their use in losing reaches caused the model to either dry up or become unstable. These flow adjustments as used in the calibrated model also were far too frequent (half-hourly) and contained many abrupt changes (spikes) in flow. To resolve these problems, the inputs for these flow-correcting features (model tributaries 2–11 and the distributed tributary in model branch 10) were smoothed to remove short-term spikes, and maximum losses to groundwater were limited late in the summer. These changes allowed the Coast Fork / Middle Fork Willamette River model to run under a no-dams scenario, but the resulting simulated flows in these reaches are far more uncertain than those in other parts of the model domain. Downstream FlowsThe presence of large flood-control and storage dams typically reduces annual peak flows and increases annual minimum flows downstream of those dams. This effect is easily discernible in the Willamette River through an examination of long-term measurements at the USGS streamflow-gaging stations at Albany (14174000) and at Salem (14191000), where historical records go back to 1892 and 1909, respectively (fig. 13). Most of the major dams in the Willamette River basin were constructed from 1941 to 1969 (table 1). That transition period shows a decrease in the magnitude of annual peak flows as well as a distinct increase in annual minimum flows from approximately 2,500 to 4,000 ft3/s at Albany, and from 3,000 to 6,000 ft3/s at Salem. Simulated streamflows for the with- and without-dam model scenarios illustrate the expected flow-augmentation effects of the dams in mid- to late-summer. Streamflow in the Willamette River at Albany decreases to a minimum near 2,000 ft3/s without the dams, whereas the with-dam scenario results in streamflows greater than 4,000 ft3/s or even 5,000 ft3/s for most of July–October (fig. 14). A similar effect occurs at Salem, where the without-dam streamflow decreases to a range near 2,500–3,000 ft3/s, yet the with-dam streamflow maintains a minimum greater than 6,000 ft3/s. The operation of upstream dams for flood control and downstream navigation results in lower annual peak flows and higher minimum summer flows in the Willamette River. With the wealth of streamflow data going back to the 19th century at Willamette River gaging stations, a model was not necessary to verify these effects. Streamflow, however, affects travel times through the river system and can have an important effect on water temperature. Downstream TemperaturesUpstream dams affect downstream temperatures through changes in the release temperatures at the dam sites as well as through changes in downstream flows. The presence or absence of upstream reservoirs affects downstream flows not only through reservoir releases but also as a result of changes to the regional groundwater system (Constantz and Essaid, 2007). Decreased flows in late summer in the absence of upstream dams results in longer travel times, allowing more time for river temperatures to respond to the influences of weather, water withdrawals, groundwater inputs, riparian shading, and point-source heating or cooling effects. Decreased flows also mean that less water is in the river, providing less thermal mass to resist changes in temperature and potentially altering the surface area to volume ratio, an important factor in determining the heat exchange flux per unit mass; a larger ratio enhances temperature changes due to surface heat-exchange processes. Because streamflow-modification effects on water temperature take time to occur, the effects are manifested well downstream of the dam sites. In contrast, alterations to stream temperature at a dam site provides an immediate heating or cooling effect that tends to dissipate with distance downstream as the river has time to exchange heat with its surroundings. These near- and far-field effects were explored and quantified by Risley and others (2010) for an idealized river system under several climate conditions, with and without upstream reservoirs and with varying groundwater inputs or losses, demonstrating that the far-field streamflow effects are just as important as the near-field release temperatures in determining the downstream thermal effects of dams. For this study, modeled river temperatures for the with- and without-dam scenarios were assessed using the 7dADM temperature, which is specified by Oregon’s maximum water-temperature standard. The 7dADM temperature was calculated at every location in the model domain and for every day that was modeled in the June–October 2001 and April–October 2002 time period. The downstream temperature effects of the dams then were determined by subtracting the without-dams 7dADM temperatures from the with-dams 7dADM temperatures. The results are conveniently visualized by plotting the 7dADM temperature differences with a time/distance color map as in figure 15 for the Willamette River. Similar plots for most of the other modeled reaches are included in appendix B. Several important results and patterns can be derived from the color map showing the downstream temperature effects of the dams on the Willamette River. First, the pattern of cold-water releases in mid-summer and warmer releases in early autumn are apparent throughout the river. This pattern is most striking upstream of the McKenzie River confluence (RM 174.9) because that reach is closest to a series of upstream dams on the Middle Fork and Coast Fork Willamette River systems. Second, the magnitude of the temperature effect diminishes with downstream distance and dilution from tributaries. Upstream of the McKenzie River confluence, the effect can be more than 4 or 5 °C, warming or cooling at different times of the year. Closer to the dams, the effect is even larger and can be sustained for longer periods (see appendix B). Downstream of the McKenzie River but upstream of the Santiam River (RM 108.5), the maximum effect decreases to less than 3 or 4 °C but more typically less than 1.5 °C. Downstream of the Santiam River, the maximum effect decreases further, to less than 2.5 °C but more commonly less than 1 °C. Downstream of the Clackamas River confluence, the effect of upstream dams decreases to a level usually less than 0.5 or 1 °C. Third, the major tributary inflows do not necessarily dilute the effect of upstream dams because those tributaries also are affected by upstream dams. Several examples are evident in figure 15 where a cooling effect switches to warming, or vice versa, at a tributary junction because the effect of upstream dams in the tributary system can be larger than that in the Willamette River. The time/distance color map for the Willamette River shows several periodic variations with downstream distance, particularly in the July through September period. These patterns are an artifact of using the daily maximum temperature in the analysis. Downstream of dams that release a relatively steady flow of water with little daily variation in temperature, as is the case for many of the larger dams in this study, a distinct downstream pattern in the daily maximum temperature can occur (Lowney, 2000). This pattern is characterized by minimal daily temperature variation at integer travel-time distances (1 day, 2 days, etc.), and maximum temperature variation in-between (0.5 day, 1.5 days, etc.). For example, a larger maximum can occur 0.5 days downstream of a dam because some water will reach that location after exposure only to heating during the day, whereas a full heating and cooling cycle is complete when that water has traveled a full day. In any case, the results from each model scenario contain a downstream nodal pattern in the 7dADM temperature where the period is related to 1 day of travel time. Computing the difference of two scenario results with different nodal distances (because the flows are different) then produces a new downstream pattern that is an artifact of using the 7dADM rather than a mean temperature. To avoid problems associated with analyzing results that contain these travel-time artifacts, the distribution of 7dADM temperatures from each model scenario can be examined instead. These distributions for all modeled locations along the Willamette River are plotted in figure 16 for the June through October time periods of 2001–02. The lower plots (B and C) are simply histograms of the 7dADM temperatures from the without-dam and with-dam model scenarios, respectively, whereas the upper plot (fig. 16A) shows the cumulative frequency distribution for both scenarios. Similar plots for most of the other modeled reaches are included in appendix C. The histograms and the cumulative frequency plot for the Willamette River show a result that is shared by most of its tributaries. The with-dam 7dADM temperatures span a narrower range and tend to have higher minimum and lower maximum 7dADM temperatures than those without the dams. In the case of the Long Tom and Clackamas Rivers, however, the without-dam 7dADM temperatures tend to be cooler than the with-dam counterparts throughout the entire temperature range. These results, of course, depend on the without-dam flow and temperature estimates at the upstream dam sites; therefore, any errors in those estimates will affect the resulting without-dam temperature distributions. Regardless of any errors in the modeled without-dam temperatures, the general trends in the predictions are consistent with the physics of heat transport processes in river systems. The annual maximum temperatures at the dam sites are likely to be warmer without the dams because the reservoirs tend to buffer seasonal temperature changes and dam releases typically are not made from the warmer surface layer until later in the year after the reservoir begins to cool. Annual minimum temperatures also are likely to be cooler without the dams because it is far easier to cool a river in winter than it is to cool the bottom of a reservoir, which in the Willamette River basin is never likely to be colder than 4 °C. Given these patterns at the dam sites, and coupled with lower flows during mid-summer without the dams, it is logical to expect that annual maximum temperatures downstream of the dam sites would be warmer without the dams. The wider temperature range without the upstream dams is an important result from this study. Despite the fact that all of the without‑dam models use estimated temperatures at the dam sites, the results provide helpful guidelines for resource managers as they develop plans to manage dam operations for optimal fish habitat, among other goals. |
First posted August 17, 2010 For additional information contact: Part or all of this report is presented in Portable Document Format (PDF); the latest version of Adobe Reader or similar software is required to view it. Download the latest version of Adobe Reader, free of charge. |

![]() U.S. Department of the Interior |
U.S. Geological Survey
U.S. Department of the Interior |
U.S. Geological Survey
URL: http://pubsdata.usgs.gov/pubs/sir/2010/5153/section4.html
Page Contact Information: GS Pubs Web Contact
Page Last Modified: Thursday, 10-Jan-2013 19:14:25 EST

 (4)
(4) (5)
(5) (6)
(6) (7)
(7) (8)
(8) , (9)
, (9)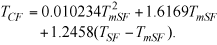 (10)
(10) (11)
(11) (12)
(12)  (13)
(13) (14)
(14) (15)
(15) (16)
(16) (17)
(17) (18)
(18) (19)
(19) (20)
(20) (21)
(21)