Scientific Investigations Report 2012–5068
Sampling Design and MethodsSampling SitesThis study was designed to characterize WWTP effluent and stormwater runoff directly entering the Columbia River. These pathways were examined separately, however, by focusing specifically on what contaminants were of interest for each pathway. This study was not designed as a paired study to compare the differences in these pathways, but rather to characterize what could be contributed by each. Because this was a reconnaissance study, the cities where samples were collected were selected throughout the basin to provide a range in sampling location, population characteristics, and climate setting—in downstream order along the Columbia River, they include Wenatchee, Richland, Umatilla, The Dalles, Hood River, Portland, Vancouver, St. Helens, and Longview (fig. 1, table 1). In each city, one sample was collected from the WWTP effluent just prior to where it enters the river (table 2). These one-time samples represented a variety of treatment techniques varying by the size of the treatment plant and the type of disinfection used. This study was not designed to evaluate these treatment techniques or differentiate the associated concentrations, but rather to collect preliminary data. A stormwater-runoff sample also was collected directly from a pipe in each city just prior to where the runoff enters the receiving waters, except for in Umatilla, Oregon, where the stormwater flowed into a percolation field (table 3). In the Portland/Vancouver area (fig. 2), extra samples were collected—two locations in Vancouver, Washington, and two locations in Portland, Oregon, where stormwater enters the Columbia River. Rather than draining directly to the Columbia River, much of the stormwater from the eastern Portland area is delivered to the Columbia Slough (fig. 2) which flows through Portland and enters the Willamette River just before it converges with the Columbia River. Much of the remaining stormwater from the western and southern areas of Portland flows through pipes into the Willamette River. For this study, stormwater runoff from four pipes discharging to the Willamette River also was sampled. Many cities, and Portland in particular, have older sewer systems that mix untreated sewage and stormwater runoff. When it rains, these systems are overwhelmed and combined sewer overflows (CSOs) carry untreated sewage to the receiving waters. During wet weather, Portland’s combined sewers overflow into the Willamette River an average of 100 times per year (Portland Bureau of Environmental Services, 2010). Phillips and Chalmers (2009) have shown that untreated discharge from CSOs can be an important source of contaminants to receiving waters. In an effort to prevent these CSOs and improve water quality, the city of Portland has constructed several “big pipes”—the Columbia Slough Big Pipe (completed in 2000), the West Side Big Pipe (completed in 2006), and the East Side Big Pipe (completed in 2011) (Portland Bureau of Environmental Services, 2010). These large (12- to 22-ft diameter) pipes help store and transport the overflow so that it can be treated before it is discharged. Combined sewer overflows to the Willamette River will be reduced by 94 percent when all east-side CSO construction is complete. These Big Pipes influenced the sampling locations for this study because they prevent stormwater pipes from delivering runoff to locations that previously received the runoff. Sites selected on the west side of the Willamette River are upstream (Willamette1) and downstream (Willamette2 and Willamette3) of the Big Pipe drainage areas (fig. 2). Sampling and Analytical MethodsTo characterize the nature of the water entering the Columbia River, each sample was collected in the WWTP at a point in the effluent stream past any treatment and just before the effluent enters the river. This was a dip sample in the effluent stream at most WWTPs, but in Longview, St. Helens, and Portland, the samples were pumped into the bottles by the onsite pumps. One sample was collected at each of the nine cities, except at Portland where samples were collected three times throughout the day (9 a.m., 12 p.m., and 3 p.m.) to examine temporal variability (table 4). Therefore, 11 WWTP‑effluent samples were collected. Similar to the samples collected at WWTPs, the stormwater samples were collected from the end of the pipe just before it entered the river. One sample was collected at each of the nine cities, except in Portland and Vancouver, where two locations were sampled in each city. An additional four stormwater locations were sampled along the Willamette River in an effort to better characterize stormwater runoff in the Portland area. Thus, a total of 15 locations were sampled for stormwater runoff. The original project plan did not include analysis of currently used pesticides in WWTP-effluent samples. Because pesticides make up 34 percent of the persistent pollutants list in Oregon Senate Bill (SB) 737 (Oregon Department of Environmental Quality, 2010a), however, a decision was made to revisit each WWTP during December 2009 to collect samples of effluent for analysis of pesticides and mercury. Oregon Department of Environmental Quality (ODEQ) was required by SB 737 to develop a list of priority persistent bioaccumulative toxics (persistent pollutants) that have a documented effect on human health, wildlife, and aquatic life. The 52 largest municipal WWTPs in Oregon analyzed their effluent in July and November 2010 for these persistent pollutants, and they currently are developing reduction plans for those compounds that were detected above plan initiation levels (PILs) determined as part of this process. All samples for this study were collected using standard methods described by U.S. Geological Survey (USGS; variously dated). Samples were placed into glass or Teflon® bottles depending on the type of analysis, and then composited into either a glass carboy or Teflon churn for processing. Samples were collected at most of the WWTPs in December 2008, but samples were collected in St. Helens and Longview in December 2009 because they were added later in the project (table 4). Wenatchee was resampled in 2009 due to sampling errors with the filtration apparatus in 2008 that compromised some of the analyses. The stormwater samples were collected throughout spring and winter storms of 2009 and 2010. 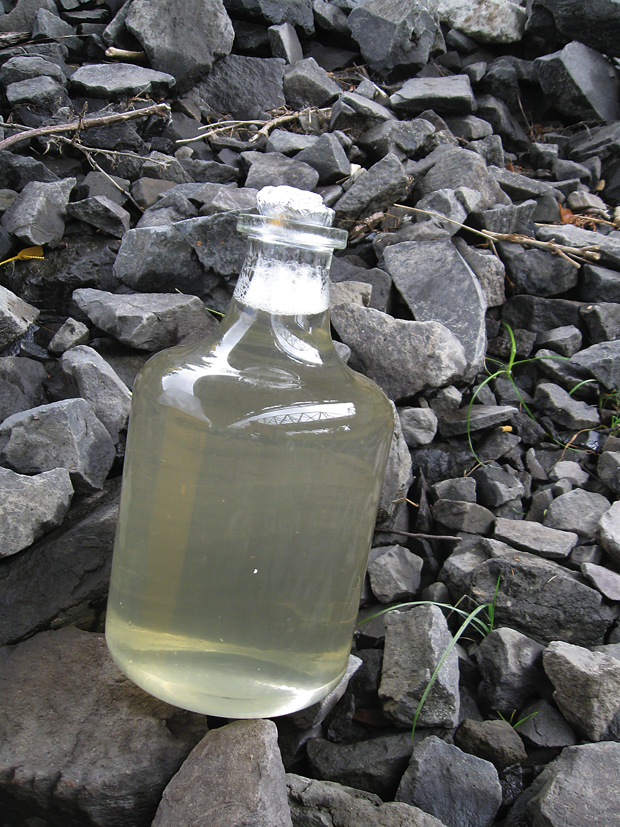
Stormwater-runoff sample in 20-liter glass carboy, collected from a pipe under the I-5 bridge on Hayden Island, Oregon, October 2009. Samples were placed on ice until they could be processed and shipped to the appropriate laboratory; most samples were shipped in less than 3 hours. Volunteers were used to collect stormwater samples in remote locations. These samples were shipped to the USGS Oregon Water Science Center before they were processed, resulting in a holding time of about 40 hours or less. While the sample was being mixed (required to resuspend any settled solids), unfiltered‑water samples were drained into their respective bottles. For filtered-water analyses, aliquots of the sample were filtered through a 142‑mm diameter, 0.7-µm pore-size glass-fiber filter and collected into amber glass bottles to be sent to the USGS National Water-Quality Laboratory (NWQL) in Denver, Colorado. Analytical Methods for Wastewater-Treatment-Plant-Effluent SamplesA full listing of all constituents analyzed, reporting limits, and method numbers is presented in appendix A. Because halogenated compounds like flame retardants, PCBs, and certain pesticides (table A1) are hydrophobic (preferentially associated with sediment particles), solid samples were collected for analysis. Because WWTP effluent is low in solids by design, about 20 liters (L) of effluent were filtered for each WWTP. These filters were sent to the NWQL for the analysis of halogenated compounds on the filtered solids. These analyses were done as an adaptation to the method used for analyzing these compounds in sediments (Steven Zaugg, National Water-Quality Laboratory, written commun., March 16, 2010), which involved extracting all material collected on the filters and concentrating it down to 1 mL of extract, which was analyzed for the entire suite of halogenated compounds. These concentrations, therefore, provide a measure of the hydrophobic compounds detected in the particulate phase and do not account for compounds present in the dissolved phase. For the WWTP-effluent samples, AOCs in unfiltered water (table A2) were analyzed at the NWQL by continuous liquid-liquid extraction and gas chromatography/mass spectrometry (GC/MS) using methods described by Zaugg and others (2006). Human-health pharmaceuticals (table A3) and currently used pesticides (table A4) in filtered‑water samples were analyzed at NWQL by GC/MS using methods detailed by Zaugg and others (1995), Lindley and others (1996), Sandstrom and others (2001), Madsen and others (2003), and Furlong and others (2008). In 2009 and 2010, unfiltered water samples were preserved with hydrochloric acid and sent to the USGS Wisconsin Mercury Research Laboratory for the analysis of total mercury and methylmercury by methods described by U.S. Environmental Protection Agency (2002) and DeWild and others (2002), respectively. Suspended‑sediment concentrations were determined at the Cascades Volcano Observatory Sediment Laboratory in Vancouver, Washington, according to methods detailed by Guy (1969). For samples collected at each city in 2008, a 1-L unfiltered WWTP-effluent sample was shipped on ice to the Columbia Environmental Research Center (CERC) in Columbia, Missouri, to be screened for total estrogenicity using the yeast estrogen screen (YES) by methods described by David Alvarez (U.S. Geological Survey, written commun., November 6, 2009). The YES assay uses recombinant yeast cells with a human estrogen receptor. If these cells bind to an estrogen or estrogen-mimic in the sample, then a number of biochemical reactions occur and result in a color change (Routledge and Sumpter, 1996; Rastall and others, 2004). This color change can be measured spectrophotometrically and the estradiol equivalent factor (EEQ) for the sample can be determined. The EEQ is an estimate of the amount of 17β-estradiol, a natural hormone, which would be needed to give an equivalent response to that of the complex mixture of chemicals present in the sample (Rastall and others, 2004; Alvarez and others, 2008). Therefore, a higher measured EEQ indicates a higher estrogenicity of the sample. 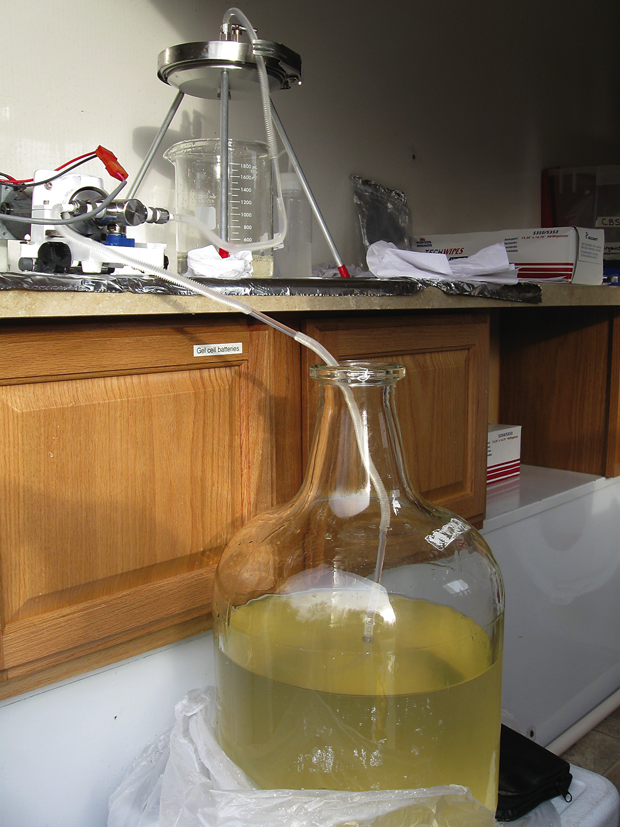
Filtering wastewater-treatment-plant effluent from the City of Portland, Oregon, December 2008. Analytical Methods for Stormwater‑Runoff SamplesHalogenated compounds on solids, currently used pesticides in filtered water, mercury and methylmercury in unfiltered water, and suspended-sediment samples collected from the stormwater runoff were processed in the same way as described for the WWTP-effluent samples. Additionally, stormwater-runoff samples were collected for the analysis of PAHs in unfiltered water (table A5) and trace elements in both filtered and unfiltered water (table A6). These samples were analyzed at the NWQL by methods described by Fishman and Friedman, (1989), Fishman (1993), Hoffman and others (1996), Garbarino and Struveski (1998), Garbarino and Damrau (2001), and Garbarino and others (2006). Unfiltered‑water samples were subsampled into bottles with sulfuric acid preservative and shipped on ice to the TestAmerica Laboratory in Arvada, Colo., for analysis of oil and grease by EPA method 1664A (U.S. Environmental Protection Agency, 1999). 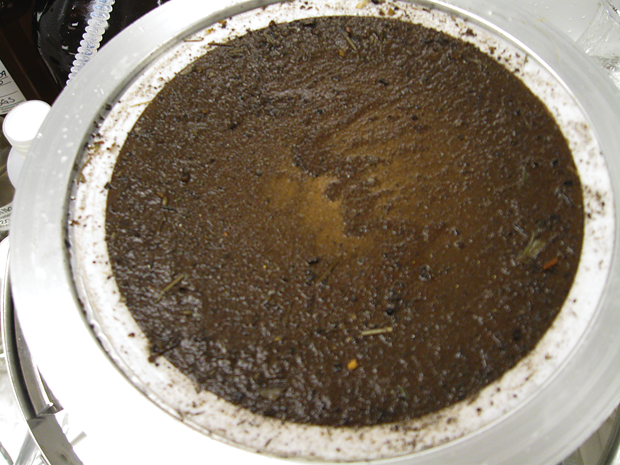
Filter paper after filtering stormwater-runoff sample from the City of Umatilla, Oregon, October 2009. Reporting of DataWhen an analyte is measured in a laboratory, it is either detected or not detected. When it is not detected, it is reported as “censored” or less than the reporting limit (RL). This does not mean that the analyte is not present; it simply means that it could not be detected in a sample under the conditions present in the laboratory or the sample matrix. The analyte may be present, but at a concentration lower than the instrument can measure. Likewise, the presence of other material or analytes in the sample may be causing interference, preventing the accurate quantification of the analyte in the sample, or the analyte may not be present at all. If, however, the analyte is detected, it may be reported in several different ways. If it is detected at a concentration greater than the RL, then the value is simply reported at the concentration measured. If the analyte is a “poor performer” (long-term variability or poor recovery) in laboratory performance samples or if matrix problems caused interference for that analyte in the sample, the measured concentration may be qualified as an estimated (E) value. The concentration also may be reported as an estimated value if the analyte is detected at a concentration less than the RL but greater than the method detection limit (MDL). The MDL is a statistically derived minimum concentration that can be measured with a 99 percent confidence of being greater than zero (Oblinger Childress and others, 1999; Bonn, 2008). Therefore, there is a less than a 1 percent chance that an analyte will be reported as a false positive, or that the concentration was reported but the analyte was not present. If the analyte is detected at a concentration less than the MDL or RL (for those analytes for which a MDL has not yet been established), then, in this report, the result is reported as “Present,” indicating that the presence of the analyte was verified, but that the concentration was too small to be quantified. The NWQL reevaluates the RL and MDL values every year and adjusts them as needed based on the laboratory performance data. Because of these adjustments, multiple RLs may be shown for a given analyte. Additionally, matrix interference issues, which were numerous in this study due to the complex nature of the effluent and runoff, can cause the RL for a certain compound for individual samples to be raised as well. The data for the halogenated compounds on solids were reported from the NWQL as the mass of the given analyte detected in the sample (in nanograms). This mass was then divided by the number of liters filtered, to obtain a concentration of the analyte for the sample (in nanograms per liter, ng/L). Detections for this analysis were reported only if the mass was greater than the RL or five times the highest value reported in the laboratory blank, trip blank, or analyses of the filter papers themselves. Detections less than these levels were reported as “Present.” Quality AssuranceQuality assurance is the analysis of quality-control (QC) data as a means to assess potential contamination and variability associated with sampling and laboratory techniques. Quality control samples for this study comprised field blanks and replicate environmental samples (table 5), as well as internal laboratory QC data such as set blanks, set spikes, and surrogate recoveries. Between 1 and 3 blanks and 2 and 4 replicates were collected for each analytical method. For some combinations of method and sample type (currently used pesticides in WWTP samples), no blanks were collected, although for most combinations, one blank and two replicates were collected. QC samples were collected throughout the sampling periods to assess any annual variability in laboratory performance. Results of all of these QC samples were used to qualify the environmental data. Field blanks were collected by passing a volume of contaminant-free water (organic blank water) through sampling and processing equipment that an environmental sample would contact. The results of field blanks are used to assess contamination issues associated with cleaning, sampling, processing, or transporting the sample. In addition to a field blank for the halogenated compounds on solids, the filter papers themselves were run through the process to assess whether they may be affecting the analysis. Replicate environmental samples test for precision, which is a measure of the variability between two or more samples caused by variability in laboratory processing techniques and measurement precision. Replicate samples were collected consecutively, except for the stormwater sample collected at Portland2. That sample was collected into one glass carboy, agitated to resuspend solids, and then split in the laboratory during processing. “Surrogate compounds” have properties similar to those of the target compounds; surrogate compounds are added to the sample at the laboratory and analyzed as part of the list of analytes. Surrogate compounds are expected to behave similarly to the target analytes and are used to monitor the performance of the method used for the target analytes they represent. The NWQL uses the surrogate recoveries to assess problems associated with individual samples or sets of samples, but also uses long-term surrogate recoveries to assess long-term analytical precision. Surrogate recoveries in this study were good for blank samples but generally low for environmental samples (table 6). This was probably due to matrix-interference issues. The actual concentrations in the samples may have been underestimated by the analyses; therefore, this report represents a conservative measure of the contaminants delivered by WWTP effluent and stormwater runoff. Because of the large variations in sample recoveries and sample performance, care should be used in drawing comparisons between sample sets. Although the validity of quantitative comparisons may be compromised by this variability, qualitative analyses, based on the presence or absence of these compounds, provide a way to compare these types of datasets. Results of Quality-Control DataThere were only a few analytes with detections in the field blanks (table 7), and most were not at levels that warrant concern with respect to the environmental detections. For those compounds with detections in a blank sample (a field, filter, or set blank), the highest detected value in the blank was multiplied by five and this new value was used as a “raised reporting level.” If a detected concentration was less than this raised reporting level, then it was reported as “Present,” rather than the actual concentration. Method blanks for the oil and grease analyses showed consistent and significant detections. Nearly one-half of the method-blank samples had detectable concentrations equal to at least one-half of the coinciding environmental-sample concentration. The environmental and blank results are reported together so that the user is aware of these issues (see section “Oil and Grease”). When comparing differences in concentrations from different sites or different times, the analytical and environmental variability must be considered. Examining environmental replicate data can help quantify this variability. Relative percent difference (RPD) values, which provide a measure of how well the concentrations from two samples agree, were calculated for all environmental replicate data pairs (table 8). The RPD is calculated as the absolute difference between two values, normalized to the average value, and expressed as a percentage.
An RPD close to zero shows good agreement between the sample results, but some RPDs in this study are high. This probably is due to a number of variables, including methods used to analyze unfiltered water, low concentrations in samples, and the inherent variability in some of the methods, which may be linked to matrix effects. |
First posted April 25, 2012 For additional information contact: Part or all of this report is presented in Portable Document Format (PDF); the latest version of Adobe Reader or similar software is required to view it. Download the latest version of Adobe Reader, free of charge. |

![]() U.S. Department of the Interior |
U.S. Geological Survey
U.S. Department of the Interior |
U.S. Geological Survey
URL: http://pubsdata.usgs.gov/pubs/sir/2012/5068/section3.html
Page Contact Information: GS Pubs Web Contact
Page Last Modified: Thursday, 10-Jan-2013 19:50:36 EST