Triangular-Hydrograph Recession-Ratio Fit Spreadsheets
Explanation:
These spreadsheets are designed to facilitate the hydrograph separation and fitting process. Once a storm has been identified, the first step of the hydrograph analysis process is to import the data for each selected runoff event into one of these unit-hydrograph spreadsheet, and do hydrograph separation. Hydrograph separation is necessary for normalizing the total amount of runoff that occurs during the storm. The end of the storm was loosely defined at the point where the falling limb of the hydrograph approached an asymptotic value. The spreadsheet calculates the beginning base-flow value as equal to the first line in the streamflow sample and the ending baseflow value as defined in the heading rows of the spreadsheet. The next step of the hydrograph analysis process is to use the Microsoft Excel solver to optimize the least-squares fit of a triangular hydrograph to the unit hydrograph calculated from data; trim the data as needed to align the measured and triangular storm peaks. If the triangular peak lags the curvilinear peak then one or more flow values are be trimmed from the beginning of the runoff period and the hydrograph separation, normalization, and fitting process is repeated. If the triangular peak preceds the curvilinear peak then one or more flow values are trimmed from the end of the runoff period and the hydrograph separation, normalization, and fitting process is repeated. If it is necessary to analyze longer storms, however, these spreadsheets can be modified by copying the equations downward to include more rows.
Microsoft Excel spreadsheet templates for fitting instantaneous steamflow data to triangular hydrographs:
Hydrograph01.xls This file can be used to process storms with up to 480 data points (5 days of 15 minute data)
Hydrograph02.xls This file can be used to process storms with up to 880 data points (9 days of 15 minute data)
HydrographXLS.zip This file is a zip file containing the two "Hydrograph" spreadsheets
Example spreadsheets for fitting USGS curvilinear hydrographs to triangular hydrographs:
USGS01.xls
USGS02.xls
USGS03.xls
USGShydrographs.zip This file is a zip file containing the three "USGS" spreadsheets
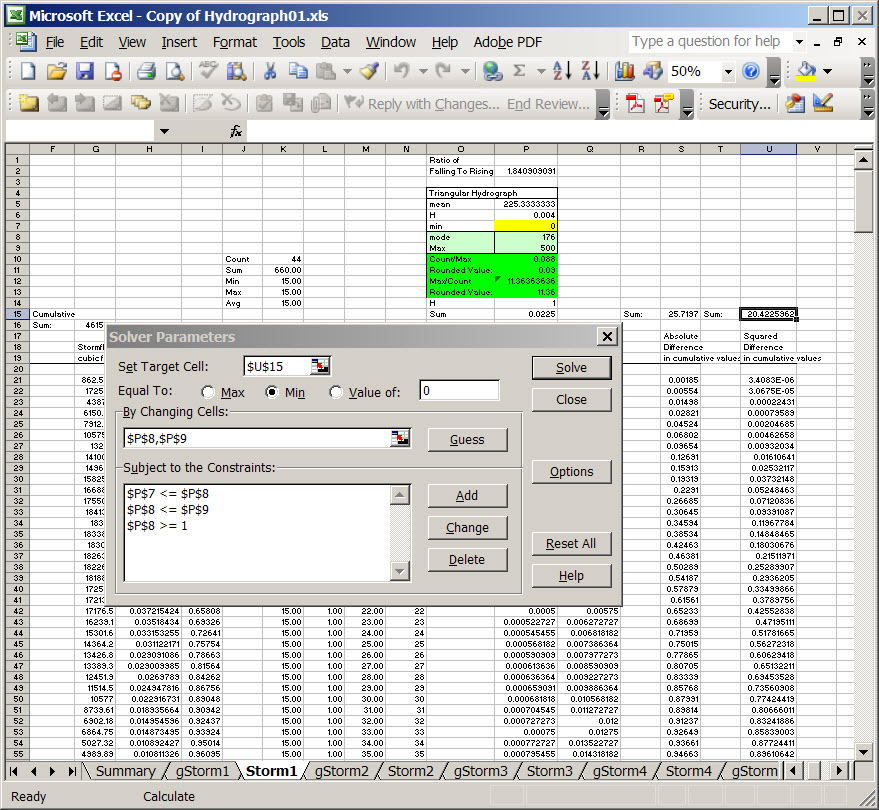
Screen shot showing the Microsoft Excel Solver with parameters for fitting the triangular hydrograph: