


The purpose of these interpretive discussions is to provide a perspective on regional- and national-scale variations in element and mineral distributions in soils and their likely causes. The significant spatial variations shown by most elements and minerals can commonly be attributed to geologic sources in underlying parent materials, but other spatial variations seem clearly related to additional factors such as climate, the age of soils, transported source material, and anthropogenic influences. We attempt to distinguish the influence of these various factors on a regional and national scale. Numerous more local features might similarly be related to these same factors, but these features also have some probability of being an artifact of a random sampling of variable compositions, so that there is some probability of samples with similar compositions occurring in clusters of two or more adjacent sites by chance. Distinguishing such random occurrences from true variability is beyond the scope of the data from which these maps are constructed. Some caution, therefore, is advisable in interpreting the significance of these more local features unless some unique sources or processes can clearly be related to them.
Gallium (Ga) is a common trace metal in rocks and soils. It is used widely in doping semiconductors and producing solid–state devices such as transistors. The average Ga concentration in the Earth's upper continental crust is estimated to be 18.6 milligrams per kilogram (mg/kg) (Hu and Gao, 2008).
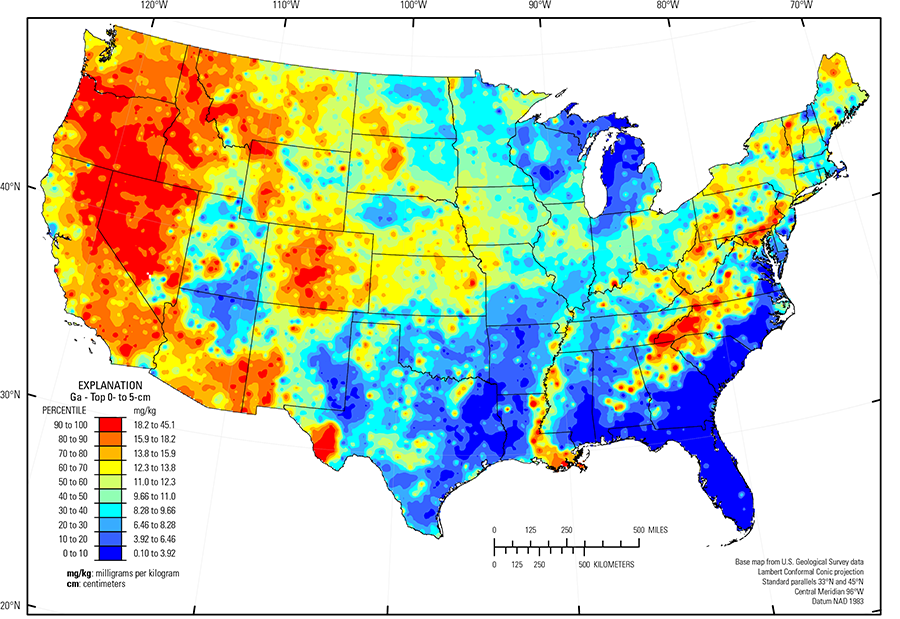
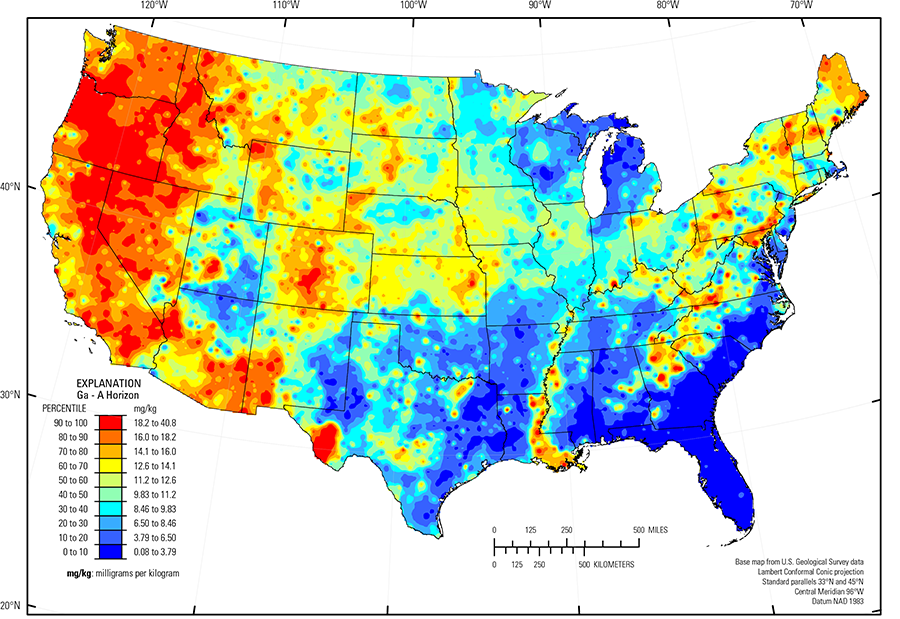
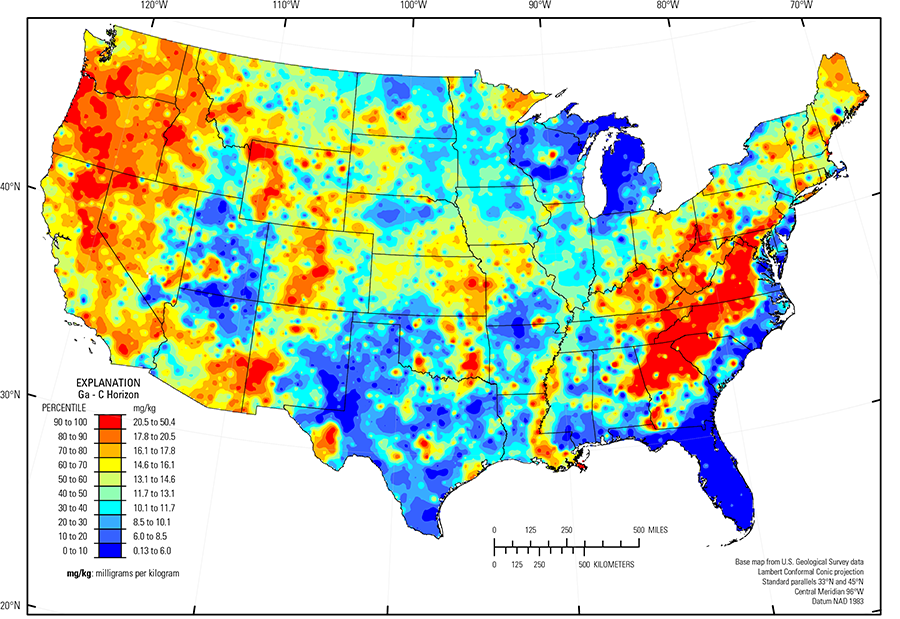
In our data, the median Ga concentration is 11.0 and 11.2 mg/kg for the top 0- to 5-cm layer and the soil A horizon, respectively. The median Ga concentration in the soil C horizon is 13.1 mg/kg (see the summary statistics [open in new window]).
Gallium's chemical properties are similar to those of the major element aluminum (Al) and Ga's concentration in soils of the United States correlates strongly with Al (correlation coefficient 0.926). As expected, the two elements have very similar distribution patterns in soils across the conterminous United States. Refer to the discussion of Al for specifics of the interpretation of those patterns.
The distribution of mineral resource deposits with Ga as a commodity (major and/or minor) in the United States, extracted from the U.S. Geological Survey (USGS) Mineral Resource Data System (MRDS) website, can be seen by hovering the mouse here. Statistics and information on the worldwide supply of, demand for, and flow of Ga are available through the USGS National Minerals Information Center (NMIC) website.
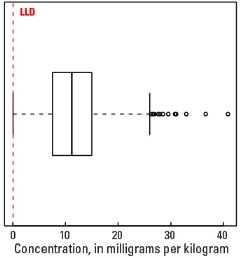
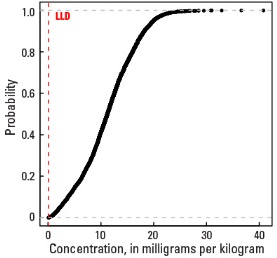
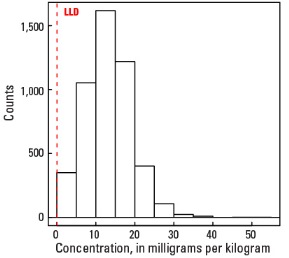
Statistics - 0 TO 5 CM
| Number of samples | 4,841 |
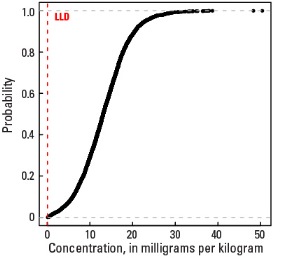
| LLD | 0.05 mg/kg |
| Number below LLD | 0 |
| Minimum | 0.1 mg/kg |
| 5 percentile | 2.4 mg/kg |
| 25 percentile | 7.5 mg/kg |
| 50 percentile | 11.0 mg/kg |
| 75 percentile | 14.7 mg/kg |
| 95 percentile | 20.0 mg/kg |
| Maximum | 45.1 mg/kg |
| MAD | 5.4 mg/kg |
| Robust CV | 49.1% |
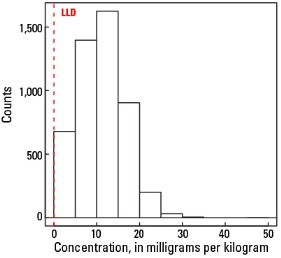
Histogram
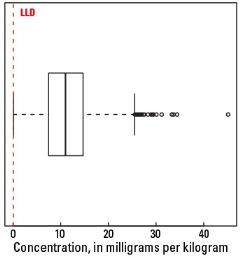
Boxplot
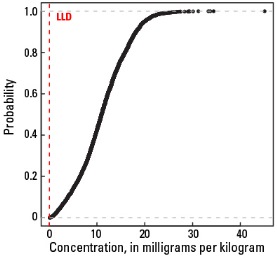
Empirical cumulative distribution function
Statistics - A Horizon
| Number of samples | 4,813 |
| LLD | 0.05 mg/kg |
| Number below LLD | 0 |
| Minimum | 0.08 mg/kg |
| 5 percentile | 2.27 mg/kg |
| 25 percentile | 7.54 mg/kg |
| 50 percentile | 11.2 mg/kg |
| 75 percentile | 15.0 mg/kg |
| 95 percentile | 20.0 mg/kg |
| Maximum | 40.8 mg/kg |
| MAD | 5.5 mg/kg |
| Robust CV | 49.1 % |
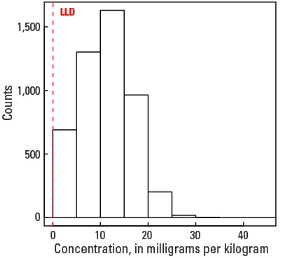
Histogram
Boxplot
Empirical cumulative distribution function
Statistics - C Horizon
| Number of samples | 4,780 |
| LLD | 0.05 mg/kg |
| Number below LLD | 0 |
| Minimum | 0.13 mg/kg |
| 5 percentile | 3.82 mg/kg |
| 25 percentile | 9.29 mg/kg |
| 50 percentile | 13.1 mg/kg |
| 75 percentile | 16.9 mg/kg |
| 95 percentile | 23.0 mg/kg |
| Maximum | 50.4 mg/kg |
| MAD | 5.63 mg/kg |
| Robust CV | 43.0 % |
Histogram
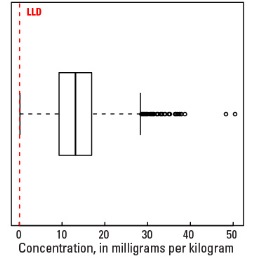
Boxplot