


The purpose of these interpretive discussions is to provide a perspective on regional- and national-scale variations in element and mineral distributions in soils and their likely causes. The significant spatial variations shown by most elements and minerals can commonly be attributed to geologic sources in underlying parent materials, but other spatial variations seem clearly related to additional factors such as climate, the age of soils, transported source material, and anthropogenic influences. We attempt to distinguish the influence of these various factors on a regional and national scale. Numerous more local features might similarly be related to these same factors, but these features also have some probability of being an artifact of a random sampling of variable compositions, so that there is some probability of samples with similar compositions occurring in clusters of two or more adjacent sites by chance. Distinguishing such random occurrences from true variability is beyond the scope of the data from which these maps are constructed. Some caution, therefore, is advisable in interpreting the significance of these more local features unless some unique sources or processes can clearly be related to them.
Aluminum (Al) is the most abundant metal in the Earth's crust and the third most abundant element. It never occurs in pure form in nature, but Al is a major constituent of many common minerals. Aluminum is a widely used metal in modern society. Its relatively light weight and corrosion resistance are beneficial properties for many applications ranging from kitchen utensils to airplane parts. Although Al is an element that organisms, including humans, contact daily in large concentrations it is not known to have either positive or adverse health effects under most conditions. However, under some conditions, especially acidic environments, it can be mobilized and become a concern for a variety of negative health conditions for both humans and wildlife. More information about toxicity and potential negative human health impacts of Al can be found at the Agency for Toxic Substances and Disease Registry (ATSDR) website, or click to download a fact sheet about Al.
The average abundance of Al in the Earth's upper continental crust is about 8.2 weight percent (wt. %) (Rudnick and Gao, 2003). Aluminum's abundance in a variety of igneous rocks and shale is close to its average crustal abundance, but its abundance is about half that value in sandstone, and less than 1 wt. % in carbonate rocks. Aluminum occurs in a wide variety of common aluminosilicate minerals, especially feldspars and clays (it is especially enriched in the clay mineral kaolinite (Al2Si2O5(OH)4), and its distribution in soils across the United States strongly reflects the abundance of these minerals.
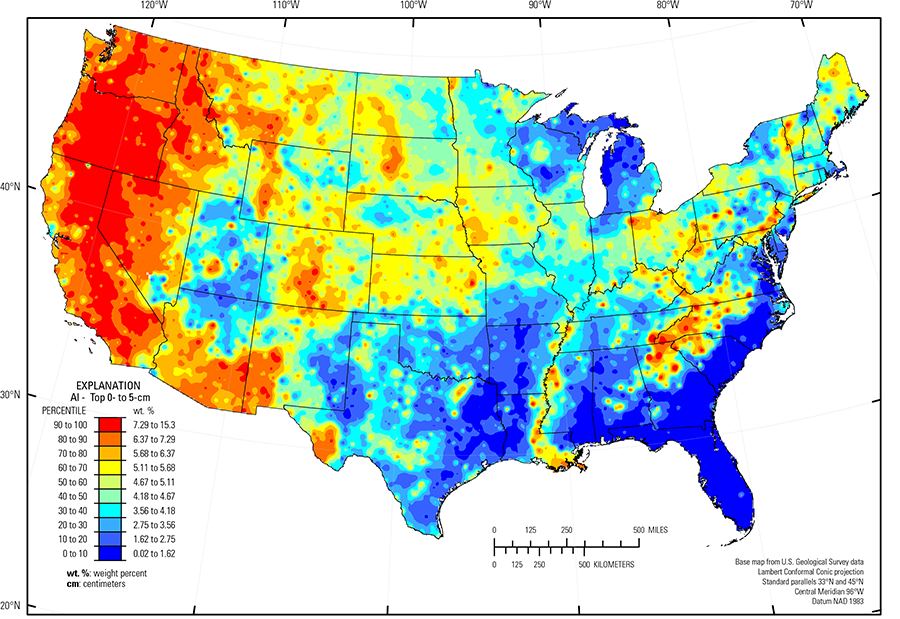
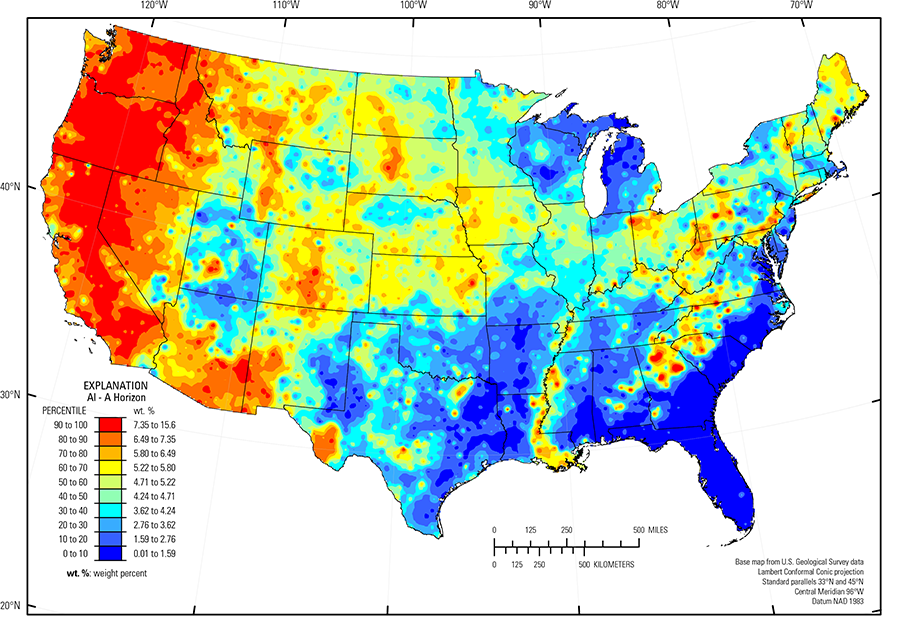
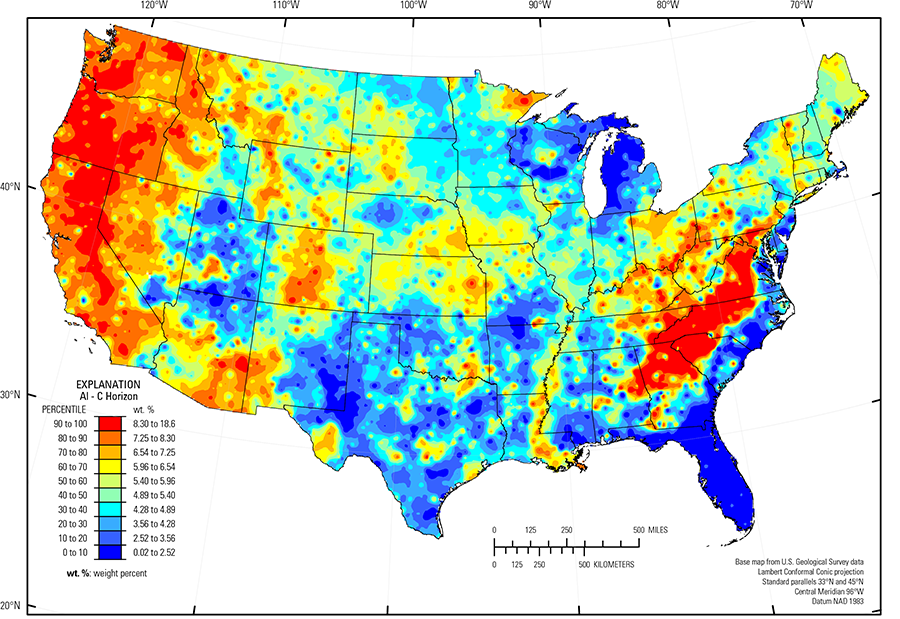
In our data there is a tendency of topsoils (soil A horizon and the top 0- to 5-cm layer) across the United States to have somewhat lower concentrations of Al than the soil C horizon. The median Al concentration is 4.67 wt. % in the top 0- to 5-cm layer, 4.71 wt. % in the soil A horizon, and 5.40 wt. % in the soil C horizon (see the summary statistics [open in new window]). Thus, it appears that soil–forming processes have preferentially removed Al from upper parts of the soil profile. The median concentrations for the country are all well below the average crustal abundance of Al, perhaps because soil parent materials in much of the country are sedimentary rock types that typically contain relatively low Al concentrations. In areas where Al is contained mostly in clay minerals, such as the eastern and south–central part of the United States, the soil A horizon commonly contains substantially less Al than the soil C horizon. This may be a result of physical movement of fine–grained clay particles downward in the soil profile and leaching of Al from the uppermost soil by chemical weathering in these areas of relatively high precipitation (PRISM climate group).
The most aluminous soils in the United States occur in the soil C horizon of the Piedmont physiographic province (Fenneman and Johnson, 1946). Prolonged and intense chemical weathering has leached soil of many of its original chemical components and produced a residual concentration of stable aluminous minerals such as kaolinite and to a lesser extent gibbsite (Al(OH)3). Very aluminous soils also occur within the Western and Central Allegheny Plateau region (USDA, 2006) where similarly long weathering has produced kaolinite in soils formed from sedimentary rocks. In the western part of the United States, aluminous soils correspond to areas of high kaolinite concentration in northern California, but more commonly occur on feldspathic igneous and metamorphic rocks throughout the Rocky Mountains, the Pacific Northwest, and southern Arizona. Smaller areas of aluminous soils include:
- Northeastern Minnesota where feldspar–rich rocks of the Duluth Complex were incorporated into glacial deposits that are the parent material;
- Trans–Pecos volcanics (Schruben and others, 1997) in western Texas, where soils developed on rhyolite, alkalic volcanic rocks, and related alluvium; and
- Mississippi River Alluvium (USDA, 2006) along the lower Mississippi River
Soils with very low Al concentrations occur in the Atlantic and Gulf of Mexico Coastal Plains (Fenneman and Johnson, 1946) where underlying bedrock is rich in quartz and Al–bearing minerals are scarce. Aluminum–poor soils are also characteristic of:
- Colorado Plateau (USDA, 2006), where soil parent materials are mostly quartz–rich sandstone and eolian deposits;
- Southern High Plains (USDA, 2006) of western Texas and New Mexico where soils developed on quartz–rich eolian sand and alluvial sediments;
- Parts of Michigan where soils formed on quartz–rich or carbonate–rich glacial deposits of the Superior, Green Bay, and Saginaw lobes (Grimley, 2000);
- Nebraska Sand Hills (USDA, 2006), where soils developed on quartz– and plagioclase–rich sand dunes and sand sheets.
The distribution of mineral resource deposits with Al as a commodity (major or minor) in the United States, extracted from the U.S. Geological Survey (USGS) Mineral Resource Data System (MRDS) website, can be seen by hovering the mouse here. Statistics and information on the worldwide supply of, demand for, and flow of Al–containing materials are available through the U.S. Geological Survey (USGS) National Minerals Information Center (NMIC) website.
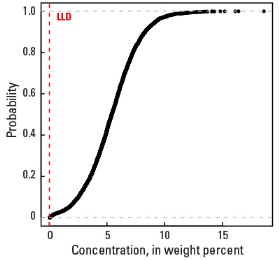
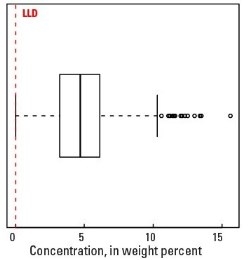
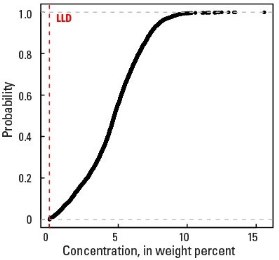
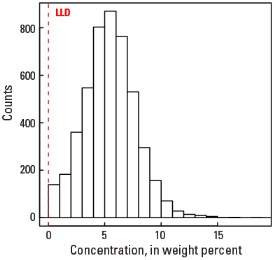
Statistics - 0 TO 5 CM
| Number of samples | 4,841 |
| LLD | 0.01 wt. % |
| Number below LLD | 0 |
| Minimum | 0.02 wt. % |
| 5 percentile | 0.92 wt. % |
| 25 percentile | 3.20 wt. % |
| 50 percentile | 4.67 wt. % |
| 75 percentile | 6.00 wt. % |
| 95 percentile | 7.98 wt. % |
| Maximum | 15.30 wt. % |
| MAD | 2.06 wt. % |
| Robust CV | 44.1% |
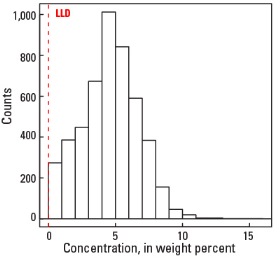
Histogram
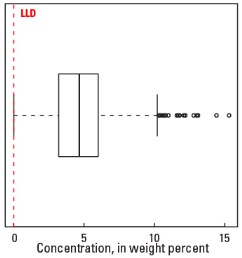
Boxplot
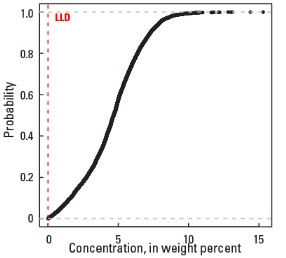
Empirical cumulative distribution function
Statistics - A Horizon
| Number of samples | 4,813 |
| LLD | 0.01 wt. % |
| Number below LLD | 0 |
| Minimum | 0.01 wt. % |
| 5 percentile | 0.90 wt. % |
| 25 percentile | 3.22 wt. % |
| 50 percentile | 4.71 wt. % |
| 75 percentile | 6.12 wt. % |
| 95 percentile | 8.02 wt. % |
| Maximum | 15.6 wt. % |
| MAD | 2.15 wt. % |
| Robust CV | 45.6 % |
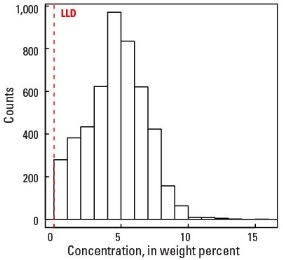
Histogram
Boxplot
Empirical cumulative distribution function
Statistics - C Horizon
| Number of samples | 4,780 |
| LLD | 0.01 wt. % |
| Number below LLD | 0 |
| Minimum | 0.02 wt. % |
| 5 percentile | 1.69 wt. % |
| 25 percentile | 3.93 wt. % |
| 50 percentile | 5.40 wt. % |
| 75 percentile | 6.88 wt. % |
| 95 percentile | 9.24 wt. % |
| Maximum | 18.6 wt. % |
| MAD | 2.18 wt. % |
| Robust CV | 40.4 % |
Histogram
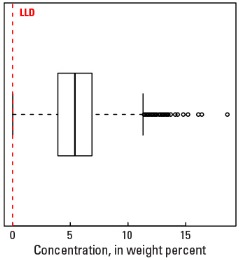
Boxplot