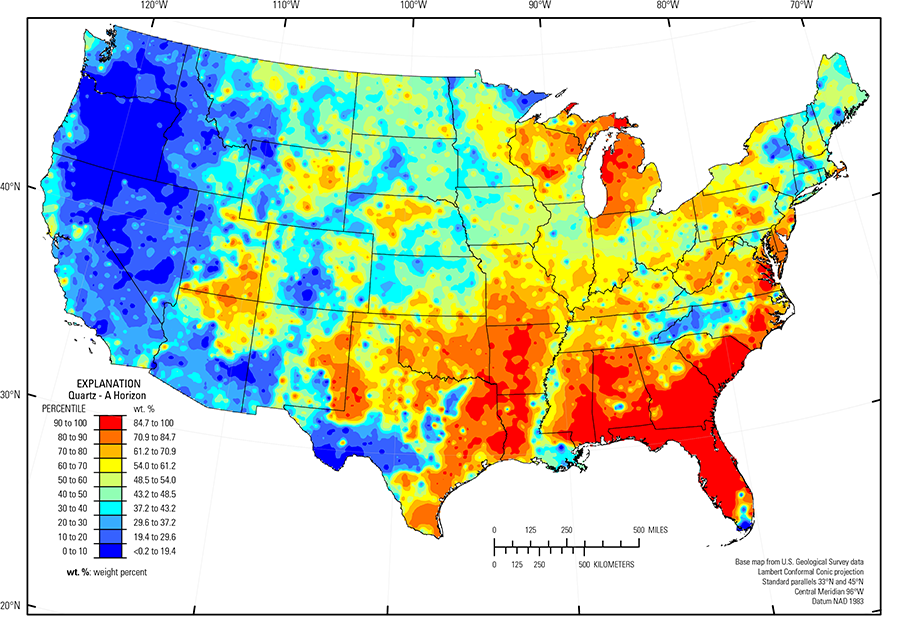
The purpose of these interpretive discussions is to provide a perspective on regional- and national-scale variations in element and mineral distributions in soils and their likely causes. The significant spatial variations shown by most elements and minerals can commonly be attributed to geologic sources in underlying parent materials, but other spatial variations seem clearly related to additional factors such as climate, the age of soils, transported source material, and anthropogenic influences. We attempt to distinguish the influence of these various factors on a regional and national scale. Numerous more local features might similarly be related to these same factors, but these features also have some probability of being an artifact of a random sampling of variable compositions, so that there is some probability of samples with similar compositions occurring in clusters of two or more adjacent sites by chance. Distinguishing such random occurrences from true variability is beyond the scope of the data from which these maps are constructed. Some caution, therefore, is advisable in interpreting the significance of these more local features unless some unique sources or processes can clearly be related to them.
Quartz (SiO2) is an inert mineral in most soil environments and is generally devoid of trace elements. Quartz is stable in most soil–forming environments of the conterminous United States, so it commonly becomes concentrated during geologic and soil–forming processes that may cause other minerals to break down or dissolve. Quartz is nearly ubiquitous, and on the national scale is the most abundant soil mineral. The median quartz concentration is 48.5 weight percent (wt. %) in the soil A horizon, and 44.0 wt. % in the soil C horizon (see the summary statistics [open in new window]). Because of its simple composition, quartz serves as a diluent for many major and trace elements that are carried by other minerals. Thus, many of those elements display an inverse relationship to the prominent concentration patterns shown in the quartz maps.
Quartz is a very useful material. It is used in glassmaking and as an abrasive. Because of its resistance to both chemicals and heat, quartz is used as a foundry sand. In the petroleum industry, it is used in sand slurries that are forced down oil and gas wells under very high pressure in the hydraulic fracturing process. High–quality quartz crystals are used in electronic circuits that are important components of watches, clocks, computers, and cell phones. Quartz, in varieties such as amethyst and rose quartz, is a popular gemstone.
The distribution of quartz resources as a commodity (major or minor) in the United States, extracted from the U.S. Geological Survey (USGS) Mineral Resource Data System (MRDS) website, can be seen by hovering the mouse here. Statistics and information on the worldwide supply of, demand for, and flow of quartz, are available through the USGS National Minerals Information Center (NMIC) website.
Quartz is especially concentrated in soil developed on relatively young sedimentary rocks of the Atlantic and Gulf of Mexico Coastal Plains (Fenneman and Johnson, 1946), where concentrations greater than 80 wt. % are common. The generally quartz–rich soils of the coastal plains are interrupted by the Southern Mississippi River Alluvium (USDA, 2006), where quartz concentrations are significantly lower. This alluvium has been transported for long distances downstream and has a composition more similar to material in the upper part of the Mississippi River drainage system than to the mature quartz–rich soils to the east and west of the alluvium. Other notably high concentrations occur over sandy glacial deposits in Michigan, mostly deposited by the Lake Michigan glacial lobe (Grimley, 2000) of the late Wisconsinan period (16,000 to 12,000 years ago) glaciers, and in areas where bedrock is mostly quartz–rich sandstone, such as the Colorado Plateau (USDA, 2006). Other regional highs correspond to sandy eolian deposits in the Nebraska Sand Hills (USDA, 2006) and in the High Plains (USDA, 2006) of western Texas and adjacent New Mexico.
The western part of the United States is markedly depleted in quartz due principally to a preponderance of parent rock material that contains limited amounts of quartz. This is especially true of the Pacific Northwest where many areas are underlain by basalt and similar mafic rocks that contain only traces of quartz. Quartz–poor soils in Texas overlie limestone bedrock (in the Texas carbonate terrane) and mafic igneous bedrock (Trans–Pecos volcanics (Schruben and others, 1997)).
Statistics - 0 TO 5 CM
Statistics - A Horizon
| Number of samples | 4,802 |
| LLD | 0.2 wt. % |
| Number below LLD | 11 |
| Minimum | 0.6 wt. % |
| 5 percentile | 11.2 wt. % |
| 25 percentile | 33.8 wt. % |
| 50 percentile | 48.5 wt. % |
| 75 percentile | 65.5 wt. % |
| 95 percentile | 93.1 wt. % |
| Maximum | 100 wt. % |
| MAD | |
| Robust CV |
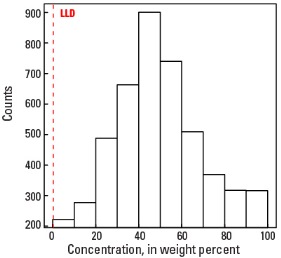
Histogram
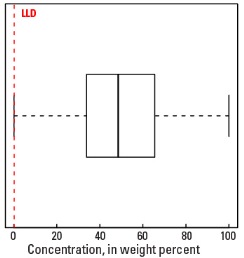
Boxplot
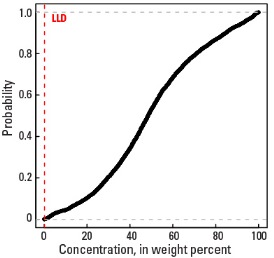
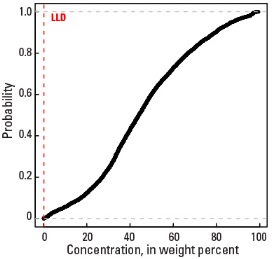
Empirical cumulative distribution function
Statistics - C Horizon
| Number of samples | 4,773 |
| LLD | 0.2 wt. % |
| Number below LLD | 9 |
| Minimum | <0.2 wt. % |
| 5 percentile | 8.8 wt. % |
| 25 percentile | 30.5 wt. % |
| 50 percentile | 44.0 wt. % |
| 75 percentile | 62.0 wt. % |
| 95 percentile | 87.0 wt. % |
| Maximum | 99.4 wt. % |
| MAD | |
| Robust CV |
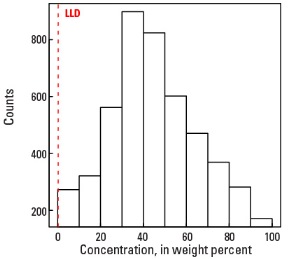
Histogram
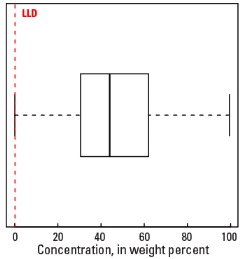
Boxplot
