WRIR
00-4001
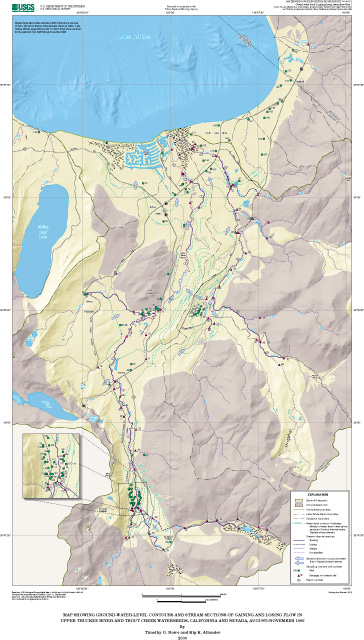
Surface- and Ground Water Characteristics in the Upper Truckee River and Trout
Creek Watersheds
Seepage estimates were determined for selected reaches in the Upper Truckee River and Trout Creek watersheds by measuring streamflow entering and leaving the reach and by measuring all tributary flows entering the reach during base-flow conditions. If streamflow leaving the reach exceeded all streamflow entering the reach by at least 5 percent, the difference was assumed to be ground-water seepage to the stream and the reach is referred to as a gaining reach. If flow leaving the reach was less than all inflow to the reach by at least 5 percent, then the streamflow was assumed lost to ground water and the reach is referred to as a losing reach. If flow leaving the reach was within 5 percent of all the inflow to the reach, then the difference was within standard measurement error and the reach is referred to as a steady reach with no losses or gains. This method for estimating seepage along the stream channels assumes no overland runoff, negligible evaporation directly from the stream, negligible evapotranspiration from riparian vegetation along the stream, and no storage changes along the stream channel.
Unit-runoff values were derived by dividing streamflow values by contributing drainage area. Unit-runoff values are defined as the average number of cubic feet per second flowing from each square mile of area drained by a stream, assuming that the runoff is distributed uniformly in time and space. Delineation of drainage areas used in this study are from Cartier and others (1995).
Seventy streamflow measurement sites were established in the study area--45 in the Upper Truckee River watershed and 25 in the Trout Creek watershed. Streamflow was determined at 63 of the streamflow measurement sites--40 in the Upper Truckee River watershed and 23 in the Trout Creek watershed. These sites were selected to estimate seepage and unit-runoff values along selected reaches in the main stems and tributaries (tables 3 and 4, pl. 1, fig. 3). Of the 40 sites in the Upper Truckee River watershed with streamflow measurements, 13 are main-stem sites and 27 are tributary sites. The main stem of the Upper Truckee River was divided into 10 reach segments. Of the 23 sites in the Trout Creek watershed with streamflow measurements, 9 are main-stem sites and 14 are tributary sites. The main stem of Trout Creek was divided into six reach segments. Existing streamgage locations and water-quality sampling sites were selected along with sites at the confluence of all inflowing tributaries with the main-stem streams. Additional sites along the major tributaries were selected in each watershed. The selection of these sites was made on the basis of accessibility. Measurements of streamflow were made on the same day within each watershed. Streamflow measurements in the Upper Truckee River watershed were made on September 23, 1996, and streamflow measurements in the Trout Creek watershed were made on September 26, 1996.
Streamflows were measured following USGS guidelines (Buchanan and Somers, 1969). Water and air temperatures were measured using calibrated field thermometers.
River miles (distance from mouth of river to seepage measurement sites) along the main stems were calculated from the mouth of each watershed using a geographical information system (table 2, fig. 3). River miles on the tributaries were calculated by taking the river mile of the main channel at the tributary mouth and then adding the distance of the tributary channel going upstream. River miles were used in computing relative ground-water seepage rates along selected reaches of the Upper Truckee River and Trout Creek.
Well drillers' logs in the study area were obtained from the California Department of Water Resources. These logs are used to locate existing domestic and public supply wells and to provide well-construction information such as well depth, screen interval, well diameter, and lithology. A field reconnaissance of existing wells was made from early August 1996 through November 1996. Some wells were found after interviewing local residents in areas of known domestic withdrawals. When a well was found, its location was plotted on a 7.5-minute topographic map and its latitude and longitude coordinates were determined using a Precision Lightweight Global Positioning System Receiver (PLGR). The accuracy of these locations is ±100 ft, or approximately 1 second of latitude or longitude.
Field information collected for each well included casing diameter, well depth, well-owner information, measuring-point height, land-surface altitude, well and water-use status, and water level (table 5). All land-surface altitudes were taken from USGS 7.5-minute topographic quadrangle maps except for those wells that already had land-surface altitudes determined by conventional surveying techniques. The accuracy of land-surface altitudes estimated from the maps is typically within 20 ft and often within 10 ft, depending on the topographic-contour interval (plus or minus one-half of the topographic-contour interval). For land-surface altitudes determined by surveying techniques, accuracies are within 0.1 ft. All water-level measurements were made using either a steel or electric tape. Because water levels were determined by subtracting depth to water from land-surface altitudes, they carry the same uncertainties as the land-surface altitudes. Domestic wells were frequently used for yard irrigation during the late summer and early fall when data were collected. Water levels from these pumping wells are not representative of static conditions (table 5). Data for wells presented in this report are stored in the USGS National Water Information System (NWIS) data base.
Between July 16 and November 8, 1996, USGS staff inventoried 94 wells and 1 spring. Of the 94 wells, 79 are within the study-area boundaries. The other 15 wells and 1 spring are adjacent to the study area. Most of the sites adjacent to the study area were included in this study to help interpret water-level contours and hydraulic gradients at the study area boundaries. The remainder of these sites were included because the information from them is previously unpublished. Of the 79 wells within the study area, water levels were measured at 62 wells. Seventeen wells were not measured because they were either flowing, inaccessible, or pumping almost continuously. Thirteen of the wells measured had been pumped recently (identified with an R on table 5), and may not represent a static water level. Two of the wells measured were pumping; these water levels are not representative of static levels but do give a lower boundary for the water surface (water level in parentheses in table 5). The water-use distribution for the 79 wells within the study area is as follows: 11 wells are used for public supply; 45 wells are used for domestic purposes; and 23 wells are used for monitoring purposes (fig. 4).
Well locations and associated water-level altitudes were used along with seepage estimates to develop a water-level map of the study area (pl. 1). Directions of ground-water flow in the study area were determined from the water levels on plate 1.
Hydraulic gradients in the study area were determined also from water levels shown on plate 1. Because of the uncertainties in water-level altitudes, an inherent uncertainty is associated with the hydraulic gradients. These uncertainties are generally greatest in the middle part of the study area (Tahoe Paradise area) and the least in the steeply sloping area above Christmas Valley along Luther Pass.
The 94 wells inventoried for this study are a sample of the entire population of wells in and adjacent to the study area. How many wells make up the entire well population is unknown due to inconsistent reporting of well drilling in the past as well as undocumented destruction of wells. The sample distribution of wells is assumed to be representative of the total well distribution. This results in clusters of wells in areas of current domestic withdrawals and areas of environmental ground-water monitoring. Three major clusters are apparent on plate 1. The largest cluster is in the south end of Christmas Valley, where the residential population is still on domestic-well systems. Another cluster is on the south side of Twin Peaks, where the residential population still uses wells for domestic supply and where environmental monitoring of ground water is done in a nearby meadow. The third cluster is in the Trout Creek watershed at the old landfill near Meyers, Calif. This cluster of observation wells was established to monitor environmental effects of the landfill on the local ground water.
Samples were collected to determine specific conductance at each streamflow site at the time of measurement (table 3). Specific conductance is the ability of a substance to conduct an electric current at a specific temperature. In water, specific conductance is a good indicator of the concentration of dissolved solids. The greater the specific conductance, the greater the concentration of dissolved solids (Hem, 1985). Samples for specific-conductance measurements were collected by hand dipping a field-rinsed 250-mL polyethylene bottle in the center of flow at each site. Readings were then made within 24 hours of collection for each sample at the USGS Nevada District Laboratory using a calibrated specific conductance field meter adjusted to conductance at 25°C.
Six surface-water-quality sites (fig. 3; three on the Upper Truckee River and three on Trout Creek) were sampled periodically from July through December 1996 (table 6). These sites were sampled for total kjeldahl (ammonia plus organic nitrogen), total phosphorous, dissolved orthophosphorus, dissolved ammonia, dissolved nitrite plus nitrate, and total bioreactive iron. Field measurements of specific conductance, pH, water temperature, and dissolved oxygen were collected also. Historical USGS water-quality data, dating back to 1992, are available for all these sites. Standard USGS methods were used for sample collection. The method used for this study to collect water-quality samples was the equal-width increment (EWI) method, which is a depth- and width-integration method. This method involves collecting depth-integrated samples from equal-width segments of the cross section of a stream. The sample was then composited and mixed in a churn. The samples for measurements of total constituents were collected directly from the churn and the dissolved samples were filtered from the churn. These water-quality samples were then preserved (nutrients were chilled to 4°C and stored in the dark, and iron samples were acidified with concentrated nitric acid to a pH below 2) and shipped overnight to the UC Davis-TRG laboratories in Davis and Tahoe City, Calif. The samples were analyzed for iron and nutrients within 8 days according to procedures described by Hunter and others (1993). Specific-conductance and pH measurements were made from water taken from the churn after thoroughly mixing. The water temperature and dissolved oxygen were measured directly in the stream at the time of sampling. Specific conductance, pH, and dissolved oxygen were measured with field meters that were calibrated before each sample.
Summary statistics were computed for the combined samples of all six surface-water-quality sites on the Upper Truckee River and Trout Creek for July through December 1996 (figs. 5 and 6). For all 6 sites, only samples collected the same day or within 1 day were used in the analysis to compare with the summary statistics for the ground-water-quality sites.
Seven wells in the study area (five in the Upper Truckee River watershed and two in the Trout Creek watershed) and one well adjacent to the study area were sampled in July 1996 (table 7). These wells were sampled for dissolved nitrite plus nitrate, dissolved ammonia, dissolved kjeldahl (ammonia plus organic nitrogen), dissolved phosphorous, dissolved orthophosphorus, and dissolved bioreactive iron. Historical USGS water-quality data dating back to 1990 is available for these wells. These eight wells and well 143 (table 7) were sampled in November and December 1996. Seven of these are public supply wells and two are observation wells. The public-supply wells were sampled from the delivery system using existing pumps. For these wells, water was collected as close to the wellhead as possible to ensure that the sample was not affected by any treatment or storage of the water. Because these samples were collected from public-supply wells that are heavily used, it is assumed that the water is representative of the aquifer water. The two observation wells were sampled using a submersible pump. Because these wells are not pumped regularly, more than three casing volumes of water were pumped prior to sampling and specific conductance and water temperature were checked until stabilized, to assure that the water was representative of the aquifer water. These water-quality samples were filtered (through 0.45-µm filter) in the field and then preserved (nutrients were chilled to 4°C and stored in the dark and iron samples were acidified with concentrated nitric acid to a pH below 2) and shipped to the UC Davis-TRG laboratories in Davis and Tahoe City, Calif. The samples were analyzed for iron and for nutrients within 8 days according to the procedures described by Hunter and others (1993). Specific conductance, water temperature, water level, and pH were measured in the field during sampling. Specific conductance and pH measurements were made from water taken with field meters that were calibrated before each sample.
Ground-water-quality data are presented in table 7. The ground-water data are reported also in the 1996 annual data report for Nevada (Bostic and others, 1997, p. 532-536).
Summary statistics were computed for the combined samples of the seven ground-water-quality sites within the Upper Truckee and Trout Creek watersheds that were sampled in July 1996 and in November-December 1996 (figs. 5 and 6). Well 143 was not used in the analysis because only one sample was collected during the study period. Also, this well is suspected of being affected by the landfill near Meyers, which is directly upgradient, and therefore probably is not a good representation of the overall ground-water quality in that area.
Table
of Contents||Next Section:
Surface- and Ground-Water Conditions
USGS Water home page || USGS
home page
The pathname for this page is <inventory.htm>
These pages are maintained by S.C. DeMeo <email: scdemeo@usgs.gov>
Last modified: Wednesday, April 12, 2000