
The Yellowstone River Basin (YELL) was selected as one of more than 50 study units in the U.S. Geological Survey (USGS) National Water-Quality Assessment (NAWQA) Program. The scope and objectives of the NAWQA program are described briefly in the foreword to this report and in more detail by Hirsch and others (1988) and Gilliom and others (1995). The NAWQA study units were divided across the United States into three groups on a rotational schedule, with one group of studies beginning in 1991, a second group beginning in 1994, and a third group beginning in 1997. The YELL was among the group of study-unit investigations that began in 1997.
The surface-water component of the NAWQA program requires an integrated approach (physical, chemical, and biological) to aid in interpreting and assessing changes in stream quality (Gurtz, 1994). One element of this integrated approach is describing the occurrence and distribution of organic compounds and trace elements in fish tissue and bed sediment.
The purpose of this report is to describe the occurrence and distribution of organic compounds and trace elements in fish tissue and bed sediment from selected streams in the YELL. Development of a biological and sediment database provides a baseline for assessment of long-term trends and is useful for comparing land-use inputs (Crawford and Luoma, 1993, p. 4). The fish-tissue and bed-sediment data are compared to data from other investigations in the United States and Canada, regional, statewide, and site-specific investigations, and results of studies related to potential adverse effects on aquatic biota or human health.
Fish-tissue and bed-sediment analyses and related data from samples collected for the YELL NAWQA during the summer and fall of 1998 are presented in this report. The data also are available from the USGS National Water Information System (NWIS) database, a report by Swanson and others (2000), and the Internet, at http://wy.water.usgs.gov/YELL/html/data.htm.
Bed-sediment samples were collected at 24 sites, and fish-tissue samples were collected at 21 of those sites. Fish-tissue and bed-sediment data are included from 5 sites that were co-sampled as part of a USGS national mercury investigation.
Description of the Study UnitThe Yellowstone River is the largest tributary of the Missouri River and drains an area of approximately 70,000 mi2 (square miles) in Montana, North Dakota, and Wyoming (fig. 1). The annual mean discharge of the Yellowstone River near its mouth is 12,830 cubic feet per second (Shields and others, 1998, p. 302). Major tributaries to the Yellowstone River include the Clarks Fork Yellowstone River, the Wind/Bighorn River, the Tongue River, and the Powder River. Mean annual precipitation in the YELL ranges from about 5.9 inches in the central parts of the Bighorn and Wind River Basins to more than 59 inches at high elevations in the mountains near Yellowstone National Park (Oregon Climate Service, 1995a, 1995b). Snowfall composes a substantial part of annual precipitation in most years, with average annual snowfall ranging from less than 12 inches in parts of the Bighorn Basin to more than 200 inches near Yellowstone National Park (Western Regional Climate Center, 1997). |
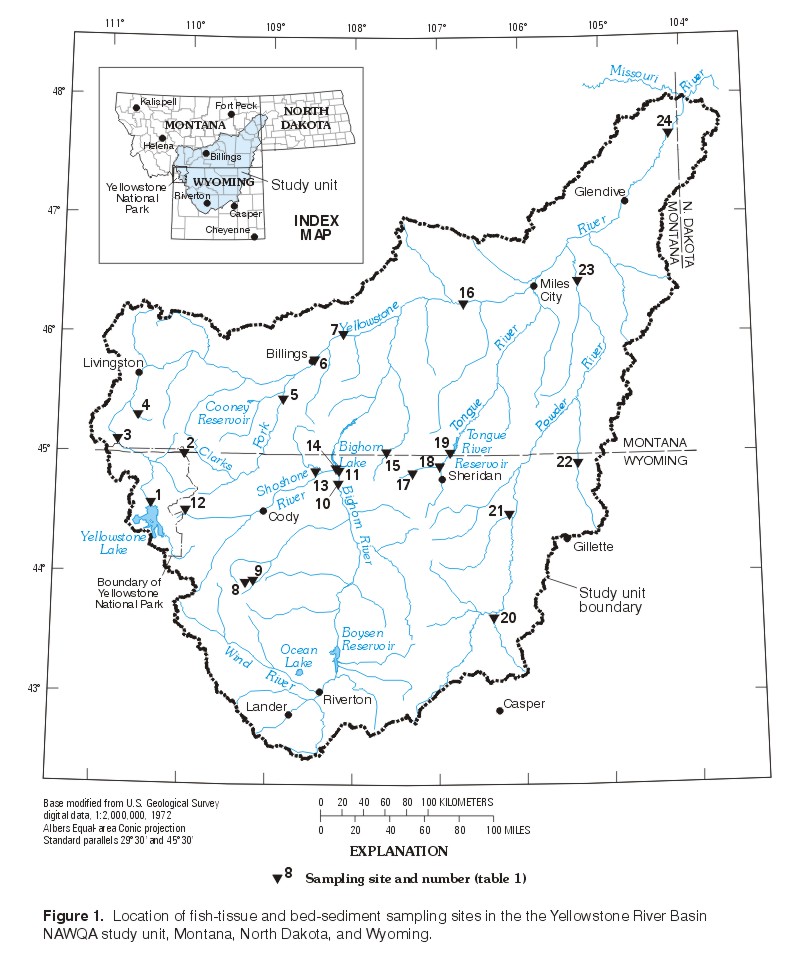
Figure 1. Location of fish-tissue and bed-sediment sampling
sites in the Yellowstone River Basin NAWQA study unit, Montana, North
Dakota, and Wyoming. |
The environmental setting of the Yellowstone River Basin has been described by Zelt and others (1999); the following discussion is condensed from that report. Four ecoregions occur in the YELL (fig. 2). The ecoregions are based on integrated patterns of factors including land use, morphology, potential natural vegetation, and soil (Omernik, 1987). Approximately 55 percent of the study unit lies in the Northwestern Great Plains ecoregion (Zelt and others, 1999). This ecoregion has plains with open hills of varying height and tablelands of moderate relief; predominant land cover is subhumid grass used for grazing (Omernik, 1987). The Middle Rocky Mountains and Wyoming Basin ecoregions each contain about 21 percent of the study unit. The Middle Rocky Mountains ecoregion features high mountains and plateaus covered by Douglas fir, western spruce-fir forests, and alpine meadows; land use includes grazing, recreation, and silviculture. The Wyoming Basin ecoregion has plains with hills or low mountains, some irrigated agriculture, and the potential natural vegetation is shrub steppe, desert shrubland, and juniper-pinyon woodland. The Montana Valley and Foothill Prairies ecoregion contains the remaining 3 percent of the study unit. The Montana Valley and Foothill Prairies ecoregion is characterized as subhumid grassland used for grazing, and some irrigated land. Additional details describing the study unit can be found in Zelt and others (1999) and Peterson and Zelt (1999).
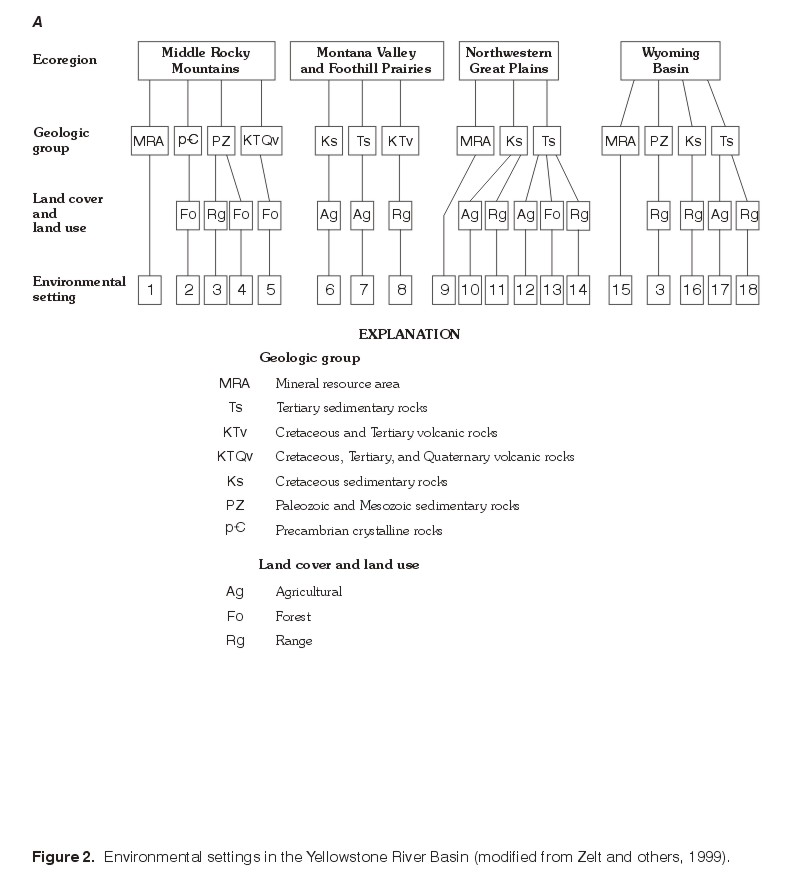
Figure 2. Environmental settings in the Yellowstone River
Basin (modofied from Zelt and others, 1999). |
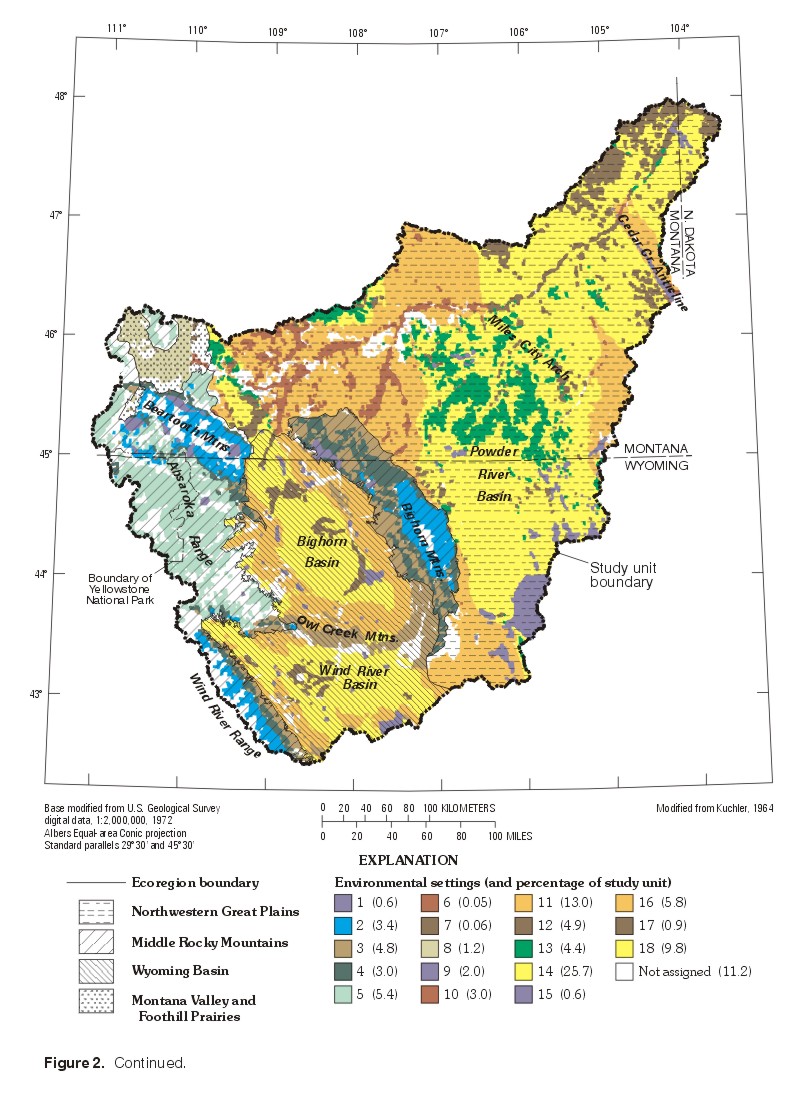
Figure 2. Continued. |
Environmental setting and site type were the primary factors in selection of the sampling sites (table 1). The environmental setting of the study unit can be stratified by identifying sub-areas (not necessarily contiguous) that have relatively homogeneous combinations of those natural and anthropogenic features believed to be relevant to water quality (Gilliom and others, 1995). Eighteen environmental settings in the YELL (fig. 2) were identified on the basis of primary stratification by ecoregion, geology, land use, and landcover, and secondary stratification by coal lease areas, metallic mineral deposits, and oil and gas fields (Zelt and others, 1999, p. 75-80). Sampling sites also can be classified as either indicator or integrator sites. Indicator sites represent relatively small, homogeneous basins associated with environmental settings, such as a specific land use that is considered to be important for understanding water quality in the study unit. Integrator sites are established at downstream points in large drainage basins that are relatively heterogeneous and incorporate complex combinations of environmental settings.
Physical conditions at the sampling sites varied widely. Streams in the Middle Rocky Mountains ecoregion tended to be small, wadeable streams, with specific conductance less than 200 µS/cm (microsiemens per centimeter at 25 degrees Celsius) at the time of sampling (table 2). In contrast, streams in the Northwestern Great Plains ecoregion also were wadeable, but specific conductance was higher, reaching a maximum of 2,010 µS/cm. The sampling sites on the main stem of the Yellowstone River and the Bighorn River were not wadeable. Specific conductance on the main stem of the Yellowstone River was relatively low, ranging from 83 µS/cm at the lake outlet (site 1) to 433 µS/cm near the mouth (site 24). Dissolved oxygen concentrations were near saturation (typically 8-10 mg/L (milligrams per liter)) at all of the sites. The water at the sampling sites tended to be slightly alkaline, as indicated by the pH range of 7.4 to 8.6.
The length of the sampling reach was determined by multiplying the mean wetted channel width by 20, in order to encompass habitat types such as pools, runs, and riffles, with regard to the minimum and maximum reach lengths specified by Fitzpatrick and others (1998). At wadeable sites, the sampling reach ranged from 150 to 300 meters long. At non-wadeable sites, the sample reach generally was about 1,000 meters long. Samples were collected during late July to October 1998.
| Fish were collected by electrofishing (fig. 3), netting, and seining following procedures outlined by Meador and others (1993) and Crawford and Luoma (1993). The nationally consistent target taxa were common carp (Cyprinus carpio) and brown trout (Salmo trutta); white sucker (Catostomus commersoni) was the designated alternate species. Yellowstone cutthroat trout (Oncorhynchus clarki bouvieri) and brook trout (Salvelinus fontinalis) were collected at a few sites where target taxa were not available. No fish-tissue samples were collected from sampling sites 8, 20, and 23 because no target taxa or suitable alternate species were found. | 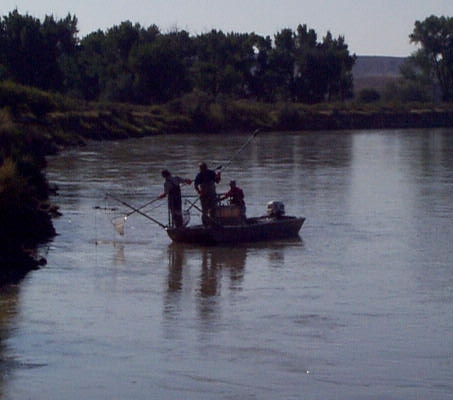
Figure 3. Electrofishing on the Bighorn River at Kane, Wyoming, September 1998. |
At each site, tissue from 5 to 9 adult fish of the same species and similar size were composited to form a sample. External anomalies including deformities, eroded fins, lesions, tumors, and parasites were recorded. Whole-body fish were analyzed for organic compounds, and fish livers were analyzed for trace elements (Crawford and Luoma, 1993), with two exceptions. At site 9, whole body brook trout were collected for analysis of trace elements because the fish were too small to yield adequate mass of liver tissue. Both whole-body and liver samples of brook trout were collected at site 12 for analysis of trace elements. At seven of the sites, liver tissue was removed for trace element analysis and the remainder of the whole-body tissue was sent for analysis of organic compounds because of inadequate numbers of fish to do separate analyses. Fish-tissue samples were kept frozen prior to analysis at the USGS National Water Quality Laboratory (NWQL) in Denver, Colorado.
Bed-sediment samples were collected from multiple depositional areas at each sampling reach and composited for analysis according to guidelines established by Shelton and Capel (1994). A Teflon coring device was used to collect sediment from the upper 2.5 cm (centimeters) of the streambed from 20 to 25 places in undisturbed depositional areas along the reach. Sediments were homogenized, and a subsample of about 500 mL (milliliters) was wet sieved through a 2-mm (millimeter) stainless-steel sieve into a precleaned 500 mL glass jar for analysis of organic compounds. Each sediment sample for analysis of trace elements was sieved through a cleaned 0.062-mm nylon sieve cloth stretched over a frame and funnel into a clean, acid-rinsed plastic jar.
Twenty-eight organic compounds and lipid content in fish-tissue samples and 114 organic compounds in bed-sediment samples were analyzed (table 3). Both fish-tissue and bed-sediment samples were analyzed for organochlorine insecticides and their metabolites, and total polychlorinated biphenyls (PCBs). Bed-sediment samples also were analyzed for a variety of semivolatile organic compounds (SVOCs). Methods used to analyze organic compounds in fish-tissue and sediment are described by Leiker and others (1995) and Foreman and others (1995). Fish-tissue samples were analyzed for trace elements using inductively coupled plasma atomic emission spectrophotometry, inductively coupled plasma mass spectrometry, and cold vapor atomic absorption (Hoffman, 1996) at the USGS NWQL in Denver, Colorado. Bed-sediment samples were analyzed for trace elements using a strong acid digestion followed by inductively coupled plasma atomic emission spectroscopy and various forms of atomic absorption spectrophotometry, including cold vapor, graphite furnace, and hydride generation at the USGS Branch of Geochemistry, Analytical Services Group Laboratory in Denver, Colorado (Arbogast, 1990). Percent organic carbon was determined by heating a sample in an inductive furnace and measuring the amount of carbon dioxide by thermal conductivity (Wershaw and others, 1987). Method reporting limits are listed in table 3, but actual reporting limits for some samples are higher because of matrix effects. In other cases, as indicated by an "E" prefix in tables 4 and 5, concentrations below the method reporting limit are estimated.
Additional fish and sediment samples were collected at five sites for the USGS National Mercury Project. Olson and DeWild (1999) describe the analytical techniques used for low levels of mercury and speciation in water, sediment, and biota. The water and bed-sediment samples were analyzed at the USGS laboratory in Madison, Wisconsin. The fish-tissue fillet samples were analyzed at the USGS laboratory in Columbia, Missouri.
Paired primary and replicate composite whole-body fish samples for analysis of organic compounds were collected at site 6 (white sucker) and at site 10 (common carp). The organic compound p,p´-DDE was the only one detected in both the primary and replicate samples. The primary sample of white sucker had a concentration of 6.7 µg/kg (micrograms per kilogram) p,p´-DDE, and 4.9 percent lipids, and the replicate sample had 13 µg/kg p,p´-DDE and 2.7 percent lipid. Concentrations of p,p´-DDE in whole-body carp from site 10 were 38.8 µg/kg in the primary sample and 25.4 µg/kg in the replicate sample; lipid contents were 4.05 percent and 2.75 percent, respectively. Triplicate samples of composite white sucker liver (primary and two replicates) were collected from site 6 for analysis of trace elements. The relative percent difference in element concentrations among the three samples ranged from 0 to 84 percent and averaged 26 percent. The element concentrations were not consistently higher or lower from one sample to another.
Laboratory quality control consisted of laboratory blanks and surrogate and reagent spike recoveries. Laboratory blanks indicated that samples were not contaminated during laboratory processing. Surrogate and reagent spike recoveries were within acceptable levels according to method performance standards outlined in reports by Leiker and others (1995) and Foreman and others (1995). Results were not adjusted to account for percent recovery.
The NWQL participated in several fish-tissue interlaboratory studies sponsored by the U.S. Fish and Wildlife Service and the U.S. Environmental Protection Agency (Leiker and others, 1995). Results of these studies validated the fish-tissue methodology used by the NWQL. About 80 percent of all data were within 1 standard deviation and 100 percent were within 2 standard deviations for all compounds analyzed.
Bob McDowell, Bill Bradshaw, Bud Stewart, and Mike Welker (Wyoming Game and Fish Department) and Mike Vaughn, Dave Hergenrider, Vic Riggs, and Joel Tohtz (Montana Fish, Wildlife, and Parks) provided valuable field assistance and equipment, as did other personnel from these offices. Pete Ramirez, Kim Dickerson, and Bill Olsen (U.S. Fish and Wildlife Service) also provided field assistance. Colleague reviews by Rod DeWeese (USGS), Don Skaar (Montana Fish, Wildlife, and Parks), and Steve Wolff (Wyoming Game and Fish Department), resulted in considerable improvements to the report. Publications support included assistance from Sue Roberts on the illustrations and from Emily Sabado and Laura Gianakos in preparation of the manuscript.
| AccessibilityFOIAPrivacyPolicies and Notices | |
 |
|