|
|
Determination of StreamflowStreamflow can be calculated at any mainstem site in the study reach using the instream tracer (chloride) concentration and the concentration and injection rate of the tracer solution. The instream tracer concentration used in these calculations was the chloride concentration in the synoptic samples collected during the plateau phase. Using the assumption that chloride is chemically conservative, the mass of the injected tracer was presumed to remain in solution as it traveled downstream. Any decrease in chloride concentration in the mainstem was assumed to be the result of dilution from inflows. For this study, the tracer solution was injected at a rate of 2.67 mL/s, and the average concentration of the tracer solution was 129.2 g/L Cl. Thus, the chloride injection rate was 345 mg/s. Streamflow at the first site downstream from the tracer-injection site was calculated using equation 1:
w
Qa
is the streamflow at the first site downstream from the
injection, in L/s;
Qinj
is the injection rate of the tracer solution, in L/s;
Cinj
is the concentration of the tracer solution, in mg/L;
Co
is the background concentration of the tracer upstream from the
injection site, in mg/L; and Ca is the tracer concentration, in mg/L, at the first downstream site. The calculated streamflow (Qa) and ambient instream concentration (Ca) for the first site downstream from the tracer-injection site then were used to calculate streamflow at the next downstream mainstem sampling site and each subsequent sampling site by using equation 2:
w
Qb
is the streamflow at the downstream site (site b), in L/s;
Qa
is the streamflow at the upstream site (site a), in L/s;
Ca
is the chloride concentration at the upstream site, in mg/L; Ci is the chloride concentration in the inflow water entering the stream between the two sites, in mg/L; and
Cb
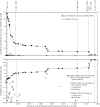
is the chloride concentration, in mg/L, at the downstream site. The chloride concentration (Ci) in water entering the stream was determined in one of several ways. If the mainstem sites were closely spaced to bracket a single surface inflow, then Ci was assumed equal to the chloride concentration in that surface inflow. If no surface-inflow sites were between the mainstem sites, Ci was assumed equal to the median chloride concentration (0.18 mg/L) for all inflows sampled in the entire study reach. If multiple surface inflows were sampled between mainstem sites, Ci was assumed equal to the average chloride concentration in these surface inflows. The magnitude of each surface inflow was determined in one of several ways. If the mainstem sites were closely spaced to bracket a single surface inflow, then the streamflow in the surface inflow was assumed equal to the difference in streamflow between the mainstem sites immediately downstream and upstream from the inflow. Streamflow in surface inflows at sites 5,519, 5,671, and 7,529 were determined by this method. Streamflow in surface inflows at sites 11,560 and 11,644, which were bracketed by the same upstream and downstream sites, was estimated by assuming 60 percent of the increase in mainstem streamflow was from inflow site 11,560 and the remainder from inflow site 11,644. This apportionment was based on visual estimates made in the field on August 20, 1999. Subsurface inflow was assumed to be zero in the mainstem reaches bracketing these five surface inflows because the distances between the upstream and downstream synoptic sites were small (178-505 ft). In parts of the study reach (particularly the low-gradient reach upstream from mainstem site 1,340), closely spaced surface inflows and subsurface inflows contributed streamflow to Daisy Creek. Subsurface inflow occurred almost continuously along the channel. Mainstem sampling sites were not located directly upstream and downstream from each surface inflow, which would have been necessary to apportion Daisy Creek streamflow gains between surface and subsurface inflows using just the tracer-calculated streamflow values. Therefore, all surface inflows in the middle and upper reaches of Daisy Creek were measured independently using standard volumetric or current-meter methods. The magnitude of subsurface inflow then was calculated by subtracting the sum of the measured surface inflows between mainstem sites from the gain in flow between the mainstem sites. These calculated subsurface inflows are presented in table 5. Table 5. Streamflow data for the Daisy Creek and Stillwater River drainage, Montana, August 26, 1999. (click here for pdf file) (click here for xls file) Using the instream chloride concentration from synoptic samples collected on August 26 and the equations listed above, instantaneous streamflow was determined at the 25 mainstem sites (table 5). Streamflow increased in Daisy Creek from 1.49 L/s at the tracer-injection site (site 0) to 32.65 L/s at the mouth (site 11,549), representing an increase of 31.16 L/s (fig. 6). Surface inflows accounted for 20.6 L/s (66 percent) of this increase, leaving 10.5 L/s (34 percent) of the increase attributable to subsurface inflow.
Streamflow was measured in the Stillwater River (site 12,410) on August 20, six days before the synoptic samples were collected. This measurement was 131 L/s, whereas the tracer-calculated streamflow measurement was 178 L/s. Comparing the two values is assumed to be a reasonable basis for assessing differences in the two methods for determining streamflow because this study was done during near base-flow conditions, and the discharge in the study reach appeared to be relatively stable or possibly slowly decreasing. Because hyporheic flow is included in the streamflow value obtained when using the tracer-injection method, the tracer-calculated streamflow was expected to be greater than the streamflow measured with the current-meter method, which does not measure flow through the streambed. Comparing the two streamflow values indicates that about 26 percent (or possibly less if streamflow decreased between August 20 and 26) of the total streamflow was hyporheic flow. This difference is similar to values reported by other similar studies (Kimball, 1997; Kimball and others, 1998, Kimball, Nimick, and others, 1999). |
Home page for USGS Water Resources Investigations Report 00-4261
| AccessibilityFOIAPrivacyPolicies and Notices | |
 |
|
 (1)
(1)