|
|
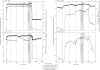
Downstream Travel and DilutionDuring continuous tracer injection, the downstream movement of the tracer solution is documented by sampling at a few key sites called tracer-monitoring sites. Four tracer-monitoring sites located along the study reach (fig. 2, table 4) were sampled during this study. The first tracer-monitoring site (T-1) was at mainstem site 104 and was located as close to the tracer-injection site as possible to minimize the potential for subsurface inflow to increase streamflow between the sites, but far enough downstream to ensure complete mixing of the tracer solution. Additional tracer-monitoring sites were located at mainstem sites 1,340 (T-2) and 9,925 (T-3) on Daisy Creek. The fourth site (T-4) was on the Stillwater River at the end of the study reach (site 12,410). Information on the movement of the chloride tracer was gained by constructing temporal concentration profiles that show the change in chloride concentration with time for each tracer-monitoring site (fig. 5). Ideal temporal concentration profiles of an injected tracer have three distinct regions that show the arrival, plateau (or equilibrium) conditions, and departure of the tracer.
Once the tracer has reached equilibrium at a site, a generally stable plateau concentration ideally will exist until the tracer injection is terminated. As the tracer moves downstream during the plateau period, it becomes diluted by inflows. Therefore, in a gaining stream system, the magnitude of the plateau concentration decreases downstream as the instream flow increases. Data from the tracer-monitoring sites are used to determine whether a relatively stable plateau concentration was reached at each site prior to collection of the synoptic samples. Changes in chloride concentrations during the plateau period can be caused by natural streamflow variations or changes in the tracer-injection rate. Plateau concentrations were determined for each tracer-monitoring site and used to calculate arrival times and travel times through the subreaches between tracer-monitoring sites (table 1). Arrival time is defined as the time it takes for the injected tracer to achieve half of the plateau concentration (Zellweger and others, 1988). At the upstream site (site T-1), a relatively stable plateau in tracer concentration was reached quickly (fig. 5). The calculated travel time from the tracer-injection site was 7 minutes. Click here for Table 1. Travel time of tracer between tracer-monitoring sites in Daisy Creek and the Stillwater River, Montana, August 24-25, 1999 At each of the three downstream sites (T-2, T-3, and T-4), a relatively stable plateau concentration was reached and maintained for 12 to 18 hours after the tracer arrival. Subsequently, natural changes in streamflow caused the tracer concentration to increase (see discussion below). For determination of arrival time at these three sites, the plateau concentrations were defined as the average concentration of all samples collected at each site within the time period from initial onset of the plateau concentration to the time when tracer concentrations increased. The calculated arrival times for tracer-monitoring sites T-3 and T-4 are not well defined because the sampling interval (every 2-4 hours) was too infrequent to adequately document the changes in concentration during the arrival periods. As a result, one-half the plateau concentration was achieved at site T-4 before site T-3. The arrival time for site T-4 thus was re-calculated using data for the departure of the tracer at sites T-3 and T-4 after termination of injection. These data indicated that the tracer departed site T-4 about 143 minutes after the departure at site T-3. Accordingly, the arrival time for site T-4 was assumed to occur 143 minutes after the arrival time for site T-3. Chloride concentration remained fairly uniform during the injection period at the upstream tracer-monitoring site (T-1), particularly during the period when the tracer was injected into Daisy Creek with a pump (fig. 5). After the pump failed at 1205 hours on August 25, the tracer-injection rate was more variable because the constant-head metering system could not be controlled as precisely as the pump system. This variability is reflected in the temporal profiles of chloride concentration and specific conductance. Chloride concentrations were more variable at the three downstream tracer-injection sites (fig. 5). The variation in concentration at each site exhibited an apparent 24-hour (diel) cycle. This diel variation is assumed to be caused by changes in the amount of ground water discharging to the stream system in response to diel cycles of evapotranspiration. At tracer-monitoring site T-2 (mainstem site 1,340), chloride concentrations increased both days beginning at about noon, indicating a decrease in streamflow. Evapotranspiration, particularly from the surrounding valley floor in the relatively low-gradient reach upstream of site T-2, likely reduced the amount of ground water that discharged to the stream system. At tracer-monitoring site T-3 (mainstem site 9,925), the sharp daily increase in chloride concentration occurred approximately 9 hours after the similar increase at site T-2. This time interval is close to the calculated travel time, and therefore, the change in streamflow at site T-3 is attributed to the diel variations in ground-water discharge carried down from the upper low-gradient reach. At tracer-monitoring site T-4, the daily increase in chloride concentration occurred a few hours after the increase at site T-3, which corresponds fairly well with the approximate 2.5-hr travel time through the subreach. However, whether this increase at site T-4 reflects the downstream movement of the concentration pattern from site T-3 or is related to hydrologic phenomena in the Stillwater River upstream from Daisy Creek is not clear. Similarly, the sporadic spikes in chloride concentration at site T-4 may either be actual concentration fluctuations or represent sampling or analytical imprecision. Collection of synoptic samples began about 40 hours after the start of the tracer injection to allow the tracer to travel to the most downstream site and have adequate time to mix and achieve equilibrium. The synoptic-sampling period (shown as the shaded area on fig. 5) at tracer-monitoring sites T-1, T-3, and T-4 coincided with periods of relatively constant chloride concentration, indicating that synoptic samples were collected during a period of generally stable streamflow. However, the synoptic-sampling period at site T-2 coincided with the daily period of decreasing streamflow (increasing chloride concentration). This pattern of decreasing streamflow probably affected synoptic-sampling sites for a few thousand feet downstream from site T-2 and a few hundred feet upstream. For these sampling sites, streamflow was decreasing as the sampling team moved upstream. The effect of decreased ground water, or subsurface, inflow to the stream is difficult to assess. The subsurface inflow derived from the left-bank side of the stream presumably is relatively metal-free, whereas the subsurface inflow from the right-bank side is metal rich. In terms of metal loading, the amount of subsurface inflow from the left bank is unimportant because this subsurface inflow presumably contributes almost no metal load. Hence, the instream flow and metal concentrations might change, but the metal load will not. On the right bank, decreased subsurface inflow could result in decreased metal loading to Daisy Creek. Therefore, the metal loads attributed to subsurface inflow in this reach are less well defined compared to subsurface loads in other reaches. |
Home page for USGS Water Resources Investigations Report 00-4261
| AccessibilityFOIAPrivacyPolicies and Notices | |
 |
|