![]()
Nutrients are elements that are necessary for the growth and nutrition of plants and animals. Nitrogen and phosphorus typically are the principal elements that limit the growth of algae. Algal cells have a nitrogen-to-phosphorus ratio of about 7 to 1; therefore, when the ratio of nitrogen to phosphorus in water is 7 to 1 or greater, growth can increase significantly. When a limiting nutrient becomes abundant, algal populations are stimulated to grow rapidly to extreme numbers until they die off. The organic load then causes fishkills, human health problems, and esthetic deterioration of the water body. The Albemarle-Pamlico estuaries are seasonally nitrogen limited. Unlike most freshwater riverine systems, the lower portions of the Tar-Pamlico and the Neuse Rivers were also nitrogen limited (Harned and Davenport, 1990), implying an unusually high source of phosphorus in these basins.
In the Neuse River, excess nitrogen is considered to be such a problem that the State of North Carolina has considered a 30-percent reduction in nitrogen loads to the river over the next 5 years, beginning in 1997 (North Carolina Division of Water Quality, written commun., 1996).
Nitrate and ammonia are the forms of nitrogen that are most important in controlling algal growth because they are available for uptake by plants. Nitrogen in either of these forms is a potential problem in regard to water quality in the estuaries because excess amounts are associated with algal blooms, fishkills, and toxicity to rooted aquatic plants.
 (516,475 bytes)
Wetlands in the Neuse River Basin, North Carolina
Streams draining a basin can become contaminated from nonpoint (dispersed, both human and natural sources) and point (concentrated, such as discharge from a pipe into a river or stream) sources of nutrients. Nonpoint sources of nutrients derived from fertilizers, animal wastes, or septic fields are probably the main sources of ground-water contamination. Geologic deposits can be important nonpoint nutrient sources in some areas. Precipitation also can be a major nonpoint source of nitrogen (fig. 5). Point sources compose 6 percent or less of all nitrogen inputs and 16 percent of all phosphorus inputs.
 (17,468 bytes)
Figure 5. The major sources of nitrogen inputs to the Albemarle-Pamlico Drainage Basin, in order of importance, are fertilizer, precipitation, livestock, and point-source discharges to streams; and major sources of phosphorus inputs are livestock, fertilizer, and point sources (McMahon and Lloyd, 1995).
The nutrient inputs into each of the major basins can be an indication of potential stresses on water quality. The Chowan Basin received the largest inputs of nitrogen in 1990 (McMahon and Lloyd, 1995). The Roanoke Basin received the smallest inputs of nitrogen.
Fertilizers provided more than 60 percent of the nitrogen inputs in the Chowan, Tar-Pamlico, and Neuse Basins. The main sources of nitrogen in the Roanoke Basin were precipitation and fertilizer. Precipitation provided about 20 to 30 percent of the total nitrogen inputs in all four basins. Permitted point-source inputs of nitrogen, however, were less than 6 percent in all four basins.
Phosphorus input was highest in the Neuse Basin and lowest in the Chowan Basin. Livestock contributed the greatest input of phosphorus in the Roanoke and Neuse Basins. Fertilizer was the major source of phosphorus in the Chowan and Tar-Pamlico Basins and the second highest source of phosphorus in the Roanoke and Neuse Basins. Permitted point sources were significant contributors in the Roanoke, Tar-Pamlico, and Neuse Basins, but were less than 0.5 percent of the contributors in the Chowan. Other potential nonpoint sources, such as natural geologic deposits (discussed in this report for phosphorus, p. 12), can be significant, although estimates have not been included here.
Not all of the nutrients that enter a basin actually enter the streams draining the watershed. The mass of nutrients that leave a watershed in streamflow over a period of time is termed "load." The load per square mile (usually tons per square mile) is termed "yield." In the Albemarle-Pamlico Drainage Basin, McMahon and Woodside (1997) reported that as much as 50 percent of nutrients are retained in the watershed. This is because nutrients may be tied up in nonmobile forms in soils or undergo chemical transformation. However, in general, urban and agricultural land uses would be expected to yield more nutrients and other chemicals to streams compared to other, less chemical-intensive, land uses. In the Albemarle-Pamlico Drainage area, forested basins in the Chowan Basin had the lowest nutrient yields, whereas the more urban and agricultural basins--Contentnea Creek, the Neuse River, and the Tar River in the Coastal Plain and the Dan River in the Piedmont--all had the highest yields (fig. 6).
 (19,696 bytes)
Figure 6. Highest yields of nutrients occurred in Contentnea Creek and in the Neuse, Tar, and Dan Rivers. These basins have less than 50 percent forested land and more than 35 percent agricultural land. Lowest yields were in forested areas (greater than 55 percent forest land) of the Roanoke and Chowan Basins (Blackwater, Nottoway, and Meherrin Rivers). (Data from Harned and others, 1995.)
The median concentration of nitrate as nitrogen was about 0.5 mg/L for 76 surface-water sites and 0.05 mg/L for 49 ground-water sites sampled in the Albemarle-Pamlico Drainage Basin. These median nitrate concentrations in ground and surface water are well under the U.S Environmental Protection Agency (USEPA) drinking-water standard of 10 mg/L as nitrogen. Throughout the entire Coastal Plain, only about 4 percent of wells sampled had nitrate-nitrogen concentrations greater than the 10-mg/L drinking-water standard. Median ammonia concentrations in surface water were 0.06 mg/L, also less than USEPA aquatic-life standards; median ammonia concentrations in ground water were 0.13 mg/L. The median dissolved phosphorus concentration in surface water was about 0.07 mg/L and less than 0.04 mg/L in shallow ground water. Based on pre-1980 data, deep ground water in the Coastal Plain had a median dissolved phosphorus concentration of about 0.2 mg/L (Harned and others, 1995). No phosphorus standards exist for human health; however, concentrations of dissolved phosphorus above 0.05 mg/L in lakes or in streams flowing into lakes and 0.1 mg/L in streams can cause nuisance algal growths (National Technical Advisory Committee, 1968; Mackenthum, 1969).
Compared with results from 19 other NAWQA Study Units, streams in the southern portion of the Albemarle-Pamlico Drainage Basin have nutrient concentrations ranked among the highest 25 percent of nutrient concentrations measured (p. 22). Nutrient concentrations in shallow ground water were among the lowest nationally (p. 24).
In a review of 1980-90 data, Harned and others (1995) examined total nitrogen, total ammonia plus organic nitrogen, total nitrite plus nitrate, and total ammonia basinwide. Total nitrogen concentrations at most of the larger stream sites generally are greater than 0.3 mg/L--the level cited by Vollenweider (1971) for potential nuisance algal growth. Contentnea Creek has the highest total nitrogen concentrations, followed by the Neuse, Tar, Dan, and Blackwater Rivers, the other Chowan tributaries, and the Roanoke River. This ranking reflects the relative intensity of both urban and agricultural development in these basins. In general, the most urban basins and those with the most intensive agriculture have the highest nitrogen values. However, the Roanoke River has low total nitrogen concentrations because of upstream sedimentation and assimilation of nitrogen in algal biomass in Kerr and Gaston Lakes (fig. 1).
Total phosphorus concentrations are relatively uniform in the Dan River, increase downstream in the Tar River, and peak in the Neuse River near Smithfield in a manner similar to the pattern observed for nitrogen. A ranking of phosphorus concentrations in surface water (Harned and others, 1995) showed that basins with the most urban development and intensive agriculture had the highest phosphorus concentrations. Phosphorus concentrations were frequently above 0.1 mg/L in most streams, providing an ample supply of the nutrient for algal growth. Concentrations of phosphorus less than 0.1 mg/L at Roanoke Rapids are probably a result of settling of phosphorus in the sediments of Kerr and Gaston Lakes and assimilation of soluble phosphorus by algae. Concentrations of phosphorus in the Neuse River Basin are the highest values of any in the Albemarle-Pamlico Drainage Basin.
 (604,505 bytes)
Nitrogen usually occurs as nitrate in oxygenated surface water or oxygenated shallow ground water. Excessive nitrate in drinking water can cause blue-baby syndrome and is associated with the occurrence of certain cancers (non-Hodgkins lymphoma) in humans (Spruill and others, 1996). About 4 percent of wells sampled throughout the Coastal Plain produced water with nitrate concentrations that exceeded the 10-mg/L drinking-water standard. The highest concentrations of nitrate in shallow ground water are associated with well-drained soils of the inner Coastal Plain in the Albemarle-Pamlico Drainage Basin (fig. 7). However, the highest nitrate-nitrogen concentration measured was 11 mg/L in an outer Coastal Plain sample. Low nitrate concentrations in shallow ground water of the outer Coastal Plain are due to denitrification or nitrate-reduction processes resulting from the large amounts of organic carbon in these poorly drained soils and sediments (Spruill and others, 1996).
| Summary statistics for nitrate-nitrogen concentrations in milligrams per liter. | |||
| STATISTIC | ENTIRE STUDY UNIT | INNER COASTAL PLAIN | OUTER COASTAL PLAIN |
|---|---|---|---|
| Number of wells | 49 | 19 | 30 |
| Minimum | 0.05 | 0.05 | 0.05 |
| Median | 0.05 | 0.38 | 0.05 |
| Maximum | 11 | 10 | 11 |
| Percent > 10 mg/L | 4% | 5% | 3% |
 (46,616 bytes)
Figure 7. Nitrate concentrations in shallow ground water of the inner Coastal Plain are significantly higher than nitrate concentrations in shallow ground water of the outer Coastal Plain.
Nitrate concentrations in streams were highest (greater than 1 mg/L) in heavily farmed areas in the Albemarle-Pamlico Drainage Basin (fig. 8). Nitrate concentrations which exceeded 1 mg/L occurred in the Tar and Neuse Basins in small streams located in areas having at least 40 percent or more agricultural land.
 (12,422 bytes)
 (32,479 bytes)
 (8430 bytes)
Figure 8. Small agricultural streams (sites 2 and 10) had the highest overall nitrate concentrations. Of the large streams draining more than 100 mi2, Contentnea Creek (site 5), the Neuse River (site 8), and the Tar River (site 11) had the highest median concentrations of nitrate, although none exceeded the 10-mg/L drinking-water standard. (Numbered sites are regularly sampled sites.)
By correlating flow and nitrate concentrations in streams, the sources of nitrate can be determined--a constant ground-water source, point source, or from surface runoff. A significant positive correlation indicates nonpoint sources in surface runoff (increase in concentration as flow increases), whereas a significant negative correlation indicates dilution at high flow--thus, a constant ground-water or point source. Negative correlations between nitrate and flow in the Tar and Neuse Rivers indicate that either ground-water base flow or point sources are responsible for most of the nitrate. However, concurrently collected samples of surface and ground water at 25 sites in the Coastal Plain during a low-flow period in September 1995 indicate that discharging ground water had very low or undetectable nitrate concentrations (fig. 9). This is probably because in a shallow ground-water system, most nitrate undergoes reduction or denitrification in the aquifer before water is discharged to the river. Deep ground water from long flow paths that discharge to these rivers also typically is low in nitrate. The organic material on stream bottoms and fine-grained organic-rich sediments of the floodplains of streams cause discharging ground water to denitrify (fig. 10). Low nitrate concentrations in discharging ground water is not a significant source of nitrate in the streams. Although naturally discharging ground water probably contributes little nitrate to streams, artificial drainage techniques, such as tile drains and ditches which intercept the water table, could contribute significantly as a nonpoint source of nitrate to stream load. Gilliam and others (1997) reported that about 28 pounds per acre of nitrogen, on average, is released from subsurface tile drains in agricultural areas of eastern North Carolina.
| Summary of synoptic site numbers, basin locations, and synoptic site names. Drainage basins: N, Neuse; T, Tar; A, Albemarle | ||
| SYNOPTIC SITE NUMBER | BASIN | SYNOPTIC SITE NAMES |
|---|---|---|
| 1 | N | Sandy Run near Lizzie |
| 2 | N | Hominy Swamp at SR 1606 |
| 3 | T | Van Swamp near Hoke |
| 4 | N | Neuse River at Kinston |
| 5 | T | Pete Mitchell Swamp near Penny Hill |
| 6 | N | Middle Swamp near Lizzie |
| 7 | N | Nahunta Swamp at SR 1058 |
| 8 | N | Little Contentnea Creek US 264A |
| 9 | N | Little Contentnea Creek US 258 |
| 10 | T | Durham Creek at Edward |
| 11 | T | Devil's Cradle Creek |
| 12 | N | Contentnea Creek at NC 222 |
| 13 | N | Contentnea Creek at Hookerton |
| 14 | N | Contentnea Creek at Evansdale |
| 15 | T | Chicod Creek at SR 1760 |
| 16 | N | Bloomery Swamp near Wilson |
| 17 | N | Bear Creek near Mays Store |
| 18 | T | Albemarle Canal |
| 19 | T | Scuppernong River at SR 1142 |
| 20 | A | Knobs Creek near Elizabeth City |
| 21 | A | Kendrick Creek at SR 1125 |
| 22 | T | Tar River at Tarboro |
| 23 | A | Newland Canal near Lynch's Corner |
| 24 | A | Goodwin Mill Creek at SR 1111 |
| 25 | A | Perquimans River at SR 1204 |
 (21,202 bytes)
Figure 9. Nitrate concentrations are low or barely detectable in discharging ground water compared to stream water at all sites sampled in the Coastal Plain, whereas ammonia and phosphorus concentrations tend to be higher in ground water discharging into the streams.
|
| Sampling site | Nitrate-nitrogen concentration | Chloride concentration | |
|---|---|---|---|---|
| Well 2A | <1 mg/L | 15 mg/L | ||
| Well 3B | 15 mg/L | 22 mg/L | ||
| Bed well | 18 mg/L | 17 mg/L | ||
| Canal | 2 mg/L | 20 mg/L |
Figure 10. As ground water moves along the flow path in a sandy aquifer in a small agricultural area of the Tar River Basin (flow-path study area, p. 26) from the hilltop to the canal, nitrate concentrations increase where fertilizer is applied on the farmed field and remain high until the ground water passes through organic material in the streambed, where concentrations are decreased as the ground water discharges to the canal. Bacterially mediated denitrification is primarily responsible for decreasing concentrations of nitrate from 15 mg/L in ground water before discharging to the stream to 2 mg/L in the canal. Chloride undergoes little change as it discharges to the canal, indicating dilution is not responsible for the decrease in nitrate concentrations.
Because naturally discharging ground water is not likely the source of nitrate, the negative correlation with flow indicates that point sources are the likely primary sources of nitrate in the Neuse River and Tar River. Data presented by McMahon and Woodside (1997) indicate that point sources accounted for about 30 percent of the nitrogen load in 1990 for the Neuse River at Kinston, N.C., and about 10 percent in the Tar River at Tarboro, N.C. Forty percent or more of the phosphorus load can be from point sources in the Roanoke and Neuse Rivers. One outer Coastal Plain stream (Van Swamp), one inner Coastal Plain stream (Bear Creek), and a Piedmont stream (Devil's Cradle Creek) showed significant positive correlations of streamflow to nitrate, indicating that nitrate is derived primarily from nonpoint sources in surface runoff. Because both nitrate and ammonia are positively correlated with streamflow in Devil's Cradle and Bear Creeks, animal waste or septic systems are indicated as primary sources. A significant positive correlation between flow and nitrate also indicates a surface nonpoint source of nitrate at Van Swamp, a small blackwater stream.
Nitrate is the main form of nitrogen in aerated waters with low organic carbon concentrations. However, nitrogen also exists in reduced form as ammonia (the ionized form of ammonia is generally termed ammonium; however, for this report, the ionized form will be referred to as ammonia) in low-oxygen waters; thus, when nitrogen occurs in water as ammonia, nitrate concentrations usually are low. Even though ammonia is not known to be toxic to humans or fish under typical concentrations or conditions, it is a biologically available form of nitrogen which can contribute to eutrophication. Ammonia can originate from decaying organic material, animal or human wastes, fertilizer, or from nitrate or nitrite that has moved into an anaerobic zone containing large concentrations of carbonaceous material (Spruill and others, 1996). Organic carbon, present in water and sediments of the Coastal Plain, allows bacteria to reduce nitrate to nitrogen gas and reduced nitrogen species. Ammonia-nitrogen concentrations in ground water ranged from less than 0.01 to 2.8 mg/L in the Albemarle-Pamlico Drainage Basin with highest concentrations in the outer Coastal Plain (fig. 11).
| Summary statistics for ammonia-nitrogen concentrations in milligrams per liter. | |||
| STATISTIC | ENTIRE STUDY UNIT | INNER COASTAL PLAIN | OUTER COASTAL PLAIN |
|---|---|---|---|
| Number of wells | 50 | 19 | 30 |
| Minimum | 0.010 | 0.010 | 0.030 |
| Median | 0.135 | 0.040 | 0.250 |
| Maximum | 2.80 | 0.700 | 2.80 |
 (41,850 bytes)
Figure 11. Ammonia-nitrogen concentrations in ground water were higher in the outer Coastal Plain (median = 0.250 mg/L) than in the inner Coastal Plain (median = 0.040 mg/L). The presence of abundant organic carbon in sediments of the outer Coastal Plain probably causes the higher concentrations of ammonia.
 (762,754 bytes)
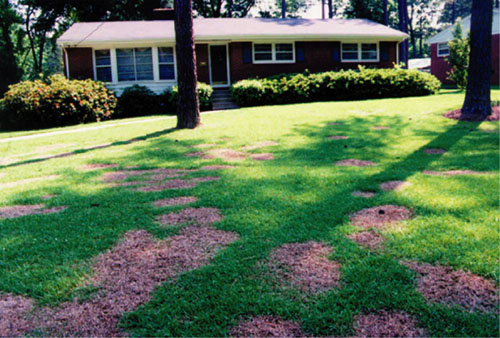
"Nitrogen-burned" lawn from too much fertilizer application
Stream concentrations of ammonia in the Albemarle-Pamlico Drainage Basin are relatively high compared to other parts of the United States (Mueller and others, 1995). Concentrations of ammonia in ground water discharging into streams in the Coastal Plain (fig. 9) were much higher (median = 1.2 mg/L) than concentrations in shallow ground water from randomly sampled wells throughout the Coastal Plain (median = 0.135 mg/L; fig. 11). The highest ammonia concentrations in streams occurred in Contentnea Creek and in small Coastal Plain streams. Elevated concentrations of ammonia in these streams may be due partly to discharging ground water or point-source discharges, although ammonia largely sorbs to bed material as indicated by much lower stream concentrations compared to ground water (fig. 9). In Bear Creek and Chicod Creek (fig. 12, sites 2 and 4), some ammonia may be due to animal wastes.
Figure 12. Concentrations of ammonia exceeding 0.1 milligram per liter occurred in streams throughout much of the study area. Much of the ammonia may be associated with discharging ground water or animal wastes.
 (10,890 bytes)
 (32,093 bytes)
 (8541 bytes)
 (176,662 bytes)
Sampling a well in the Coastal Plain, North Carolina
Phosphorus does not commonly occur in ground water at concentrations greater than a few hundredths of a milligram per liter because it tends to chemically attach, or sorb, to positively charged particles in soils and clays. In general, phosphorus concentrations in shallow ground water of the Coastal Plain of the Albemarle-Pamlico Drainage Basin reflect this in as much as the overall median phosphorus concentration was 0.035 mg/L (fig. 13). However, deep ground water in North Carolina had a median concentration of about 0.25 mg/L (Harned and others, 1995) compared to a much lower median concentration in shallow ground water. These relatively high concentrations of phosphorus are likely derived from phosphate minerals, such as fluoroapatite, in the aquifer sediments. The upward discharge of this deep ground water into shallow aquifers of the outer Coastal Plain may account for the slightly higher concentration compared to that of the inner Coastal Plain (fig. 13).
| Summary statistics for phosphorus concentrations in milligrams per liter | |||
| STATISTIC | ENTIRE STUDY UNIT | INNER COASTAL PLAIN | OUTER COASTAL PLAIN |
|---|---|---|---|
| Number of wells | 50 | 19 | 30 |
| Minimum | 0.010 | 0.010 | 0.010 |
| Median | 0.035 | 0.040 | 0.070 |
| Maximum | 1.40 | 1.30 | 1.40 |
 (33,048 bytes)
 (8870 bytes)
Figure 13. Shallow ground water from the outer Coastal Plain has significantly higher total phosphorus concentrations than does shallow ground water from the inner Coastal Plain. These higher concentrations, due to the presence of phosphorus minerals in the underlying aquifer sediments, may be a result of deep ground-water discharges into the surficial aquifer from long regional-flow systems in sands of Cretaceous age in the Coastal Plain.
 (770,496 bytes)
Sampling ground water discharging to a stream
Deep ground water also affects stream-water quality. Where phosphorus-rich, deep ground water discharges to streams, it affects surface-water quality. Results from sampling 25 sites during August and September 1995 throughout the Coastal Plain indicate that phosphorus concentrations in discharging ground water generally were higher than in surface water (fig. 9).The median phosphorus concentration in discharging ground water from these 25 sites was 0.2 mg/L, about the same concentration reported by Harned and others (1995) for deep ground water from the inner Coastal Plain. The median concentration of phosphorus in surface water at these sites was 0.1 mg/L. Ground-water phosphorus concentrations affect surface-water phosphorus concentrations, as indicated by a significant correlation for all 25 sites between discharging ground-water concentrations and stream concentrations. Concentrations of phosphorus in discharging ground water were highest in Contentnea and Chicod Creeks and in the Neuse and Tar Rivers. A negative correlation between flow and instream dissolved phosphorus was found in these basins, indicating that discharging ground water and point sources are the primary sources of phosphorus.
Of the 12 stream sites sampled regularly between 1992 and 1995, the highest median phosphorus concentrations were measured in samples from Chicod and Contentnea Creeks and from the Neuse and Tar Rivers (fig. 14). During the summer low-flow period when algal growth potential is highest, each of these four sites had concentrations of phosphorus greater than 0.1 mg/L, ranging from about 0.13 to 0.51 mg/L (fig. 15).
 (9208 bytes)
 (36,036 bytes)
 (9258 bytes)
Figure 14. The high concentrations of phosphorus measured in samples from Chicod Creek (site 4), Contentnea Creek (site 5), Neuse River (site 8), and Tar River (site 11) are probably due to ground water and(or) point-source discharges.
 (14,887 bytes)
Figure 15. The highest summertime (June-August) concentrations of phosphorus were detected in Chicod Creek (site 4), probably due to animal waste, and in Contentnea Creek (site 5), the Neuse River (site 8), and the Tar River (site 11), probably due to ground-water inputs and(or) point sources.
To meet literature-based guidelines, a 30- to 50-percent reduction in nutrient concentrations is needed to reduce nuisance algal production in streams of the Tar and Neuse River Basins.
In general, summer is the time when algal growths are at their maximum and also when nutrients are most important in limiting algal growths. Summer concentrations of phosphorus (fig. 15) and nitrogen (fig. 16) are particularly high in Chicod Creek, the Neuse River, the Tar River, and Contentnea Creek. For Contentnea Creek, a 30- to 50-percent reduction in phosphorus concentration would be necessary to attain the 0.1-mg/L phosphorus guideline (Mackenthum, 1969); for the Neuse River, a 50-percent reduction in phosphorus concentration would be required to approximate the 0.05-mg/L guideline for streams flowing into lakes or quiescent water (as in the Neuse estuary). Additional sources of phosphorus from sediments, however, could reduce the effectiveness of nutrient source controls in the estuary.
 (14,294 bytes)
Figure 16. Highest summertime (June-August) total nitrogen concentrations were detected in Albemarle Canal (site 1), Bear Creek (site 2), Chicod Creek (site 4), Contentnea Creek (site 5), Neuse River (site 8), Pete Mitchell Swamp (site 10), Tar River (site 11), and Van Swamp (site 12). Abundant nitrogen in these streams promotes excessive algal growth.
 (749,686 bytes)
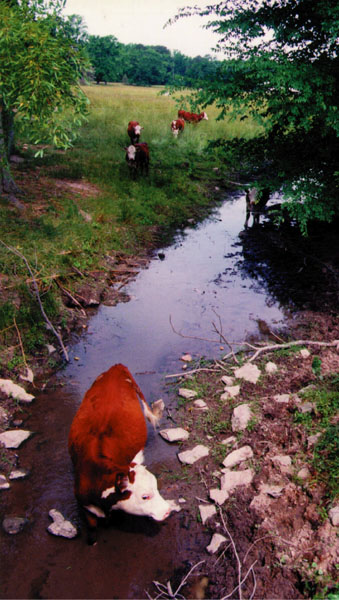
Livestock in a stream in the Contentnea Creek Basin, North Carolina
Median summertime concentrations of total nitrogen are higher than 1 mg/L in several streams, including the Tar River, Contentnea Creek, and the Neuse River (fig. 16). After phosphorus reductions and assuming a 7:1 cellular growth ratio of nitrogen to phosphorus, median summer nitrogen concentrations would need to be less than 0.7 mg/L for the Tar River and Contentnea Creek and 0.3 to 0.5 mg/L for the Neuse River to reduce algal growth. The Neuse River would require about a 50-percent nitrogen reduction, and the Tar River and Contentnea Creek each would require about a 30-percent reduction in total nitrogen to reduce the incidence of nuisance algal growth, fishkills, and undesirable odors. Natural geologic sources of phosphorus in these basins may make concentration reductions difficult for water managers.
Although only 4 percent of wells sampled by NAWQA across the Coastal Plain exceeded the 10 mg/L drinking-water standard, highly vulnerable areas in the inner Coastal Plain having well-drained soils and agricultural land uses are much more susceptible to nitrate concentrations. Almost 40 percent of the ground-water samples collected by the North Carolina Division of Water Quality in these areas exceeded the 10-mg/L drinking-water standard (Spruill and others, 1996). Limiting fertilizer or manure applications in such areas and developing deeper ground-water supplies that are protected from land-surface activities should minimize exposure to excessive nitrate concentrations. Although the ammonia concentration in the outer Coastal Plain is high in ground water discharged to freshwater streams, it does not appear to greatly affect concentrations of ammonia in freshwater streams (fig. 9); however, it may elevate stream ammonia concentrations. Such discharges could affect estuaries where the salt content of the estuary allows the ammonia to stay in solution. Elevated ammonia concentrations in ground water may be related to bacterial nitrate reduction or release from decay of organic material, particularly in aquifer deposits of the outer Coastal Plain, or from animal or human wastes.
Phosphorus concentrations in shallow wells generally were very low (less than 0.04 mg/L), although deeper formations of Miocene and Cretaceous age contain concentrations of phosphorus that are as high as 2 mg/L with a median of 0.2 mg/L. Discharge of this deeper ground water to streams where these formations are present increases phosphorus concentrations in streams of the Coastal Plain, particularly in the Tar and Neuse drainage basins. It is also possible that deep ground water accounts for the higher dissolved phosphorus concentrations in shallow ground water in the outer Coastal Plain. Elevated phosphorus concentrations contribute to eutrophication of streams and can stimulate growth of organisms associated with fishkills, such as Pfiesteria piscicida (Burkholder, 1997).