 Horseshoe Lake treekill (©John Rogie)
 |
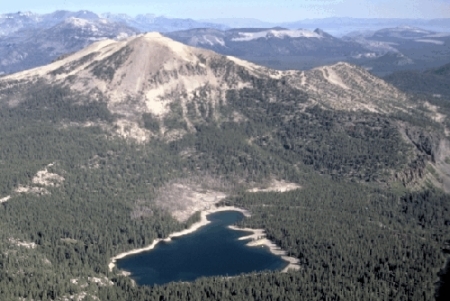
Aerial view of Horseshoe Lake and Mammoth Mountain. A large area of trees killed by carbon dioxide emissions is visible near the northern (top) shore of the lake. See tree-kill map for a map showing the locations of the carbon dioxide emission sites around Mammoth Mountain. |
High concentrations of carbon dioxide (CO2) in soil gas are killing trees on the flanks of Mammoth Mountain at the southwestern edge of Long Valley Caldera. First noted in 1990, the areas of tree kill now total about 170 acres in six general areas, including the most visually impressive tree-kill area adjacent to Horseshoe Lake on the south side of Mammoth Mountain. The soil gas in the tree-kill areas is composed of 20 to 90 percent CO 2; there is less than 1 percent CO2 in soils outside the tree-kill areas.
Carbon dioxide flux (the rate at which CO2 gas comes out of the ground) is monitored periodically at each tree kill area.
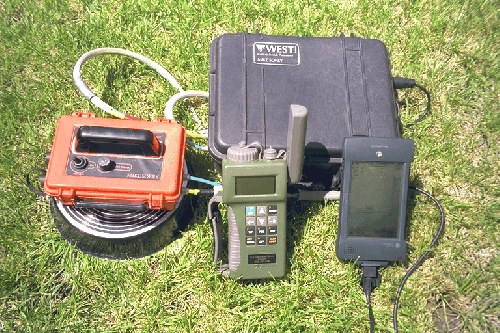 Portable CO2 flowmeter
 |
Sampling grids have been set up at the Horseshoe Lake tree kill and at other tree-kill areas on Mammoth Mountain so repeat measurements can be made of gas flow rates. A portable flowmeter is used to make measurements of gas flow at approximately 50-100 sites on the grid within a single day. |
 CO2 flow rates at Horseshoe Lake
 |
CO2 flow is measured in units of grams/day/square
meter (g/d/m2). The natural background rate of CO2
flux in this area is up to 25 g/d/m2. In this CO2
flow map made at the Horseshoe Lake tree kill on January 5, 1999 (when
the lake was frozen), the area of dead trees is outlined in red. The
pattern shows several small areas of very high flow (red patches) surrounded
by a broader region of lower gas flow rates. Note the arm of high flow
extending toward the lake - this is the area where collapse pits containing
high CO 2 concentrations develop each fall. The measured
flux at this time was 108 tons/day.
Twenty-one separate CO2 flux (flow x area) determinations made at Horseshoe Lake over the 1996-1999 period average 110 ±24 metric tons per day. For comparison, 110 metric tons of CO2 gas would fill approximately one million bottles of champagne. The observed variability in flux is most likely caused by changes in atmospheric conditions (e.g. barometric pressure and wind speed), rather than increasing or decreasing flow from the deep gas reservoir. |

Continuous Flow Instrument (CFI)
|
In a joint project between the USGS and Penn State University, two Continuous Flow Instruments (CFI's) were placed at several different locations on Mammoth Mountain during the 1998 and 1999 field seasons. CFI's measure the CO2 flow every 30-60 minutes, along with barometric pressure, wind speed and direction, temperature, and other environmental conditions. Data collected thus far indicates that at some sites gas flow rates can vary quite a bit over days or even hours. Interpretations are still in progress, but changes in gas flow appear to be positively correlated with the longer-term changes in barometric pressure. |
The most likely sources of the CO2 are degassing of intruded magma and gas release from limestone-rich metasedimentary rocks that are heated by magmatic intrusions. The remarkable uniformity in chemical and isotopic composition of the CO2 and accompanying gases at different locations around Mammoth Mountain indicates that there may actually be a large reservoir of gas deep below the mountain from which gas escapes along faults to the surface.
The CO2 is released as a cool, diffuse gas from broad areas of soil. Although it quickly dissipates when it leaves the ground, CO 2 is heavier than air and can collect in depressions in the land surface, in unvented buildings, and in other confined spaces. Carbon dioxide displaces oxygen and can cause unconsciousness or asphyxiation very quickly at concentrations above 30 percent. The National Institute for Occupational Safety and Health recommends a ceiling limit of 3 percent CO2 for up to 10 minutes for occupational exposure. Summer-time exposure to high levels of CO 2 in the Horseshoe Lake area may result from lying directly on the ground or digging pits in the ground. Walking through the area in the summertime is safe for children and dogs, as long as their heads stay above ground level. During the winter, CO2 levels can build up beneath the snowpack and the CO2 gas will preferentially escape around buildings, through tree wells, and through depressions around large rocks. Such areas should obviously be avoided, as should snow camping within tree-kill areas.
