U.S. Geological Survey Miscellaneous Investigations Series Map I-2091-A
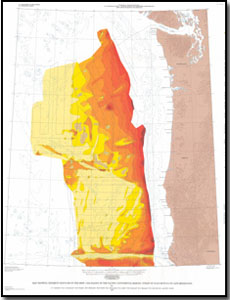
IntroductionThe U.S. Geological Survey conducted a series of cruises, EEZSCAN 84 (EEZ-SCAN 84 Scientific Staff, 1986), to collect reconnaissance data on the newly proclaimed Exclusive Economic Zone (EEZ), the area out to 200 nautical miles from the coastline of the United States. The cruises systematically surveyed the entire conterminous United States west coast EEZ using the Geological Long-Range Inclined Asdic (GLORIA) side-scan sonar, a 160-in3 airgun seismic-reflection profiler, a 3.5-kHz high-resolution seismic-reflection profiler, a 10-kHz echo sounder, and a proton-precession magnetometer. The nominal trackline spacing throughout the survey was 30 km. Derivative maps of sediment thickness (I-2089-A, I-2090-A, I-2091-A) and depth to basement (I-2089-B, I-2090-B, I-2091-B) in the basins of the west coast EEZ were compiled from both the sonar-image dala and the deep-penetration seismic data obtained on these cruises. Only EEZ-SCAN 84 data were used for the map compilations because available data from other cruises in this region are sparsely located, have poor navigational control, or were obtained with seismic systems that were not powerful enough to resolve oceanic basement. For this map series, sediment thickness and depth to basement were determined only in the deep-ocean basin regions because the seismic system used on the EEZ-SCAN 84 cruises could not resolve oceanic basement beneath the thick sediments of the continental slope. All the data used to compile the maps are presented in the "Atlas of the Exclusive Economic Zone, Western Conterminous United States" (EEZ-SCAN 84 Scientific Staff, 1986). Basement OutcropsGLORIA imagery was used to locate areas of basement outcrop throughout the region. Where possible, sediment thickness on and immediately adjacent to basement outcrops was measured from seismic data. Where there was no bathymetric or seismic control, a seamount peak was assumed to have no sediment cover. A pattern is used on the map to indicate all basement outcrops. Data ReductionAcoustic basement in the basins, invariably oceanic Layer 2, was observed on all of the seismic records. One-way traveltime was measured from the sea floor to acoustic basement. Because the trackline spacing of about 30 km is relatively large compared to the data density along track, we chose to measure the sediment thickness every 0.5 hour or at an interval of approximately 7.5 km. Water depth was measured with a 10-kHz profiler. Depth to basement was calculated using the sea surface as the zero datum and adding the corrected water depth (Carter, 1980) to the sediment thickness. Acoustic travel times were converted to depths by first calculating a regression equation from the interval velocity versus depth data of Connard and others (1984). Their data base comprises a compilation of all available Deep Sea Drilling Project data plus wide-angle refraction data, which were collected in Cascadia Basin west of Oregon and represents the best data set available for the United States west coast EEZ. The regression equation was integrated to determine sediment thickness as a function of one-way traveltime . The resulting equation is z = 1400t + 0 .5t2 where z is sediment thickness in meters, and t is one-way traveltime in seconds. Sediment thicknesses calculated using this equation were compared to values calculated from the general equation of Carlson and others (1986). Values for sediment thickness calculated by the two equations differed by no greater than 10 percent throughout the range of travel times. BathymetryThe bathymetry is from Chase and others (1981). The bathymetric data were compiled from a variety of sources, and data quality is inconsistent. Because of differences in navigational precision and density of coverage, the bathymetric contours of a feature may be at a different location than the corresponding isopleths derived from the EEZ-SCAN 84 data, or a feature may not be indicated on the bathymetry at all. These situations occur because either the feature is poorly located in the bathymetric data set or, especially in the outer EEZ, the bathymetric data are too sparse to have defined the existence of a feature. AcknowledgmentsTopographic digital data bases were corrected and verified by Christina Lief. Gerald Evenden developed the computer software system MAPGEN, used to compose this map. Reviews, suggestions, and technical contributions from Edward C. Escowitz and Florence Wong and advice about cartographic design from Will Stettner substantially improved the quality of this map. References CitedCarlson, R.L., Gangi, A.F., and Snow, K.R., 1986, Empirical reflection-traveltime/ depth and velocity/depth functions for the deep-sea sediment column: Journal of Geophysical Research, v. 91, no. B8, p. 8249-8266. Carter, D.J.T., 1980, Echo-sounding correction tables: Taunton, United Kingdom, Hydrographic Department, Ministry of Defence, 150 p. Chase, T.E., Wilde, Pat, Normark, W.R, Miller, C.P., Seekins, B.A., and Young, J.D., 1981, Offshore topography of the Western United States between 32° and 49° North latitudes: U.S. Geological Survey Open-File Report 81-443, scale 1:864,518 at 38° latitude, 2 sheets. Connard, G., Couch, R., Keeling , K., Roy, J., and Troseth, S., 1984, Abyssal plain and continental net-objective sedimentary thicknesses, in Kulm, L.D., and others, eds., Western North America continental margin and adjacent ocean floor off Oregon and Washington, Atlas 1 of Regional Atlas Series, Ocean Margin Drilling Program: Woods Hole, Mass., Marine Science International, sheet 7. EEZ-SCAN 84 Scientific Staff, 1986, Atlas of the Exclusive Economic Zone, Western Conterminous United States: U.S. Geological Survey Miscellaneous Investigations Series I-1792, scale 1:500,000, 152 p.
See Also“U.S. Pacific West Coast Field Activities” (Paskevich and others, 2011; https://pubs.usgs.gov/of/2010/1332/htmldocs/pc/pc_overview.html). Paskevich, V.F., Wong, F.L., O’Malley, J.J., Stevenson, A.J., and Gutmacher, C.E., 2011, GLORIA sidescan-sonar imagery for parts of the U.S. Exclusive Economic Zone and adjacent areas: U.S. Geological Survey Open-File Report 2010–1332, available at https://pubs.usgs.gov/of/2010/1332/. |
Map Collection
For additional information: This report is presented in Portable Document Format (PDF); the latest version of Adobe Reader or similar software is required to view it. Download the latest version of Adobe Reader, free of charge.
|
Gardner, J.V., Cacchione, D.A., Drake, D.E., Edwards, B.D., Field, M.E., Hampton, M.A., Karl, H.A., Kenyon, N.H., Masson, D.G., McCulloch, D.S., and Grim, M.S., 1993, Map showing sediment isopachs in the deep-sea basins of the Pacific continental margin, Strait of Juan de Fuca to Cape Mendocino: U. S. Geological Survey Miscellaneous Investigations Series Map I-2091-A, 1 sheet, scale 1:1,000,000.

![]() U.S. Department of the Interior |
U.S. Geological Survey
U.S. Department of the Interior |
U.S. Geological Survey
URL: http://pubsdata.usgs.gov/pubs/imap/2091/a/index.html
Page Contact Information: GS Pubs Web Contact
Page Last Modified: Wednesday, 30-Nov-2016 17:40:28 EST