 |
|
|
| USGS Woods Hole Science Center |
Home Page / Synopsis / Introduction / Profile / Relationships / Salient Tendencies / Acknowledgments / Bibliography / Appendix
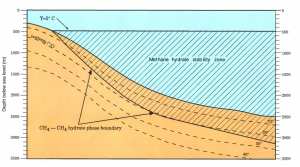 Figure 7. General stability range of methane hydrates on continental margins. Click for larger view. |
The phase boundary comprises the combinations of temperature and pressure at which a state of equilibrium exists between a free gas-seawater mixture and gas hydrate, assuming a proper molar ratio exists between methane and water. This is the subbottom depth at which the temperature has risen to a level, as controlled by the geothermal gradient, that precludes hydrate stability. It is ideally characterized by a zone of free gas and seawater overlain by a zone of gas hydrate. A representation of the phase boundary is shown in Figure 7.
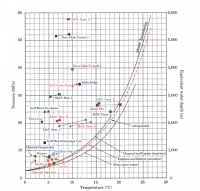 Figure 8. Relationship of estimated in-situ temperatures and pressures of methane hydrate samples to phase boundary. Click for larger view. |
Every sample in the database came from the methane hydrate stability zone Figure 8. Most show that in situ they were -- using pressure (depth) rather than temperature as a reference variable -- situated well above the phase boundary. This is one of the more striking revelations from this limited analysis of the database. If we assume that the methane supply originates from depths greater than that of the phase boundary, why are most of the samples found well above the phase boundary? Once the phase boundary is encountered by the rising gas-rich fluid, should not the gas hydrate form there?
Clearly, gas hydrates are not restricted to the domain of the phase boundary. These hydrates; that is, those situated well above the present regional phase boundary, herein are termed internal gas hydrates.
Four possible explanations for an internal hydrate are:
it formed at a time when its phase boundary was shallower; it is relict
it formed as a consequence of locally-controlled or locally-induced pressures and/or temperatures rather than under regional phase boundary conditions
it formed by site-specific gas enrichment, either in the absolute or relative sense
it formed elsewhere and was transported to its present location; it is allochthonous.
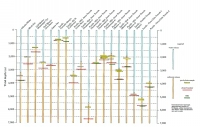 Figure 9. Summary of vertical spatial relationships of sample zones, BSRs, and calculated positions of the regional phase boundary for each site. Click for larger view. |
Another perspective of this is provided in Figure 9. It shows that the average position of a gas hydrate sample is approximately 300 m above its calculated regional phase boundary and that 70% of the samples are more than 100 m above the assumed position of that boundary. Figure 9 also shows the position of the BSR (Bottom Simulating Reflector) in the sediment column with respect to the phase boundary. The BSR is an acoustic reflector that approximately marks the interface between the base of the gas hydrate zone and free gas below; i.e., the phase boundary.
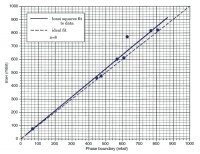 Figure 10. Relationship between position of phase boundary and position of BSR. Click for larger view. |
| Prev | Up | Next |
| Origin: Biogenic vs. Thermogenic | Home | 5. Salient Tendencies of Gas Hydrate Samples |
 [an error occurred while processing this directive]