Hawaiian Volcano Observatory
This report is preliminary and has not been reviewed for conformity with U.S. Geological Survey editorial standards or with the North American Stratigraphic Code. Any use of trade, product, or firm names is for descriptive purposes only and does not imply endorsement by the U.S. Government.
TABLE OF CONTENTS
LIST OF FIGURESInstrumentation
Summit vehicle-based data
East rift vehicle-based data
East rift tripod-based data
East rift and summit airborne measurements
Technique comparisons
Data quality codes
Figure 1. Main degassing sites on Kilauea Volcano
Figure 2. COSPEC traverse path - Kilauea summit.
Figure 3. SO2 emission rates - Kilauea summit 1979-1997
Figure 4. SO2 emissions rates - Kilauea ERZ - vehicle-based 1992-1997
Figure 5. Tripod-based measurement sites - Kilauea ERZ
Figure 6. SO2 emissions rates - Kilauea ERZ - tripod-based 1984-1997
Figure 7. SO2 emissions rates - Kilauea ERZ - vehicle/tripod comparison
LIST OF TABLES
Table 1a. Kilauea summit SO2 emission rates - vehicle-based 1979-1981
Table 1b. Kilauea summit SO2 emission rates - vehicle-based 1982-1997
Table 2. Kilauea ERZ SO2 emission rates - vehicle-based 1992-1997
Table 3. Kilauea ERZ SO2 emission rates - tripod-based 1984-1991
Table 4. Kilauea ERZ SO2 emission rates - tripod-based 1995-1997
Table 5. Kilauea SO2 emission rates - airborne measurements 1983-1995
Sulfur dioxide (SO2) emission rates from Kilauea Volcano were first measured by Stoiber and Malone (1975) and have been measured on a regular basis since 1979 (Casadevall and others, 1987; Greenland and others, 1985; Elias and others, 1993; Elias and Sutton, 1996). The purpose of this report is to present a compilation of Kilauea SO2 emission rate data from 1979 through 1997 with ancillary meteorological data (wind speed and wind direction). We have included measurements previously reported by Casadevall and others (1987) for completeness and to improve the usefulness of this current database compilation.
Kilauea releases SO2 gas predominantly from its summit caldera and rift zones (fig. 1). From 1979 through 1982, vehicle-based COSPEC measurements made within the summit caldera were adequate to quantify most of the SO2 emitted from the volcano. Beginning in 1983, the focus of SO2 release shifted from the summit to the east rift zone (ERZ) eruption site at Pu‘u ‘Ō‘ō and, later, Kupaianaha. Since 1984, the Kilauea gas measurement effort has been augmented with intermittent airborne and tripod-based surveys made near the ERZ eruption site. In addition, beginning in 1992 vehicle-based measurements have been made along a section of Chain of Craters Road approximately 9 km downwind of the eruption site. These several types of COSPEC measurements continue to the present.
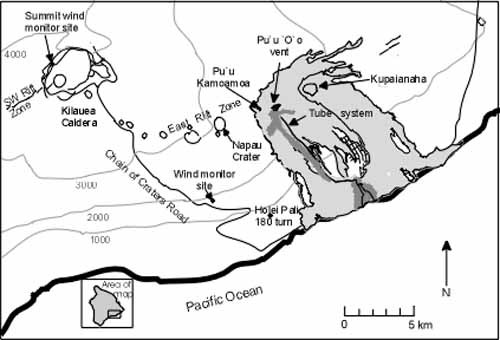
Figure 1. Summit and rift zones of Kilauea Volcano. From 1979 to 1997, most of the SO2 at Kilauea was released from the summit and east rift zone. Vehicle-based COSPEC measurements were made in the summit caldera and along Chain of Craters Road during trade wind conditions, to quantify summit and east rift zone emissions respectively. Intermittent airborne and tripod-based surveys made near Pu‘u ‘Ō‘ō, augmented the vehicle-based studies.
Numerous individuals including volunteers and staff of the Hawaiian Volcano Observatory (HVO) contributed to these approximately 1100 days of measurements, which include more than 5000 plume traverses and span 19 years of volcano monitoring. These measurements were funded under the Volcano Hazards, Global Change, and Geothermal Research Programs.
From 1979 through 1984, SO2 measurements at Kilauea were made with a COSPEC IV correlation spectrometer fitted with a standard SO2 correlation mask disc assembly and calibration cells of 89 ppm and 358 ppm. During eruptive periods in 1979 and 1982-1984, the burden of SO2 in the eruption plumes was high enough to saturate the instrument. In order to measure higher burdens of SO2, a high concentration disc assembly and higher concentration calibration cells (402 ppm and 1447 ppm) were installed in the instrument in 1984. The COSPEC was fitted with a Maxwellian telescope until June 1994, when a Cassegrain telescope was installed. Comparison measurements were made during daily data collection for several weeks during a period of relatively steady emission rates. These measurements suggest good agreement between the data collected with the two different types of telescopes.
The emission rate measurements at the summit of Kilauea reported here were made by vehicle-based COSPEC traverses within the summit caldera along Crater Rim Drive, as described by Casadevall and others (1987). The road traverse path used during typical trade-wind conditions is shown in figure 2. The data for 1979 through 1997 are shown in table 1a, table 1b and figure 3. Note that wind vector and standard deviation data are not reported for 1979-1981, as these parameters were unavailable. Casadevall and others (1987) note that data from September 1980 through October 1981 are considered to be of poor quality owing to the infrequency of data collection and inexperience of operators. With this caveat, the rest of the summit data from 1979 through 1997 are judged to be of good quality.
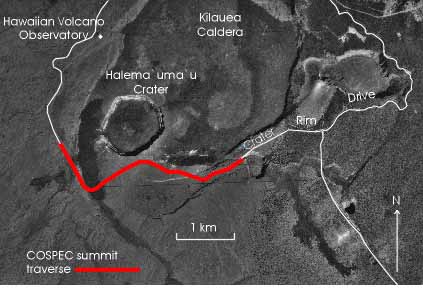
Figure 2. Aerial view showing the summit COSPEC traverse path at Kilauea Caldera. The most notable sources of SO2 in the summit region are fumaroles in and near Halema`uma`u Crater, and solfataras within the caldera. During prevailing trade-wind conditions, the plume is blown across Crater Rim Drive and thus can be measured by driving underneath with a vehicle-mounted COSPEC.
Figure 3. Kilauea summit SO2 emission rates in metric tons per day from June 1979 through 1997. Summit emissions increased with the onset of the 1983 Pu‘u ‘Ō‘ō eruption. Another increase is seen in early 1987, and summit emissions have declined from an average of 410 mt/d for February 1987 to 140 mt/d for February 1997.
Wind velocities for the summit COSPEC measurements were made 1 m above the ground near HVO before and after each set of COSPEC traverses, using a 5-minute average determined from a wind-counter. Our experiments have shown that wind speeds measured 3 m above the ground near this site are 20% higher than the 1 m measurements but are from nearly the same direction. Since calculated emission rates are directly proportional to wind speed, emission rates determined using 1 m wind speeds produce data that are likely to be minimum values. To improve the accuracy of our emission rate measurements, in January 1998 we began calculating SO2 emission rates using wind data measured 3 m above the ground, at a site 30 m west of the edge of the summit caldera (fig. 1). We believe that data from this site give a more reasonable representation of wind conditions at the elevation of the plume than the 1 m winds, and will contribute to a more accurate estimate of the SO2 released from the summit of Kilauea. For accuracy and continuity, therefore, the vehicle-based summit emission rate data presented in this report from 1979 through 1997 have been adjusted by +20% to reflect the wind speed correction. The reported wind speeds are also corrected values - they are increased by 20% from the measured values. Based on our wind characterization experiments, we estimate the uncertainty in summit wind speed measurements to be 10-20%.
For wind conditions with speeds greater than 5 m/s and directions between 25 o and 40o east, gases from Pu‘u ‘Ō‘ō typically form a compact plume that crosses Chain of Craters Road above the 180o turn at Holei Pali (fig. 1). Since 1992, vehicle-based COSPEC data obtained under these conditions have typically provided the best integrated estimate of Kilauea's ERZ SO2 release (table 2 and fig. 4). These measurements are made using the same procedure as for those made at the summit. Through mid-1994, wind velocities were determined using a variety of techniques, including: 5-minute wind-counter measurements at 1 and 4 m above the ground made before and after COSPEC traverses; tracking pilot balloons; and continuous, 5-minute wind-counter measurements made at 4 m during a day's COSPEC traverses. In 1994, we installed a continuous wind monitor 3.5 m above the ground, approximately 2.5 km above the 180o turn on Chain of Craters Road, to provide improved and contemporaneous wind speed determinations. East rift emission rates measured along Chain of Craters Road were reported earlier by Andres and others (1989). These measurements were made using wind vector data from twice-daily National Weather Service balloon releases at the Hilo airport, 12 m above sea level and 45 km northeast of the measurement site (R. Andres, personal communication, 1997). We believe that the continuous wind monitor may provide a more accurate estimate of wind velocity for the Chain of Craters Road measurements, because the east rift plume is frequently close to the ground as it crosses Chain of Craters Road. The uncertainty in wind speed measurements from Chain of Craters Road is estimated to be 10-20%
Figure 4. Averaged SO2 emissions from Kilauea's east rift zone as measured by vehicle-based COSPEC along Chain of Craters Road, 1992 through 1997. The black vertical bars represent the standard deviation of all traverses on a single day. These measurements have typically provided the best integrated estimate of Kilauea's ERZ SO2 release.
From 1984 through 1991, tripod-based measurements were made from Pu‘u Kamoamoa (KMM), approximately 1 km uprift of Pu‘u ‘Ō‘ō (fig. 5). Data are shown in table 3 and figure 6. Wind velocities were determined concurrently with the COSPEC measurements using a 5-minute average from a wind-counter located 1 m above the ground. A constant distance to the plume of 0.7 km was used to reduce these data, regardless of wind vector. The measurements made from KMM span a time period that includes episodic fountaining at Pu‘u ‘Ō‘ō (1983-1986) and continuous quiescent activity at the Kupaianaha vent (1986-1992). These eruptive episodes have been described by Wolfe and others (1988) and Heliker and others (1987,1991). Tripod-based SO2 data reported for 1984-1985 (fig. 6, filled boxes) generally characterize degassing at Pu‘u ‘Ō‘ō during the repose periods between fountaining events. However, on July 28, 1984, COSPEC data were collected during the eruptive episode 23 fountaining. At other times, measurements were made just after fountaining events or during other non-fountaining activity during this time period; these data are labeled on figure 6.
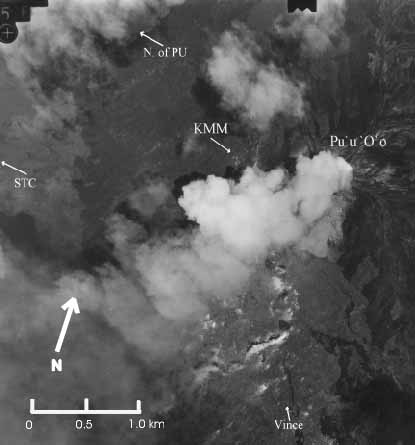
Figure 5. Aerial view of tripod-based COSPEC measurement sites on the east rift zone, 1984 to 1997. Through 1991, tripod-based measurements were made from Pu‘u Kamoamoa (KMM), approximately 1 km uprift of Pu‘u ‘Ō‘ō. From 1992 through 1995, changes in the eruptive vent, degassing character, and local topography forced us to seek alternate instrument sites. Sites STC, Vince, and N. of PU, all in use since 1995, permitted emission-rate measurements under a variety of wind and eruptive conditions.
Figure 6. Averaged SO2 emissions from Kilauea's east rift zone as measured by tripod-based COSPEC from 1984 through 1997. The black vertical bars represent the standard deviation of all measurements on a single day. Emission rates for 1984-1985 (filled boxes) generally characterize degassing at Pu‘u ‘Ō‘ō during the repose periods between fountaining events. However, eruption episode (EE) 23 data were collected during a fountaining event. Eruption episode 28 data were collected several hours after the end of a fountaining event, and eruption episode 19 and 35A measurements were made during other non-fountaining activity. Measurements of Pu‘u ‘Ō‘ō emissions made during eruption episode 48 (filled circles) were discontinued in late 1991. The hollow circles, stars, and filled triangles denote emission-rate data from various instrument sites used during 1995-1997 and span periods of eruptive pause, eruptive surge, and varying levels of vent activity.
Chartier and others (1988) describe the general data collection procedure for tripod-based measurements and report a detailed record of emissions during a 1985 repose period.
In 1986, the eruptive activity shifted to the Kupaianaha vent. During this time, Pu‘u ‘Ō‘ō continued to act as a chimney, venting gases as the magma traveled farther down rift to Kupaianaha. Degassing from Pu‘u ‘Ō‘ō formed a consolidated plume which commonly lofted above the ground—a plume geometry favorable for making tripod-based COSPEC measurements (fig. 6, filled circles).
From 1992 through 1995 a series of vents, fissures, collapses, and a broad shield developed on the flanks of Pu‘u ‘Ō‘ō (Heliker and others, 1998.) The narrow conduit inside the cone, which earlier focused the gas release, eventually enlarged to form a 300-m diameter crater. KMM was covered beneath tens of meters of lava, and acute changes in local topography occurred. The enlargement of Pu‘u ‘Ō‘ō crater, and an increase in the number of east rift degassing sites, contributed to a less well defined plume. These factors, along with changes in local topography, forced us to seek other sites when tripod-based measurements were resumed in 1995 (fig. 5). Sites indicated as STC, Vince, and N. of PU permitted emission-rate measurements under a variety of wind and eruptive conditions. The data for these measurements are shown in table 4 and figure 6 and span periods of eruptive pause, eruptive surge, and varying levels of vent activity.
Results of several other tripod surveys are shown in table 4, including emission-rate measurements made on individual skylights on the upper tube system just south of Pu‘u ‘Ō‘ō and also from vents on the flank of Pu‘u ‘Ō‘ō. Two sets of measurements are included that were made on the eruptive episode 54 vent in Napau Crater (fig. 1, table 4). For these measurements, wind velocity was determined with a wind-counter mounted on a pole 4 m above the ground using 5-minute averaging. Observed readings showed reasonable agreement when compared with continuous wind monitors located nearby. A variety of methods was used to determine the distance to, and width of, the plume, including paced distances, recent air photos taken during known wind conditions, and helicopter-borne GPS.
Airborne measurements of SO2 emission rates at Pu‘u ‘Ō‘ō (Casadevall and others, 1987) and at Kilauea's summit caldera (Greenland and others, 1985) were made during 1983 and 1984 and are presented in table 5. Plumes from eight of the Pu‘u ‘Ō‘ō eruptive episodes and two of the inter-eruptive periods were quantified using the airborne platform. During Pu‘u ‘Ō‘ō fountaining, enormous SO2 burdens were measured, while during inter-episode periods emissions declined significantly. Casadevall and others (1987) note that the concentration of SO2 exceeded that measurable by the COSPEC, thereby making the east rift data from 1983 through 1984 minimum emission rates. The inter-episode airborne measurements are generally consistent with the inter-episode tripod-based measurements. Likewise, summit airborne measurements agree well with the vehicle-based summit measurements made on the same day.
Airborne SO2 measurements of the east rift eruption plume were made again on September 19, 1995, after a lapse of 11 years. The changes in vent geometry, along with the advent of multiple degassing sources that began in 1992, gave rise to a broad plume whose bottom was at ground level (McGee and Gerlach, 1998). Thus, the emission rate reported for this date in table 5 is likely a minimum constraint, as the COSPEC traverses were flown 500' above ground level.
Vehicle- and tripod-based ERZ emission-rate measurements were made in 1995-1997. COSPEC measurements along Chain of Craters Road yielded emission rates consistently higher than those from near-vent tripod-based measurements (fig. 7). Andres and others (1989) also found a difference in vehicle and tripod-based measurements; vehicle-based measurements along Chain of Craters Road were 1.3-2 times greater than tripod-based data. We speculate that a combination of factors may contribute to this discrepancy, including multiple degassing sources, plume thickness and geometry, distance from the measurement site to the plume, and instrument configuration,. Although the tripod-based measurements provide important information on vent activity, these emission rates should be interpreted with care. Vehicle-based COSPEC data collected along Chain of Craters Road provide the best estimate of Kilauea's integrated ERZ SO2 release from 1992-1997 and are supported by the 1995 airborne measurements. Airborne measurements also provide a better estimate of total SO2 released from the east rift zone during eruptive fountaining episodes than do tripod-based measurements.

Figure 7. Vehicle- and tripod-based east rift zone emission-rate measurements from 1995 to 1996. COSPEC measurements along Chain of Craters Road yielded emission rates consistently higher than those from near-vent tripod-based measurements.
Data quality codes are presented with the Chain of Craters Road, vehicle-based data and 1995-1997 tripod-based data in table 2 and table 4. For the vehicle data, the following convention is used:
A - Best quality data - usually with strong, steady wind conditions, and a compact, consistent plume shape.
B - Good quality data - usually with moderately consistent plume shape and location of plume on road. Collected under moderately strong, uniform winds, with a good constraint on wind speed and direction.
C - Acceptable data - may have inconsistent plume location and shape. Wind speed and direction may be variable or poorly constrained. Some runs may measure a partial plume, representing minimum constraints on emission rates. Measurements with instrument inconsistencies are included in this category.
For the 1995-1997 tripod-based data, the following convention is used:
A - Best quality data - distance to plume less than 1 kilometer, and good constraint on measurement of distance; steady wind direction resulting in COSPEC angle consistently orthogonal to plume.
B - Good quality data - somewhat longer distance to plume from measurement site; may have variable wind conditions resulting in COSPEC angle occasionally non-orthogonal to plume.
C - Acceptable data - used indirect method to estimate distance to plume; measurements may have been made under less consistent wind conditions. Local terrain and increased distance from the plume may compromise measurement geometry.
The wind direction and wind speed can serve as a rough indicator of the data quality for vehicle-based measurements at Kilauea's summit. Conditions with wind speeds greater than 3 m/s and directions between 340o and 60 o generally indicate a sufficiently consolidated plume to be accurately quantified.
Andres, R.J., Kyle, P.R., Stokes, J.B., and Rose, W.I., 1989, SO2 from episode 48A eruption, Hawaii: Sulfur dioxide emissions from the episode 48A east rift zone eruption of Kilauea Volcano, Hawaii: Bulletin of Volcanology, v. 52, p. 113-117.
Casadevall, T.J., Stokes, J.B., Greenland, L.P., Malinconico, L.L., Casadevall, J.R., and Furukawa, B.T., 1987, SO2 and CO2 emission rates at Kilauea Volcano, 1979-1984, chap. 29 in Decker, R.W., Wright, T.L., and Stauffer, P.H., eds., Volcanism in Hawaii: U.S. Geological Survey Professional Paper 1350, v. 1, p. 771-780.
Chartier, T.A., Rose, W.I., and Stokes, J.B., 1985, SO2 emission rates at Pu‘u ‘Ō‘ō vent, Kilauea between east rift zone phases 33 and 34 [abs.]: Eos, Transactions, American Geophysical Union, v. 66, no. 46, p. 1132.
Elias, T., Sutton, A.J., and Stokes, J.B., 1993, Current SO2 Emissions at Kilauea: Quantifying scattered degassing sources[abs]: Eos, Transactions, American Geophysical Union, vol. 74, no.43, p.670.
Elias, T., and Sutton A.J., 1996, Long and short-term trends in SO2 emissions at Kilauea Volcano, Hawaii 1993-1996 [abs.]: Eos, Transactions, American Geophysical Union, v. 77, no. 46, p. F799.
Greenland, P., Rose, W.I., and Stokes, J.B., 1985, An estimate of gas emissions and magmatic gas content from Kilauea Volcano: Geochimica et Cosmochimica Acta, v. 49, p. 125-129.
Heliker, C.C., Ulrich, G.E., and Hoffmann, J.P., 1987, Pu‘u ‘Ō‘ō III: episodes 21-47 [abs.], in Decker, R.W., Halbig, J.B., Hazlett, R.W., Okamura, R., and Wright, T.L., eds., Abstract volume: Honolulu, University of Hawaii, Hawaii Institute of Geophysics, p. 105.
Heliker, C.C., and Wright, T.L., 1991, The Pu‘u ‘Ō‘ō-Kupaianaha eruption of Kilauea: Eos, Transactions, American Geophysical Union, v. 72, no. 47, p. 521, 526, 530.
Heliker, C.C., Mangan, M.T., Mattox, T.N., Kauahikaua, J.P., Helz, R.T., 1998, The character of long-term eruptions: inferences from episodes 50-53 of the Pu‘u ‘Ō‘ō-Kupaianaha eruption of Kilauea Volcano: Bulletin of Volcanology, v. 59, p. 381-393.
McGee, K.A., and Gerlach, T.M., 1998, Airborne volcanic plume measurements using a FTIR spectrometer, Kilauea volcano, Hawaii: Geophysical Research Letters, v. 25, no. 5, p. 615-618.
Stoiber, R.E., and Malone, G.B., 1975, Sulfur dioxide emissions at the crater of Kilauea, at Mauna Ulu, and at Sulfur Banks, Hawaii [abs.]: Eos, Transactions, American Geophysical Union, v. 56, no. 6, p. 461.
Wolfe, E.W., Neal, C.A., Banks, N.G., and Duggan, T.J., 1988, Geologic observations and chronology of eruptive events, in Wolfe, E.W., ed., U.S. Geological Survey Professional Paper 1463: The Pu‘u ‘Ō‘ō eruption of Kilauea Volcano, Hawaii: Episodes 1 through 20, January 3, 1983, through June 8, 1984, p. 1-98; 5 pls. (folded maps, scale 1:50,000) in pocket.
Download a copy of the latest version of Adobe Reader for free.
|
Help |
PDF help |
Publications main page |
| Western Open-File Reports for 1998 |
| Geologic Division |
Hawaiian Volcano Observatory
|
This report is available only on the Web

![]() U.S. Department of the Interior | U.S. Geological Survey
U.S. Department of the Interior | U.S. Geological Survey
URL: https://pubs.usgs.gov/of/1998/of98-462/
Page Contact Information: Michael Diggles
Page Last Modified: May 1, 2007