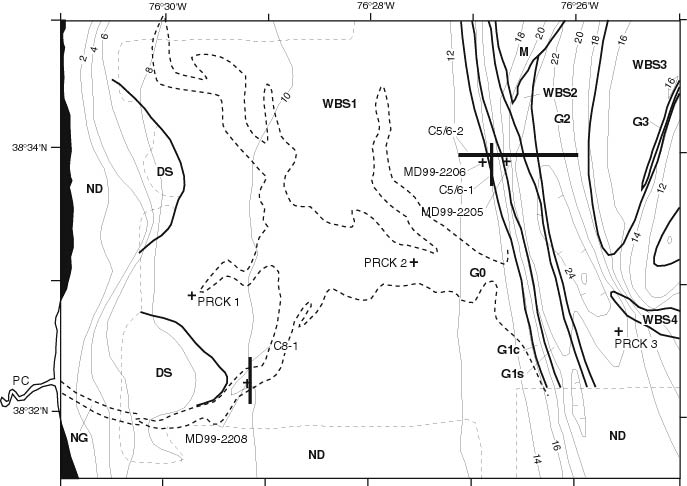
| Figure 2.4. Preliminary interpretation of NRL 100 kHz sidescan and 2-15 kHz chirp data (based in part on Hagen and Vogt (1999)). Area location shown in Figure 2.1. Thick solid bars are chirp profiles shown with geological interpretations in Figure 2.5 (profile C5/6-1), Figure 2.6 (profile C5/6-2), and Figure 2.7 (profile C8-1). Crosses mark core locations. Thin dashed line shows limits of ca. 100% sidescan sonar coverage (ND, no data). Heavier dashed line shows Parkers Creek paleochannel system, not revealed in sidescan data. NG (no gas) indicates nearshore portions of tributary paleochannels lacking biogenic methane bubbles (Colman and Halka, 1989; Hagen and Vogt, 1999). Strong-backscatter lobes are labeled DS (deltaic sediment). M denotes outcropping Miocene "basement". G and WBS provinces, discussed in text, denote different types of methane-gas related acoustic signatures (G) and areas of weak backscatter (WBS). Isobaths (thin solid contours) are in meters, based on NOAA data. |
TO RETURN TO REPORT, CLOSE THIS WINDOW.
U.S. Department of Interior, U.S. Geological Survey
URL of this page: https://pubs.usgs.gov/openfile/of00-306/chapter2/fig2-4.html
Maintained by: Eastern Publications Group Web Team
Last modified: 03.28.01 (krw)