USGS visual identity mark and link to main Web site at http://www.usgs.gov/

Digital Mapping Techniques '02 -- Workshop Proceedings
U.S. Geological Survey Open-File Report 02-370

GeoMapper Program for Paperless Field Mapping With Seamless Map Production in ESRI ArcMap and GeoLogger for Drill-Hole Data Capture: Applications in Geology, Astronomy, Environmental Remediation, and Raised-Relief Models

By George H Brimhall, Abel Vanegas, and Derek Lerch

Earth Resources Center Digital Mapping Lab
Department of Earth and Planetary Science
University of California, Berkeley
307 McCone Hall
Berkeley, CA 94720-4767
Telephone: (510) 642-5868
Fax: (510) 643-9980
e-mail: brimhall@socrates.berkeley.edu

INTRODUCTION

Publication of the first colored hand-painted geological map of England and Wales by William "Strata" Smith in 1815 heralded the birth of modern geology and acceptance of its foundational principles including superposition (Winchester, 2001). Since then, geologists have drawn maps in the field with a paper and pencil technology largely unchanged for almost two centuries. Even long after the transition to digital map production in offices in most geological surveys in the U.S. and Europe (Jackson and Asch, 2002), field mapping by geologists still clings to the traditional paper technology of the early 19th century. Consequently, the geologists practicing their scientific profession in the field, mapping and interpreting the complex archive of Earth history contained in the rocks, generally do not derive appreciable benefit from the digital and information technological revolutions that have advanced other fields of science to unprecedented levels. Hence, the gap between the paper-based mapping technology of field geologists and portable real-time computing remains surprisingly wide. Why does this technology gap persist today? What capabilities would be necessary to motivate and support a cross-over technology to digital field methods?

Our contribution to this volume is a summary of the present status of our efforts to help bridge this technological gap by producing well-tested and robust mapping software called GeoMapper and GeoLogger which support real-time digital geological mapping and integration of digital base maps and mapping tools. With our programs, complete "paperless" maps with databases that have full compatibility with ESRI ArcMap for map production are made in the field while employing modern digital electronic tools to maximum advantage for positioning and ranging. In the DMT '01 (Brimhall and Vanegas, 2001) volume we described GeoMapper functionality and use by geologists, including the scientific logic behind the design of the visual user interface, that support the complicated cognitive and reasoning processes of geological deduction. Many previous barriers to workflow have been removed through use of self-explanatory button arrays to access digital base maps and implement efficient mapping of structures (strike and dip, contacts, etc.), lithology, formations, mineralization, and alteration. Button control of GPS and lasers provides integration of base maps, positioning instrumentation, and mapping functions. In GeoMapper, Project Manager sets up mapping region files, and Legend Maker allows a user to easily customize the mapping legend to the local geology using only point-and-click techniques. In this volume, we present a series of applications of GeoMapper to real-world problems to illustrate the efficiency and versatility of GeoMapper and to introduce our new GeoLogger program for digital logging of drill holes.

While we present use of GeoMapper briefly here, we focus on the new features and refer interested readers to the DMT '01 paper (Brimhall and Vanegas, 2001) and to a Web site, http://www.rubicondigital.com/ where GeoMapper and GeoLogger can be obtained commercially and support services can be accessed. For the first time, surface mapping, underground mapping, and drill-hole logging can be accomplished using digital methods implemented in two integrated and compatible mapping software systems, one for mapping and the other for logging. Map production is done using the most widely used GIS software or alternatively by printing directly from GeoMapper and GeoLogger.

Digital Mapping in the Office: Map Production

The GIS revolution and availability of commercial software that supports map digitization, processing, and printing rapidly propelled office map production well ahead of field data-capture methods. "Digital mapping" in this sense is a process of conversion of original paper-based maps made by geologists in the field to digital record form and for publication on paper, commonly with a digital medium also being available to end users. While many surveys (Jackson and Asch, 2002) and mining and environmental companies have adopted a range of software for their map production process, ESRI products (ArcInfo, ArcView and Arc Map) are the most widely used. MicroStation and MapInfo also are used but to a lesser extent. Given the wide use of ESRI products, we have designed GeoMapper to seamlessly export into ArcMap for production while retaining the well-established advantages of GeoMapper to support a geologist's field methods.

Remaining challenges in office digital mapping surround scientific and technical standards that reduce inconsistencies in the geological legends and in the creation of comprehensive relational databases that support the profound complexities of geology (Soller and Berg, 2001; Soller and others, 2001). Previously, paper geological-map series tolerated inconsistencies between map sheets, but GIS and related digital systems need a more stringent approach (Jackson and Asch, 2002).

Digital Mapping in the Field: Data Capture (Geological Mapping)

We have approached digital mapping technology from a standpoint not of a conversion of paper to digital formats but rather of the creation of maps directly in digital form with relational databases being created in accord with the mapping legend developed for a project area. This approach circumvents the use of paper altogether while producing a database that is compatible with the most common GIS systems for map production (e.g., ArcMap). Paperless digital mapping eliminates the still common intermediate step between the field geologist and the office GIS staff and hence simplifies map production; it also has the potential for improving productivity and reducing loss of scientific information, which is a recognized problem in industry.

GeoMapper uses Strata Software's PenMap as an underlying program and can be viewed as advanced extension of it with new programmed capabilities to organize projects and customize the mapping legends. PenMap is a powerful surveying program with extensive device drivers to many GPS and surveying instruments and provides the raw graphics elements of points, lines, areas, and symbols. Kramer (2000) described the GeoMapper extension of PenMap as the "most complete, field tested, and proven Windows-based software for creating geological maps in the field." Use of GeoMapper has been described for general geology (Brimhall, 1998), field classes for undergraduate and graduate students in science, engineering and planning (Brimhall, 1999), and in professional mining and exploration geology (Brimhall and Vanegas, 2000). In collaboration with the USGS Water Resources Division, GeoMapper has been linked with hyperspectral infrared spectrometers for identifying and mapping minerals exposed on abandoned mine dumps as part of site characterization for screening and remediation including mapping from a helicopter platform (Montero Sanchez and Brimhall, 1998, in press; Montero Sanchez and others, 1999, in press).

In the past, many challenges retarded advances in field data capture. Besides the lack of effective software, until recently the hardware systems proved less than desirable. Only in the last year have there been available truly daylight-readable ruggedized color-pen-tablet PC computers (running Windows '98 and its successors). These PC's use lithium ion batteries with 3 to 4 hours of battery life. Effective electronic tools that plug into the pen tablets have existed for several years. Portable GPS units using Omnistar or the Coast Guard beacon for differential corrections in real time function without the need for a local base station. These units offer 1-meter accuracy in Northing and Easting and 2.5 meters in elevation unless satellite reception is obstructed by steep topography or tall buildings. Laser range finders with built in digital tilt meter and compass function up to 300 meters from the user. GeoMapper provides ready access through PenMap to all these digital tools and, in addition, creates a visual user interface that supports efficient geological mapping, including addition of color infill for formations using snap nodes and shared databases along contacts. Creation of professional-grade colored geological maps is straightforward with GeoMapper. Visual basic programs in GeoMapper provide database management and conversion for compatibility with ERSI ArcMap for seamless map production.

ADVANCES IN GEOMAPPER AND CREATION OF GEOLOGGER

From our perspective as scientific mapping software developers for industry and academia, the main challenges remaining in field-mapping software are in two areas: (1) providing ready access in digital form to supporting geological data such as local geology and stratigraphy for making legends while remaining as technically faithful as possible to established standards in nomenclature, and (2) the lack of effective digital drill-hole-logging software. Although paperless mapping has been possible with GeoMapper for three years, without a drill-hole-logging companion for GeoMapper, mining and exploration geologists were forced to rely on paper-log-sheet data entry, making complete transition to digital methods impossible. GeoMapper and GeoLogger can serve as a true cross-over technology from paper to complete digital mapping if implemented.

Enhancement of GeoMapper's Legend Maker: Direct Browser Access to the AAPG COSUNA Charts for the Entire U.S. in Digital Form on a Single CD-ROM

In any digital mapping project, a mapping legend is necessary to define mapping units that can be recognized and followed in the field by correlation. The legend must include all the discernible map units to be encountered in the region and also provide sufficient flexibility to be able to add new units if they are discovered. For this purpose, a wealth of carefully synthesized information exists in the American Association of Petroleum Geologists (AAPG) Correlation of Stratigraphic Units (COSUNA) charts (Childs and Salvador, 1985), which were published in digital form in 2002. The term "correlation" is used because the charts afford an opportunity to visually compare the stratigraphy from one column to another over an entire region, and recognize facies changes and lithotectonic classification (Muehlberger, 1996). The charts span the entire U.S. in 20 geographic regions including Alaska. These charts provide geological information from which effective mapping legends can be readily constructed for essentially anywhere in the U.S. All charts come in Adobe Acrobat PDF format on a single CD-ROM and show several thousand stratigraphic columns positioned in an index plan map within the 20 regions (Figure 1).

General regions for Correlation of Stratigraphic Units Charts       Figure 1. General regions for Correlation of Stratigraphic Units Charts (COSUNA) of the American Association of Petroleum Geologists (AAPG) (Childs and Salvador, 1985). Abbreviations: NCA, Northern California; CCA, Central California; GB, Great Basin; etc.

Within each regional AAPG chart, individual stratigraphic columns are presented in a plan map index (Figure 2) showing their geographic position and proximity to other stratigraphic sections in the same region, e.g., "GB" for Great Basin. The sections, including one example in Figure 3, are based both on drill-hole information and on surface geology. COSUNA charts show all stratigraphic sections in a region by their column number and geographic name. Formations are positioned vertically down through time with colored codes showing their dominant lithology. The COSUNA charts show the stratigraphic columns correlated with formal systems, series/stages, chronostratigraphic units, magnetic anomaly, planktonic foram zone, mammalian stages, molluscan stages, benthic foram zone, and absolute age in millions of years. With this information presented graphically, construction of mapping legends is possible for a broad array of disciplines including general geology, paleontology, environmental geology, engineering geology, hydrology, petrology, oil and gas, coal, industrial minerals. and metals mining and exploration. The CD-ROM is available on the Web from the AAPG Bookstore at http://www.aapg.org/datasystems/LibraryPricing.html.

California and Nevada regions for AAPG COSUNA Charts       Figure 2. California and Nevada regions for AAPG COSUNA Charts. Numbers represent the position of specific stratigraphic columns.

Example of part of a COSUNA chart for southern California       Figure 3. Example of part of a COSUNA chart for southern California.

VIEW a printable PDF file in a new window.

GeoMapper Project Manager and Legend Maker

Once defined and programmed for a specific field area, the button array expressing the stratigraphic section is the geologist's link with time and process and lays out the units to be recognized and mapped. To create a legend in GeoMapper we use Legend Maker, which is implemented when one clicks on Personalize Legend in the Project Manager (Figure 4). To personalize the legend, a user simply needs to use point-and-click skills to effect changes in the design of the formation and lithology buttons, select their area fill patterns and/or colors, and type-in their descriptive names. Typically this process takes less than an hour even for a complicated legend.

 Project Manager in GeoMapper       Figure 4. Project Manager in GeoMapper, showing button access to Legend Maker and other features.

Once the geological legend has been made, one clicks on Start Mapping on the Project Manager window (Figure 4). From this point on, GeoMapper's visual user interface shows arrays of buttons arranged so as to provide a logical, self-explanatory set of features used in mapping. In GeoMapper, the databases, layers files, and symbols are preprogrammed and linked so a user need not be concerned with database construction nor management. These tools are described in detail and illustrated in Brimhall and Vanegas (2001).

GeoMapper Tools Toolbar

This tool bar (Figure 5) includes specialized buttons for editing all types of graphics, sampling of rocks,soils, water, and infrared spectrometer sites. Export of all the digital mapped data as Shape files is done using the SHP button. The symbology of the graphics including areal patterns and infill colors is done with the button to the right of the SHP button.

Tools Toolbar

Figure 5. The Tools Toolbar contains special features such as those necessary for mapping and exporting completed maps and numerical databases into ESRI ArcMap for seamless map production.

Seamless Export from GeoMapper Into ESRI ArcMap: Open Architecture

From the Tools Toolbar, the finished database is exported so that ESRI ArcMap can be used for map production. We have made all the symbols such as strike and dip according to the USGS standard published in Open-File Report 95-525 (U.S. Geological Survey, 1995). Once in ArcMap, the Shape files are imported and our symbology is added to the Shape files, including points, lines, and areas (Figure 6). A map made in the field using GeoMapper is then imported into ArcMap with exactly the same line styles, colors, and patterns. We accomplish this seamless export to ESRI ArcMap and to other GIS programs as well (MicroStation, AutoCad) by using Microsoft Access as a personal, portable, relational database with a format amenable to ODBC (open database connectivity) clients. This open architecture provides many opportunities for using a variety of 2-D and 3-D GIS programs.

ESRI ArcMap rendering of lines, styles, symbols, formation color infills, and outcrop lithology patterns

Figure 6. ESRI ArcMap rendering of lines, styles, symbols, formation color infills, and outcrop lithology patterns made in GeoMapper and exported directly into ArcMap.

Final Map Production in ESRI ArcMap

With the mapping tools available in GeoMapper, complete geological maps made in the field can include color infill patterns for formations and patterns for outcrops if desired. Because we have designed GeoMapper from the standpoint of a geologist in the field, all the functionality desired by geologists is included. A key feature of GeoMapper is the ability to define the perimeters of colored polygons automatically by using so called "snap" nodes positioned along defining contacts so as to produce a professional-quality map. The level of certainty of contacts can be shown from solid black lines to dashed lines. Contacts offset by faults are easily shown as well. By showing outcrops in addition to formations, the primacy of the scientific record is preserved so that users of the map can find the same outcrops that the contacts are based upon. When a map is printed at a less detailed scale the outcrops disappear. Whenever desired, a working map can be printed directly from GeoMapper. Using the Shape-file export feature, the database can be exported and the compiled final map can be produced in ArcMap with the considerable advantages available in the ESRI environment, including compatibility with other ESRI products.

APPLICATIONS OF GEOMAPPER

To illustrate uses of GeoMapper we outline here several applications we have recently made. These applications include the fields of geology, astronomy, environmental geology, and tactile reality models for the disabled.

Mapping for Astronomical Purposes

The new Search for Extraterrestrial Intelligence (SETI) observatory will be located on the grounds of the Hat Creek Radio Telescope Observatory, in a remote area of northeastern California where radio background noise and artificial lighting are minimal. Available land for SETI's 350 new radio telescopes is quite limited at the Hat Creek site, necessitating a very closely spaced array, and hence, a very detailed topographic map. GeoMapper was used to make this map (Figure 7). The area is near the front of young basalt flows on valley-flow sediments. Land which is flat and free of lava tubes is required for the foundations of the new radio telescopes. Although we typically use GeoMapper in conjunction with a Trimble Ag-132 GPS that receives Omnistar differential corrections in real time with a point location of about 1 meter in plan and 2.5 meters in elevation, we needed higher accuracy for this project. By using a local base station (Figure 8) from which we computed diurnal drift correction, we corrected the x,y,z data for the four synchronized roving mapping systems used over a four-day period. Thus, by correcting our data in post-processing, we mapped at an accuracy of several decimeters in plan and 1 meter in elevation instead of the usual meter-level work. The data points were exported from GeoMapper and contoured in Surfer and output in plan view (Figure 9). Broad divisions of the available space for foundation sites for the new radio telescopes are based upon this map.

Aerial photograph of the Hat Creek Radio Telescope Observatory in northeastern California

Figure 7. Aerial photograph of the Hat Creek Radio Telescope Observatory in northeastern California. Young basalt flows are present on the left side of the photo.

GPS base station set-up showing solar panels for power

Figure 8. GPS base station set-up showing solar panels for power. Note radio telescopes in the background. Reference point is a permanent USGS survey monument.

Hillslope angle in plan view       Figure 9. Hillslope angle in plan view. Dark areas are cliff faces of the flow terminus. Contour interval is 2.5 slope units.

Environmental Remediation

Environmental remediation of abandoned mines requires a preliminary investigation of thousands of sites, and characterization and selection of a few sites most deserving of remediation. Hence, a sensitive and efficient screening method is paramount to success. We have integrated our GeoMapper system using a GPS and laser with a hyperspectral spectrometer to rapidly identify and map indicator minerals characteristic of pyrite oxidation and sulfuric acid generation (Montero Sanchez and Brimhall, 1998, in press; Montero Sanchez and others, 1999; in press) (Figure 10). The software/hardware combination works efficiently on the ground and from a helicopter using a reflectorless laser range finder (Figure 11). Oxidation indicator mineral maps show the regions of most intense acidification and show which mines and which areas warrant further investigation and water sampling.

Irene Montero Sanchez and George Brimhall demonstrate use of digital mapping system       Figure 10. Irene Montero Sanchez (A) and George Brimhall (B) demonstrate use of digital mapping system (from Montero Sanchez and Brimhall, in press). Numbers identify components in the mapping system. 1, probe holder for spectrometerÕs fiber optic probe; staff on which holder rests maintains the probe away from the operator at a constant height and angle above the ground. 2, target on the ground. 3, fiber optic cable transmitting light from the cable opening to the spectrometer. 4, portable, battery-operated spectrometer. 5, laser range finder with internal digital inclinometer and magnetic compass. 6, portable differential GPS receiver (inside backpack). 7, DGPS antenna. 8, pen-tablet portable PC computer.

Helicopter-based digital mapping system       Figure 11. Helicopter-based digital mapping system combining hyperspectral visible and infrared (IR) spectrometer and pen-tablet-based control system running GeoMapper. GPS unit is in the tail section and automatically updates the UTM coordinates of the reflectorless laser. Map shows pixels classified by the dominant mineral identified by the spectrometer.

Tactile Virtual-Reality Raised Models for the Blind and Disabled

GeoMapper has proven very effective in creating topographic maps and 3-D models. We have created a raised-relief scale model of the University of California, Berkeley campus 3 by 6 feet in size for use by blind and disabled students to learn their way around the campus (Figure 12). Managing the walking paths, avoiding traffic, and finding classrooms in buildings is aided by this tactile model. All entry points to buildings are shown, as are paths, roads, and obstacles. Paths and roads have textured surfaces classified by usage: roads where car traffic is expected, and paths where only pedestrians walk.

Raised-relief tactile-reality model of the University of California, Berkeley for blind students       Figure 12. Raised-relief tactile-reality model of the University of California, Berkeley for blind students. Heights of buildings were determined by laser range finder from the ground. Model is made of polyurethane foam machined from a solid block.

DRILL-HOLE LOGGING: FULL 3-D MAPPING AND MODELING

While the mapping described above is three dimensional in the sense that all nodes entered have 3-D coordinates which can be used to portray the Earth's topography and the model buildings, digital mapping software is incomplete without drill-hole-logging capabilities. Our intention in implementing digital core logging as a companion for GeoMapper is threefold: (1) provide a pen-tablet-based logging system that captures data directly in real time, (2) provide useful mineralogical tools with predictive metallurgical capabilities, and (3) afford more time for geologists to engage in productive interpretation by eliminating the widely used paper log forms that, later, require digitization.

Geological Logging

Much like mapping, which in a stereological sense reduces four-dimensional space-time to a two-dimensional plane, geological logging captures essentially a one-dimensional sample of the Earth provided by drilling. Rather than carrying a map board, colored pencils, and log sheets, we implement digital mapping through a pen-tablet computer, a touch stylus, digital log sheets, and a visual user interface that provides all logging functions by touching the pen stylus to an array of buttons.

Furthermore, the buttons are shown in the general sequence of their use so that scientific logic guides the selection of mapping tools. GeoLogger starts with a form for entry of drill-hole information (Figure 13). From there, a log sheet appears in digital form (Figure 14) showing geotechnical rock quality designation (RQD), structure, lithology, alteration, and sulfide mineralization. The format of the log sheet is designed in accordance with the needs of the users. The GeoLogger interface appears much like that of GeoMapper so that it is easy to learn and fast in execution. GeoLogger serves a variety of logging applications: base metals, precious metals, industrial minerals, and oil and gas.

GeoLogger data-entry form for a drill hole

Figure 13. GeoLogger data-entry form for a drill hole.

Digital log sheet

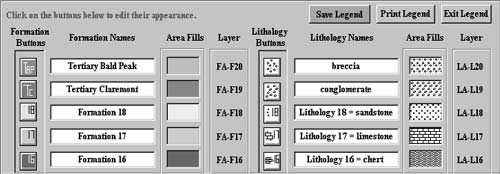
Figure 14. Digital log sheet. Point-and-click spatial resolution is 1 cm -- features may be located to hole depths with an accuracy of 1 cm), stored, and retrieved from the digital log sheet and database.

The button color-coding uses the "traffic light" method with green, yellow and red phases of activity. Green buttons are the most commonly used buttons in geological mapping. Yellow buttons are procedures that are used only rarely (for example if you need to erase or undo the last work). Red buttons are procedures that are essential to do before you stop mapping (for example, saving your files or exporting critical files). Other colors relate to special-use functions, such as light-blue buttons for selecting various-scale log sheets.

GeoLogger has an organized array of buttons representing different rock types, structures, mineralization, alteration, sampling, and geotechnical features, each set in a tool bar. To log a feature, one has only to click on the appropriate button and then touch the screen of the pen-tablet computer at the appropriate hole depth. If the feature occurs over an interval of core, then the top and bottom depths on the screen are touched. This point-and-click action automatically selects the right layer, database, and graphics and associates this information with the down-hole depth. The computer, stylus, visual user interface, and base log sheet provide an integrated system for the geologist. Digital images of core samples provide ready access to key features noticed while logging (Figure 15). Notes are entered using a stylus and digital keyboard. The final printout of the completed digital log appears identical to paper logs. Chemical data such as metal assays can be imported into the log database and displayed for purposes of correlating with observed geological features (Figure 16).

Digital image of diamond drill core       Figure 15. Digital image of diamond drill core.

      Figure 16. Example of GeoLogger log showing imported platinum group metals (PGM), copper and nickel, and normative sulfides (pyrite, pyrrhotite, pentlandite, and chalcopyrite), computed using metal and sulfur assays, and correlation coefficients of PGM with each normative sulfide.

Pedagogical Advantages of a Preprogrammed Legend

The design of the mapping legend itself encourages attainment of high professional standards in a minimum of training time. Because the logging is done with a set of computer tools, standardization of the features is automatic thereby reducing the time necessary for training new geologists. Critical data-entry fields such as sample number are compulsory so that a logger cannot proceed without completing the data entry. The visual user interface provides a simple organization for lithologies, structures, mineralization, alteration, sampling intervals, and geotechnical information such as RQD.

CONCLUSIONS

Our experience in digital mapping has opened many new avenues of thought for us. It has convinced us that the central role of this powerful new technology is in creating and communicating in human terms a geospatial reality that conveys meaning and order about the physical world to many quite different audiences. Potential user communities abound, and geology remains the bedrock anchor to the solid Earth on which human endeavor is linked. The "map that changed the world" published in the early 19th century by William Smith gave birth to the field of geology and a host of scientific and economic benefits. Geologists today retain a practical acquaintance of space and time but now possess mapping tools so enhanced by the digital revolution that limitation seems unimaginable. Mapping opportunities abound to help guide the stewardship of the Earth and to improve the human condition.

REFERENCES

Brimhall, G., 1998, Direct digital field mapping using pen-based PC computers supported by differential global positioning systems and laser range finders: Geological Society of America Abstracts with Programs, v. 30, no. 7, p. A-256.

____________ 1999, Evaluation of digital mapping classes in introductory and advanced field classes at UC Berkeley: Geological Society of America Abstracts with Programs, v. 32, no. 7, p. A-191.

Brimhall G.H., and Vanegas, A., 2000, Digital mapping of geology and ore deposits with GeoMapper: Geological Society of America Abstracts with Programs, v. 32, no. 7, p. A-514.

____________ 2001, Removing science workflow barriers to adoption of digital geological mapping by using the GeoMapper universal program and visual interface, in Soller, D.R., ed., Digital Mapping Techniques '01 -- Workshop Proceedings: U.S. Geological Survey Open-File Report 01-223, p. 103-114; https://pubs.usgs.gov/of/2001/of01-223/brimhall.html.

Childs, O.E., and Salvador, A., 1985, Correlation of Stratigraphic Units of North America (COSUNA): American Association of Petrololeum Geologists Bulletin, v. 69, p. 173-189.

Jackson, I., and Asch, K., 2002, The status of digital geological mapping in Europe: the results of a census of the digital mapping coverage, approaches and standards of 29 European geological survey organizations in the year 2000: Computers in Geosciences, v. 28, p. 783-788.

Kramer, J.H., 2000, Digital mapping systems for field data collection, in Soller, D.R., ed., Digital Mapping Techniques '00 -- Workshop Proceedings: U.S. Geological Survey Open-File Report 00-325, p. 13-19; https://pubs.usgs.gov/openfile/of00-325/kramer.html.

Montero-Sanchez, I.C., and Brimhall, G.H., 1998, Novel application of digitally integrated mapping systems for the mineralogical characterization of abandoned mines: Geological Society of America Abstracts with Programs, v. 30, no. 7, p. A-358.

Montero Sanchez, I.C., and Brimhall, G. H, in press, FSTSpecID: fast spectral analysis program for the identification of dominant secondary iron mineralogy using integrated digital mapping of abandoned mines: Remote Sensing of the Environment.

Montero-Sanchez, I.C., Brimhall, G.H., and Alpers, C.N., 1999, Use of UV/VIS/IS spectroscopy to characterize mine waste dumps in the Penn Mine, Calaveras County, California: Geological Society of America Abstracts with Programs, v. 31, no. 6, p. A-91.

Montero Sanchez, I. C., Brimhall, G.H., Alpers, C.N., and Swayze, G.A., in press, Characterization of waste rock associated with acid drainage at the Penn Mine, California by ground-based visible to short-wave infrared reflectance spectroscopy assisted by digital mapping: Chemical Geology.

Muehlberger, W. R., compiler, 1996, Tectonic map of North America: American Association of Petroleum Geologists, scale 1:5,000,000.

Soller, D. R., and Berg, T. M., 2001, The National Geological Map Database: a progress report, in Soller, D.R., ed., Digital Mapping Techniques '01 -- Workshop Proceedings: U.S. Geological Survey Open-File Report 01-223, p. 51-58; https://pubs.usgs.gov/of/2001/of01-223/soller1.html.

Soller, D. R., Wahl, R., Weisenfluh, J., Brodaric, R., Hastings, J., Laudati, R., and Fredericks, R., 2001, Progress report on the National Geologic Map Database, Phase 3 -- an online database of map information, in Soller, D.R., ed., Digital Mapping Techniques '01 -- Workshop Proceedings: U.S. Geological Survey Open-File Report 01-223, p. 71-78; https://pubs.usgs.gov/of/2001/of01-223/soller2.html.

U.S. Geological Survey, 1995, Draft cartographic and digital standard for geologic map information: U.S. Geological Survey Open-File Report 95-525.

Winchester, Simon, 2001, The map that changed the world: New York, Harper Collins, 329 p.


RETURN TO Contents
National Cooperative Geologic Mapping Program | Geologic Division | Open-File Reports
U.S. Department of the Interior, U.S. Geological Survey
URL: https://pubsdata.usgs.gov/pubs/of/2002/of02-370/brimhall.html
Maintained by David R. Soller
Last modified: 19:15:22 Wed 07 Dec 2016
Privacy statement | General disclaimer | Accessibility