Abstract
A large potential rock avalanche above the northern shore of Tidal Inlet,
Glacier Bay National Park, Alaska, was investigated to determine hazards
and risks of landslide-induced waves to cruise ships and other park visitors.
Field and photographic examination revealed that the 5 to 10 million cubic
meter landslide moved between AD 1892 and 1919 after the retreat of Little
Ice Age glaciers from Tidal Inlet by AD 1890. The timing of landslide movement
and the glacial history suggest that glacial debuttressing caused weakening
of the slope and that the landslide could have been triggered by large earthquakes
of 1899-1900 in Yakutat Bay. Evidence of recent movement includes fresh scarps,
back-rotated blocks, and smaller secondary landslide movements. However,
until there is evidence of current movement, the mass is classified as a
dormant rock slump. An earthquake on the nearby active Fairweather fault
system could reactivate the landslide and trigger a massive rock slump and
debris avalanche into Tidal Inlet. Preliminary analyses show that waves induced
by such a landslide could travel at speeds of 45 to 50 m/s and reach heights
up to 76 m with wave runups of 200 m on the opposite shore of Tidal Inlet.
Such waves would not only threaten vessels in Tidal Inlet, but would also
travel into the western arm of Glacier Bay endangering large cruise ships
and their passengers.
Introduction
A large detached mass of rock and debris (fig.
1) above the northern shore
of Tidal Inlet, Glacier Bay National Park in southeastern Alaska (fig.
2)
was recognized in 1964 by geologist David Brew (pers. commun., 2002). Brew
et al. (1995) suggested that this perched mass of rock posed a threat similar
to what occurred in Lituya Bay, Alaska (fig. 2). On July 9, 1958, a magnitude
M 7.9 earthquake on the Fairweather Fault triggered a rock avalanche at the
head of Lituya Bay. The landslide generated a wave that ran up 524 m on
the opposite shore and sent a 30-m high wave through Lituya Bay sinking two
of three fishing boats and killing two persons (Miller, 1960). In 1995, after
Matthias Jakob recognized the unstable mass of rock above Tidal Inlet, he
submitted a proposal (EBA Engineering, 1997) to the National Park Service
(NPS) to assess the potential risks that this landslide posed to visitors
and ships. Between May and September cruise ships carry several thousand
passengers daily past Tidal Inlet. In 2002 the NPS supported this investigative
field research team to assess the potential hazards and risks in Tidal Inlet.
This preliminary report focuses on the hazards posed by the Tidal Inlet landslide;
a later report will include a detailed wave model analysis and risk assessment.
Geographic Setting
Glacier Bay National Park, located in the northern part of southeast Alaska,
is a land of glacier-clad, snow-capped mountain ranges rising to over 4,500
m, coastal beaches, deep fjords, tidewater glaciers, and freshwater lakes.
A wet and cool climate supports thick vegetation through much of lower Glacier
Bay where vegetation has reclaimed land recently covered by glaciers, while
the upper bay is covered by shrubby vegetation. Summer daytime temperatures
range between 45 and 65°F,
but at night may be near freezing. In 1794 Captain George Vancouver visited
the region and discovered that Glacier Bay was largely covered by glacial
ice to the outlet into Icy Strait (fig. 2). John Muir noted in 1879 that
the ice had retreated about 78 km. Tidal Inlet is located (fig.
2) about
55 km up Glacier Bay, on the east side of the west arm.
Glacial History
Cool temperatures, ample precipitation, and complex high topographic relief
of Glacier Bay National Park have resulted in extensive ice fields. Massive
cordilleran ice sheets cyclically expanded and swept seaward across this
terrain throughout the Pleistocene. The last glacier maximum came to a close
in this region between 10,000 and 12,000 years ago (Miller, 1975; Mann, 1986;
Goodwin, 1988) and was followed by the non-glacial Hypsithermal Interval
of the Holocene, which ended about 6000 y BP.
The region experienced several cycles of glacier expansion and contraction
during the late Holocene, beginning about 3000 years ago (Goodwin, 1988;
Motyka and Beget, 1996). The most recent advance, the Little Ice Age (LIA),
spanned a period lasting from the mid-13th century to the late
19th century in this region, and is of particular importance to
this study. The LIA advance appears to be the largest of the late-Holocene
advances, as no recognizable older moraines lie beyond the LIA maximum. The
LIA expansion filled both arms of Glacier Bay with over 1-km thick ice and
extended into Icy Strait (Goodwin, 1988; Molenaar, 1990; Larsen et al., 2002)
(fig. 2). It is not known when the glaciers reached their LIA maximums.
Although the LIA continued well into the 19th century in many
parts of Alaska, a region-wide glacier retreat from the LIA maximum in southeast
Alaska began during the mid to late 18th century (Goodwin, 1988;
Post and Motyka, 1995; Motyka and Beget, 1996). Non-tidewater glaciers retreated
very slowly through the late 18th and 19th centuries
and a few even experienced standstills and slight readvances (Motyka and
Beget, 1996; Motyka et al., 2002). In contrast, tidewater glaciers in Glacier
Bay rapidly retreated by calving during the same period (Goodwin, 1988). Once
tidewater calving glaciers retreat into deep water, they become unstable
and undergo catastrophic retreat that is independent of climate, as part
of the “tidewater glacier cycle” (Post and Motyka, 1995). The main trunk
glaciers at Glacier Bay retreated about 120 km from Icy Strait to the head
of the west arm of the bay in just 180 years (fig.
2), ranking it as the
fastest and most prolonged historic tidewater calving retreat in Alaska. This
retreat caused rapid glacial unloading, causing isostatic regional rebound
(Larsen et al., 2002). Tidewater glacier retreat finally slowed and some
tidewater glaciers in Glacier Bay even began readvancing during the 20th century
(Molenaar, 1990). In contrast, the rate of net loss of non-tidewater glaciers
in the region increased significantly during the 20th century
(Arendt et al., 2002; Motyka et al., 2002).
Little Ice Age History of Tidal
Inlet
Most of the Tidal Inlet (fig. 3) was covered by ice during the LIA. Till
that is several meters in thickness and deposited by LIA glaciers, mantle
valley walls at elevations as high as 600 m above the northern shore of Tidal
Inlet. The source region for the ice in Tidal Inlet is most likely a combination
of the 1,000+ m high mountainous region north of the inlet and ice from the
east arm of Glacier Bay. Photo interpretation of LIA lateral moraines indicate
that this ice from Tidal Inlet coalesced with adjoining icefields flowing
into the west arm trunk glacier. The ice dam created by the main trunk
glacier at the mouth of the inlet helped impound ice in Tidal Inlet.
Deglaciation of Tidal Inlet probably proceeded simultaneously with the calving
retreat that rapidly depleted ice in both arms of Glacier Bay during the
19th century. Thinning of ice in the main arms reduced heights
of ice dams blocking tributaries, allowing them to accelerate flow and draw
down their respective icefields. The terminus of the west arm glacier had
retreated up bay beyond the mouth of Tidal Inlet by AD 1880 (Molenaar, 1990).
Maps by Reid (1896) show that Tidal Inlet was devoid of ice by AD 1890 except
for a remnant glacier at its head.
Dendrochronology
In order to obtain minimum estimates of post-LIA reforestation of the area,
and therefore a minimum age for deglaciation, we cored several Sitka spruce
trees (Picea sitchensis) that are growing in a low-lying area, south
of the entrance into Tidal Inlet (fig. 3-Pts. 1, 2). Standard increment
borers were used and extraction heights on the tree stems were about 0.7
m. Only the largest and presumably oldest spruce trees were chosen. The
base elevation of trees sampled was well above any coastal emergence that
might have taken place as a result of post-LIA glacier rebound (Motyka, 2003). The
cores from the sampled trees gave nearly uniform tree-ring counts (68 to
74) suggesting nearly contemporaneous colonization. To correct for tree
age to the height of core extraction (0.7 m), we used an estimate of 13 years,
based on work by Fastie (1995) on post-glacial succession in Glacier Bay. Thus,
minimum germination age for these Sitka spruce is on the order of AD 1915
to 1920. Fastie (1995) found that ecesis for Sitka spruce, i.e., the time
lag between deglaciation and germination, averaged about 15 years in the
east arm during the early 20th century. Using this value, the
south lowland entrance into Tidal Inlet would have to have been free of ice
by about AD 1900 to 1905. However, Reid (1896) showed Tidal Inlet free of
ice by AD 1890. Thus, ecesis may have been ten years longer here than in
the east arm.
Two spruce trees were cored on the lowland valley at the eastern end of
Tidal Inlet (fig. 3-Pt. 3). Using the procedures outlined above, these
trees gave germination ages of AD 1938 and 1932. Deglacation of this region
appears to have lagged behind that of west Tidal Inlet by a couple of decades
when ecesis is taken into account. This finding agrees with Reid (1896),
which shows remnant ice existed in this region in AD 1890. A large rock
avalanche deposit is located in a valley that drains from the north into
Tidal Inlet near its mouth (fig. 3-Pt. 4). Two trees that are growing on
these deposits were cored. The older tree germinated around AD 1922, which
provides a minimum age for deposition of this rock avalanche. It also indicates
that the valley in this region was ice free by about AD 1900, which agrees
well with Reid (1896).
Geology of Tidal Inlet
Lithology
The geology of the Tidal Inlet region originally mapped by Rossman (1963)
has been modified by Brew (written commun., 10/02). The geology in the vicinity
of the landslide along the northern shore of Tidal Inlet (fig.
4) consists
of two main geologic units—the Pyramid Peak Formation (Devonian or Silurian)
and the Tidal Formation (Late Silurian) covered in places by Surficial Deposits
(Holocene and (or) Pleistocene). The Pyramid Peak Formation comprising the
slopes above the landslide is made of thin- to thickly-bedded limestone with
a locally massive appearance; individual beds are 2 cm to 1 m thick, with
most 5 cm to 50 cm thick; light-gray to very dark-gray (Brew, written commun.,
10/02). The Tidal Formation near the shoreline on the slopes below the landslide
and higher on the slope in the main scarp consists of thin-bedded argillite,
calcareous greywacke, and minor limestone; individual beds are < 1mm to
several cm thick, generally brown to brownish gray. These rocks contain dipping
sedimentary structures that are believed to belong to turbidite-fan complexes.
Surficial Deposits
Glacial-till deposits several meters in thickness mantle the slopes of the
northern shore of Tidal Inlet in many places up to elevations of 600 m. These
deposits have been deeply eroded by incised gullies forming steep linear
ridges and deeply incised furrows (fig. 5). In contrast, on the landslide,
rotational movement has formed steep back-facing scarps, which has displaced
the till. Otherwise the till shows little sign of surficial erosion. The
high erodibility of the till along the margins of the landslide, where surface
drainage and runoff was not interrupted by the main scarp, and many secondary
back-rotational scarps, suggest that the till has eroded since the landslide
moved.
We examined the shorelines within Tidal Inlet
to determine whether previous landslides had generated waves. We found
no evidence of wave runup on the southern shore of Tidal Inlet opposite
the landslide (fig. 3-Pt. 2). Turbidite bedrock is exposed at elevations
of less than 30 m on the southwest shore. Further upslope from the shore,
we found glacial erratics, e.g. granitic boulders, at least one meter in
maximum dimension, overlying glacial sandy till (20 cm thick) over gray
silty sand extending to a depth of 90 cm. Sitka spruce began colonizing
this area in the beginning of the 20th century. Further southwest,
(south of Tidal Inlet) lies a pass of about 60-m elevation, where a large
wave generated by a landslide from the northern shore of Tidal Inlet could
have traveled overland. On the shore in the west arm beyond the lowpoint
(fig. 3-Pt. 1), we found sandy pebbly gravel till or colluvium overlying a 2-3 cm
thick layer of light gray silty sand at a depth of about 80 cm. Had this
sand layer been deposited by a sudden large landslide-generated wave that
traveled overland from the northern shore of Tidal Inlet, it is unclear
how 80 cm of colluvium or till could have been deposited on top, unless
the event predated the LIA.
At the eastern end of Tidal Inlet (fig.
3-Pt.
3) we found glacial till up to 5 m thick overlying bedrock on both the
southern and northern sides of the creek, at elevations of less than 30
m. We also examined the northern shore of Tidal Inlet from about the center
of the landslide westward to the braided stream entering the inlet (fig.
3-Pt. 4) and did not find any evidence of wave runup. A
large wave generated by a landslide into Tidal Inlet would likely strip
vegetation up to a certain height on the opposite slope, similar to the
trim lines documented in Lituya Bay (Miller, 1960). Nowhere along the
shores of Tidal Inlet did we find any trim lines or notice trees that showed
evidence of destruction or distortion from wave runup. Based on the lack
of trimlines and wave-related surficial deposits it is unlikely a large
landslide impacted the inlet after it became glacier free in the late 19th century. However,
landslides could have run out onto a glacier occupying the inlet during
the waning stages of the LIA. Signs of such slide deposits would have
vanished into the fjord after the ice melted. In addition, we cannot rule
out pre-LIA landslide-induced waves.
Structure and Discontinuities
The bedrock structure within each of the geologic units in the vicinity
of the Tidal Inlet landslide is moderately uniform. According to Brew (written
commun., 10/02), the Pyramid Peak Formation above the landslide strikes roughly
parallel to Tidal Inlet in an east-west (E-W) direction and dips to the north
at 40-50 degrees (fig. 4). At the base of the landslide near the northern
shore of Tidal Inlet the Tidal Formation strikes into the slope in a NE-SW
direction with a wide variation of dips to the west ranging from 55-60 degrees
(in the field we observed a wider range of dips). The contact between the
Pyramid Peak and Tidal Inlet formations is an unconformity that is obscured
in many places by glacial till and by talus covering the mid- and lower-
parts of the hillside due to landslide movement (fig.
4). During our field
examination of the main scarp of the landslide, strikes were found in the
NW-SE direction, with steep dips in both the south and north directions (not
depicted on fig. 4).
Several faults were identified in the Tidal Inlet area by Rossman (1963)
and Brew (written commun., 10/02). Within the Tidal Inlet region two predominate
sets of faults are prevalent: one set trending in the E-W direction, similar
to the direction of Tidal Inlet; the other set ranging from N-S to northwest-southeast
(NW-SE) (fig. 4). Several additional prominent discontinuities or lineaments
were identified on the northern shore of Tidal Inlet on aerial photographs
and subsequently confirmed in the field. Three of these lineaments (L1,
L2, and L3), depicted in figure 6, are in proximity to or cross the main
scarp or left flank (eastern side) of the landslide. These lineaments ranging
from 500 to 1000 m in length are generally shorter than those mapped by Rossman
(1963) and Brew (written commun., 10/02). Field examination of lineament
L1 revealed evidence of movement that could be associated with either recent
faulting or slope movement. Lineament L1 can be traced at least 1000 m in
an E-W direction, similar in trend to the previously identified set of discontinuities
(Brew, written commun., 10/02) (fig. 4). These lineaments are distinctly
visible on aerial photographs taken in 1948 and subsequent photos. Lineament
L1 has a moderately steep uphill facing (antislope) scarp, with offset similar
to that of a normal fault, ranging from 50 degrees to near vertical, with
from 0.5 to 2.0 m of vertical offset (fig. 7). The E-W trend of the lineament
remains remarkably straight despite topographic changes, indicating a near
vertical dip of this lineament. The steep escarpment lacks any large vegetation
and lacks evidence of severe erosion, such as gullying suggesting a moderately
recent origin. A shallow pit excavated into the escarpment revealed that
displacement offset colluvium at the surface. Lineaments L2 and L3 are nearly
parallel with some bedding trends in the NE-SW direction. Additional field
work is needed to determine whether lineaments L2 and L3 show signs of displacement.
The displacement of the L1 lineament does not align itself with the direction
of movement of the Tidal Inlet landslide; however, the displacement could
be indicative of another kind of slope movement: sackungen, a type of massive
slope movement in mountainous terrain creating a trough parallel to a ridge.
Studies near Mt. Currie, British Columbia of a conspicuous linear vertical
scarp across an alpine ridge have indicated massive slope movement rather
than tectonics caused the scarp (Thompson et al., 1997). Mountain-top gravitational
deformation or sackungen similar to that at Mt. Currie is common in many
other parts of the world (Bovis and Evans, 1996; Varnes et al., 1989). However,
unlike most sakungen, L1 is at midslope rather than near the ridge top. Thus
whether L1 is related to gravitational displacement versus tectonic movement
is unknown.
Seismicity and Faults
Glacier Bay National Park is a region of high seismicity with several major
active faults in the vicinity. The Fairweather fault (FWF) system which merges
to the south with the Queen Charlotte Islands fault system along the western
edge of the park is a major right lateral strike-slip fault that forms part
of the plate boundary between the North American and Pacific Plates along
the coast of southeastern Alaska (fig. 2). This transform boundary has been
the locus of four large magnitude, M>7.0, earthquakes during the 20th century
(Brew et al., 1995). During the 1958 M-7.9 earthquake, a maximum of 3.5
m horizontal and 1.0 m vertical fault displacements were measured (Brew et
al., 1995). The 1958 earthquake triggered a 30 million m3 rockslide
which was responsible for a landslide-induced wave in Lituya Bay, Glacier
Bay National Park (Miller, 1960).
The active portion of the Denali fault is far to the northeast of Glacier
Bay, beyond the area shown in fig. 2. Consequently, significant seismic activity
from the Denali fault affecting Glacier Bay region is unlikely (Brew, written
commun., 2003). North of the Glacier Bay National Park (beyond Fig. 2) where
the Yakutat Block collides with the North American Plate, the FWF undergoes
a transition into a series of thrust faults (Fletcher and Freymueller, 1999). Several
M>8.0 earthquakes have occurred in this region during historic times.
On September 4, and 10, 1899 two earthquakes (Ms= 8.5, 8.4) and
on October 9,1900 (Ms= 8.1) an earthquake occurred along the Fairweather
fault near Yakutat Bay, about 200 km northwest of Tidal Inlet (Plafker and
Thatcher, 1982). No epicenters of historic large earthquakes have been recorded
near Tidal Inlet in Glacier Bay (Brew et al., 1995). However, the proximity
of Tidal Inlet to these major fault systems makes it highly susceptible to
strong shaking.
Historical Landslide-induced Waves
Landslides that rapidly move into bodies of water, e.g. bays, lakes, fjords
and reservoirs, can generate high, rapidly moving destructive waves. Slingerland
and Voight (1979, Table III) summarized numerous worldwide examples of destructive
landslide-induced waves. Southeastern Alaska is particularly susceptible
to landslide-induced waves because of steep topography, high seismicity,
and recent glacial retreat removing slope support. Several Lituya Bay landslides
and the subsequent waves have been intensely studied by researchers (Miller,
1960; Fritz et al., 2001; Mader and Gittings, 2002). From dendrochronologic
analysis of trees and observations of trimlines along the slopes of Lituya
Bay, Miller (1960) was able to identify at least four landslide-generated
waves that had occurred in the bay: July 9, 1958, October, 1936, about 1874,
and 1853-1854. The July 9, 1958 landslide-induced wave with a runup of 524
m on the opposite shore and a 30-m wave passing beyond Lituya Bay is the
largest landslide-generated wave ever documented worldwide. As described
by Miller (1960, p. 53), the 1958 earthquake was strongly felt on a boat
at anchor in Glacier Bay about 100 km east from Lituya Bay. Rocks fell into
the water from steep cliffs nearby, causing small waves of not more than
one meter on the shore; however, no large waves were seen. This location
would likely have been about 20 km south of Tidal Inlet. No observations
were reported of landslide-induced waves in Tidal Inlet.
Tidal Inlet Landslide
Landslide Features
Although it is not known exactly when the landslide on the northern shore
of Tidal Inlet first moved, the current major landslide features first appear
on a portion of a July 28, 1919 photograph of Glacier Bay taken by J.B. Mertie
(photo J.B. Mertie
706 on the USGS Library Photo archives web site, http://libraryphoto.er.usgs.gov/startlib1.htm).
On the far left edge of this photograph the mountains above the northern
shore of Tidal Inlet are visible, including a recent main scarp and toe of
the eastern part of the landslide. An 1892 photograph by H.F. Reid (#346
from the archives of the National Snow and Ice Data Center, Boulder, Colorado) is
a northerly view across Glacier Bay that shows the area above the northern
shore of Tidal Inlet where the main landslide scarp later developed. Some
evidence suggests that prehistoric (pre LIA?) landslide movement had occurred,
but no signs of recent landslide movement are visible on this photograph.
This photographic evidence brackets the period of recent landslide movement
between 1892 and 1919. The recent landslide features show most clearly on
an aerial photograph (fig. 8) taken in 1948. More than 50 years later, although
slightly eroded, the main scarp (figs. 9, 10, and 11) and the other landslide
features still remain distinctly visible. No signs of recent renewed movement,
such as slickensides, appear at any location along the base of the main scarp.
The crown of the main scarp is arcuate, but irregular along its length, with
the highest part of the crown at an elevation of about 700 m (figs.
6, 9). The
main scarp has a slope of 45 degrees and exposes thinly layered bedrock (figs.
10 and 11). This scarp has a fairly uniform range of height, 20-40 m, suggesting
that the body of the landslide detached rigidly. Although small amounts of
snow were still observed on portions of the slopes above the main scarp in
mid-July, no springs were identified along the length of the main scarp suggesting
that the ground water level was generally deeper than the base of the main
scarp.
The average slope angle of the existing landslide mass at Tidal Inlet between
the base of the main scarp and the bottom boundary (toe) of the slide where
the rupture surface is exposed in a bedrock escarpment is about 17 degrees.
Due to rotation of the rock slump the original surface before sliding was
steeper, approximately 32 degrees. Likewise, should this landslide mass
be reactivated, the movement of material beyond the toe of rupture would
rapidly descend because of the steeper slope below the bedrock escarpment. Based on the 1:63,360 scale Mt. Fairweather topographic map,
slope steepness from the approximate landslide center of mass to the edge
of Tidal Inlet ranges from 35 to 40 degrees. This would be the degree of
slope that the landslide would descend into Tidal Inlet once it leaves the
toe near the rupture surface.
Within the main body of the landslide the surface topography
is severely disrupted by many (13?) rotational blocks with prominent back-facing
scarps (figs. 6, 12). In the upper portion of the main body the exposed
portions of these blocks are within glacial till, but further downslope bedrock
can be seen within the blocks. The back-rotated faces of these blocks are
quite steep, ranging several meters in height with slope angles of 35 to
50 degrees. These north-facing backscarps are thinly vegetated in places
suggesting relatively recent movement. The troughs formed by these blocks
tend to collect snow and because of lack of downslope stream runoff, result
in increased infiltration of water into the main body of the landslide. Several
drainage channels through glacial till were found to be truncated at the
crest of the rotational blocks, with the previous originally continuing channels
displaced further downslope. Such disrupted drainage features indicate sudden
rather than slow rotation, which would of course have allowed incision through
the erodible till cover. Fluvial erosion could not keep pace with the upthrusting
of the blocks, which now is leading to water accumulation in the ditches
parallel to the elevation contours. Consequently, the degree of saturation
and ground-water level(s) within the landslide mass remains higher than on
adjacent slopes, which reduces the relative stability of the landslide mass.
Below the escarpment at the toe of the landslide (fig.
3-Pt. 5), two springs
were observed (07/16/02) flowing from the base of the landslide talus with
an estimated rate of about 0.01 m3/s each. These springs had built
up calcareous deposits on talus debris indicating that some groundwater flow
was probably issuing from the limestone of the Pyramid Peak Formation above
the main scarp of the landslide, although limestone is also present in the
Tidal Formation.
The toe of the landslide is exposed as layers of outcropping
bedrock where the rupture surface daylighted at midslope between the shoreline
and the main scarp. Within the region of the toe a thin white layer of limestone
(?) is clearly visible extending across the width of the landslide (fig.
1). This bedrock layer bulges slightly downward near the center of the toe
perhaps indicating slightly greater displacement at the center of the landslide
mass. No recent displacement is evident below this bedrock exposure where
glacial till has eroded gullies extending to the shoreline.
In the center of the main body of the landslide there
is evidence of a secondary landslide movement that has removed surficial
material from some of the rotational blocks on the lower section of the landslide
(fig. 9). The depth of this secondary landslide movement appears to be relatively
shallow, and principally involves glacial till. The secondary movement appears
on the 1919 Mertie photography, so the timing of the secondary movement in
relation to the initial movement of the main body of the landslide is unknown. Cracks
and fissures coincident with this secondary movement, with a maximum lateral
displacement on the order of one meter, extend up through portions of the
rotational blocks within the main body of the landslide.
On the right (west) flank of the landslide, two closely
spaced sets of parallel open fissures were found in surficial soils extending
beyond the termination of the main scarp (solid line), downslope towards
the toe of the landslide (fig. 6). These fissures appeared relatively fresh
within generally weak soils and would not be expected to be preserved for
long periods of time under normal climatic conditions. In addition, revegetation
would be expected to cover these fissures unless movements were recurrent.
Additional field work is needed to determine whether these fissures represent
lateral shear or collapse of surficial materials into piping voids.
Landslide Dimensions
The size of the Tidal Inlet landslide was estimated from field observations
and examination of aerial photographs (fig. 6). The highest point on top
of the main scarp is at an elevation of about 700 m, whereas, the base of
the main scarp is at about 577 m in elevation. The estimated boundaries of
the landslide (fig. 6) show a slide length of surface of rupture (distance
from the base of the main scarp downslope to the center of the toe of the
landslide block), Lr, of about 500 m and a maximum slide width
of surface of rupture, Wr, of about 1230 m, subsequently referred
to as slide length and maximum slide width. The terminology for the definitions
of landslide dimensions and method for calculating an estimated volume are
taken from Cruden and Varnes (1996). A secondary landslide has removed material
from the center of the large landslide feature and deposited it as talus
on the slope below the landslide boundary. These boundaries do not account
for any increased amount of landslide material from the activation of the
hillside region between the east flank and the lineament L1 higher on the
hillside.
The depth or thickness of the landslide is more difficult to estimate. Using
a GPS profile of the main scarp and minor scarps on the main body of the
landslide (fig. 13), the maximum depth to the bottom, along the surface of
rupture for a circular failure was estimated to be about 40 m, whereas an
ellipsoidal shape would result in 20 m depth (perpendicular to the original
ground surface). Although the till exposed in many of the minor scarps is
weak, the bedrock (Tidal Formation) evident in the major escarpment at the
toe of the surface of rupture (and some of the lower minor scarps), indicates
stronger material at depth, suggesting an ellipsoid shaped rupture surface
rather than a deeper circular failure. Given the uncertainty associated
with depth estimates, a value of 30 m is assumed as an approximation of the
maximum depth of the surface of rupture, Dr. Using a geographic
information system (GIS) and correcting for slope angle, the area of the
landslide is approximately 293,000 m2.
The volume of the landslide depends upon its shape. The shape of the Tidal
Inlet landslide with its maximum width coinciding with its lower boundary
(or toe), resembles either a quarter ellipsoid-shaped mass or a block wedge.
For a half ellipsoid-shaped landslide, the volume can be estimated by the
formula (Cruden and Varnes, 1996, p. 42):
VOLls = (1/6) p Dr Wr Lr Eqn.
1
where Dr is the maximum depth of surface rupture, Wr is
the maximum width between the flanks of the landslide, and Lr is
the minimum distance from toe of surface of rupture to crown.
The volume of the Tidal Inlet landslide can be estimated by taking half
the value of volume calculated from Eqn. 1 because the shape of the landslide
with a broad width at its toe only appears to be half the size of a half
ellipsoid.
VOLls = (1/12) p Dr Wr Lr Eqn.
2
Using thickness Dr of 30 m, width Wr of 1230 m, and
length Lr of 510 m, Eqn. 2 yields a volume of approximately 5
million cubic meters.
However, if the renewed movement of the landslide resembles a block wedge
either as a half ellipsoid or as a rectangular block, then the volumes could
be calculated as follows. For a half ellipsoid, the landslide volume from
Eqn. 1 would be approximately 10 million cubic meters. For a rectangular
block with an average width, W, of 700 m, slide length L of 510 m, and maximum
slide thickness, D, of 30 m, the landslide volume according to:
VOLls = D W L Eqn.
3
results in a volume of approximately 10.7 million cubic meters. Thus, the
minimum and maximum likely volumes of potential landslide reactivation, Volmin and
Volmax, range from 5 to 10.7 million cubic meters.
Landslide Classification
Based on the many separate rotational movements within the body of the landslide
and the bedrock materials involved along the sliding surface underlying the
glacial till, the initial landslide would be classified as a rock slump (Varnes,
1978). The shallow secondary movement would be termed a debris slide involving
principally the glacial till.
Landslide Properties
The density of a landslide depends upon the
nature of the soil or bedrock involved in sliding, and once a landslide has
moved, how much the displaced material dilates. Swelling factors of 33 to
67% (Church, 1981; Nicoletti and Sorriso-Valvo, 1991) will decrease the density
of a landslide. No density measurements of the materials involved in the
Tidal Inlet landslide have been made, and therefore we did not attempt to
estimate the amount that potential swelling would have altered landslide
density. A value of 2.6 is considered a reasonable
assumption for the density of the Tidal Inlet landslide based on the specific
gravity of shale (2.4-2.8) or limestone (2.3-2.8).
The level of groundwater within the landslide mass and the northern slope
of Tidal Inlet is uncertain. The movement and disrupted slope surface of
the landslide have created topography favorable to capture of precipitation
and infiltration into the ground. In July 2002, snow was still found in depressions
created by rotational movement along minor escarpments, although most other
parts of the hillside were devoid of any snow below elevations of about 1000
m. No springs were observed within the scarps, or elsewhere within the landslide
suggesting that infiltration is recharging the soil and bedrock without totally
filling the voids. Surface gullies within the till suggest that during intense
storms, surface runoff is prevalent. Consequently, water levels within the
landslide mass will probably remain relatively low throughout most of the
year, with the exception of periods of peak runoff associated with rapid
snowmelt or intense storms.
State of Landslide Activity
History of Landslide Movement
We sampled three black cottonwood trees (Populus trichocarpa) rooted
in back-slope trenches between slide blocks. These trees grow at an elevation
of approximately 550 m. Two of the trees have fallen over and their trunks
are now horizontal with vertical branches growing from them. It was unclear
whether the trees were knocked over by individual falling rocks from the
scarp above or whether the ground beneath the tree was rotated and the branches
resprouted vertically. The former is expected because rocks littered the
surrounding area and actually impinged on one of the trees. We did observe
rocks of substantial size, capable of damaging trees, fall from the upper
slopes during our field reconnaissance. The oldest tree gave a germination
age of AD 1952 with compression wood starting at about AD 1973. The second
tree germinated at about AD 1962 with compression wood starting about AD
1977. Compression wood forms when trees try to compensate for lean and therefore
may mark the time when the trees were impacted by rocks. The third tree
was the largest in the area and stood upright; it had an estimated germination
age of AD 1952. This dendrochronologic data suggests recurrent rock-fall
activity from the steep scarp above. In addition, the presence of a vertical
tree indicates that renewed ground rotation has not occurred since germination
in AD 1952.
GPS Detection of landslide movement
Four monuments were installed on the Tidal Inlet landslide
to assess landslide movement (fig. 13). These points were surveyed with
Trimble 4000 SI and SSI, geodetic-quality, GPS receivers and dual-frequency
(L1/L2) antennas. GPS data were collected for durations of one hour
and collection intervals of 30 seconds at each monument. Two base stations
were set up over permanent benchmarks (CINCO and MART) along the shores of
the west arm of Glacier Bay, and continuously collected data at intervals
of 30 seconds for a period of about 7 days. These permanent benchmarks are
being used in a project for monitoring crustal motion in the Glacier Bay
region (Larsen et al., 2001), and their locations are known within a horizontal
accuracy of 7 mm and a vertical accuracy of 13 mm. Very accurate baseline
solutions between CINCO and each of the landslide monuments were calculated,
yielding accurate relative coordinates for each of the landslide monuments.
Subsequent reoccupations of the base stations and landslide monuments in
the summer of 2003 or thereafter are intended to measure landslide movement
if it occurs.
The accuracy of GPS-derived coordinates of monuments installed
on the landslide depends on many factors which are equipment, site, and time
dependent. These factors include baseline length, occupation time, number
and constellation of satellites, ionospheric interference, etc., and are
inherent to the GPS system, equipment used, and processing software. The
data from the concurrent GPS occupations of the two permanent benchmarks
were used to estimate the errors due to these factors during the surveying
of the landslide monuments. In addition, there are small errors associated
with the setup of GPS equipment (the stability of the setup throughout the
duration of the occupation, and the ability to set up the equipment in precisely
the exact same location at a later time). The stability of the monuments
between successive occupations is also a factor; any instability such as
displacement due to frost heaving can lead to error (or movement that could
falsely be attributed to the landslide). The estimation for this error should
be revised after it is assessed at reoccupation. Each of these components
and the resulting total accuracy of the GPS data are summarized in Table
1.
|
| Horizontal
Best Case
(cm) |
Vertical
Best Case
(cm)
|
Horizontal
Worst Case
(cm)
|
Vertical
Worst Case
(cm)
|
|
Inherent GPS Errors
(due to equipment,
number of satellites, etc.)
|
1.6
|
3.2
|
1.9
|
8.9
|
|
Equipment Setup Errors
|
0.2
|
0.3
|
0.4
|
0.6
|
|
Monument Stability Error
|
1.0+
|
1.0+
|
2.0+
|
2.0+
|
|
Total GPS Accuracy
|
2.8+
|
4.5+
|
4.3+
|
11.5+
|
Table 1. Assessment of accuracy of GPS data for Tidal
Inlet landslide monuments.
GPS solutions for the landslide monuments showed at least
4 satellites in common with base station CINCO at all times, and the variance
ratios of the solutions ranged from 11.7 to 106.8. The variance ratio is
a measure of the confidence in the GPS solution; generally a minimum value
of 1.5 is expected; the larger the number the better, with 11.7 and higher
being very good solutions. Therefore the accuracy of these surveys is closer
to the "best case" columns in Table 1.
The period of time necessary for determining the rate
of landslide movement not only has to do with the accuracy of the GPS measurements,
but depends upon the relative rate of movement. Landslide movement is characterized
as extremely slow if moving at a typical rate of less than 1.6 cm/yr (Cruden
and Varnes, 1996). Using the range of GPS total accuracy for best to worst
case (2.8-4.3 cm), we will not be able to detect extremely slow movement
over an interval of only one year. However, we should be able to determine
rates of landslide movement between about 5.0 cm/yr and 16 cm/yr, which would
fit the category of "very slow" velocity class (1.6-160 cm/yr).
If after the first year, the rate of movement is below detection limits of
GPS accuracy, then another set of GPS measurements 3-5 years later would
be sufficient to determine if the landslide is moving "extremely slowly" (less
than 1.6 cm/yr).
Glacial Retreat and Landslide Stability
Glacial retreat is widely recognized as a factor in increased landslide
activity in glaciated regions due to debuttressing of bedrock slopes and
deposition of glacial drift in unstable areas (Bovis, 1990; Evans and Clague,
1994; Abele, 1997; Berrisford and Mathews, 1997; Haeberli et al., 1997; and
Ryder, 1998). In this study we hypothesize that glacial debuttressing is
a causative factor in the recent movement of the Tidal Inlet landslide. A
few topographic features on the northern shore of Tidal Inlet suggest that
a landslide possibly existed prior to the recent (1892-1919) movement (fig.
6); however, the age and full extent of these features is not discernable.
Previous landslide movement could also have been affected by the process
of glacial retreat (fig. 14).
Glacial scour had steepened the slopes during the LIA; but did not result
in instability because the glacier provided lateral support to the rock mass
(fig. 14a). As the glacier waned, the support by glacier ice decreased until
the ice completely vanished from Tidal Inlet. The limestone and turbidite
rock formations comprising this terrain have been heavily fractured and are
friable. The poor strength characteristics of the bedrock and the decrease
of lateral support by the removal of ice may have led to dilation and progressive
weakening of the rock mass. Simultaneously, isostatic rebound of several
(2.5) centimeters per year in the Glacier Bay region (Motyka, 2003) may have
led to further fracturing and destabilization.
LIA glacial drift mantles the back slopes of the rotated blocks of the Tidal
Inlet landslide up to an elevation of about 600 m. Downhill facing scarps,
however, are drift free indicating that the landslide blocks rotated after
glacial retreat (fig. 14b). This observation leads to the question of why
the rock slump did not transform into a rock avalanche. Perhaps the recent
movement did result in some material breaking off at the toe with the loose
debris proceeding to the shoreline, but movement stopped before too much
of the material dislodged. Bathymetric data at the base of the slope does
not show any distinct deposits below the Tidal Inlet landslide.
The occurrence of several large earthquakes near Yakutat Bay in 1899-1900
presents the possibility that seismic shaking triggered the Tidal Inlet landslide
in the period of 1892 to 1919. According to historic correlations between
the distances of landslides from earthquake epicenters as a function of earthquake
magnitude, coherent landslides, such as rock slumps, have been documented
at maximum distances up to about 300 km from the epicenter of M 8 earthquakes
(Keefer, 1984). The three Yakutat Bay earthquakes of 1899-1900 with magnitudes
ranging from 8.1- 8.5 (Plafker and Thatcher, 1982) had the possibility of
triggering a landslide at Tidal Inlet, at a distance of about 200 km from
the epicentral region of Yakutat Bay.
With respect to future movement on the slopes above Tidal Inlet, two scenarios
are conceivable. The first scenario suggests incremental failure of rotational
blocks or portions similar to the secondary landslide movement recognized
within the lower center portion of the landslide mass. High frequency – low
magnitude failure events could send some individual larger rock blocks into
Tidal Inlet. In this case, the hazard would only affect people on the lower
slopes of the north shore of Tidal Inlet or small vessels and kayaks in close
proximity to the lower slopes. The probability of the latter is unknown
but relatively low. The second scenario would involve a complete failure
of the landslide mass as a consequence of exceeding a strength threshold
triggered by strong seismicity, large volume rainfall and/or high rainfall
intensity possibly paired with rapid snowmelt. In this case, it is likely
that the rock mass will slide for a short distance before transforming into
a chaotic mass of rock that would entrain additional loose material on its
downslope path before impacting Tidal Inlet. This later scenario, of course,
bears much higher risk to vessels in Tidal Inlet and the adjacent western
arm of Glacier Bay because of larger wave heights, wave velocities and wave
runups. This second high-risk scenario is modeled in the following section.
Potential Landslide-induced Waves
A number of different methods have been used to evaluate the potential for
landslide-induced waves based on studies of previous historical events. Several
empirical and numerical models have been proposed to analyze waves generated
by landslides using deductive or inductive approaches (Slingerland and Voight,
1979). More recently, interactions between landslides and bodies of water
have been incorporated in a hydrodynamic model using force terms (Kofoed-Hansen
et al., 2001). We examine the results of modeling waves in Tidal Inlet using
previously developed models to derive a range of potential wave height, runup,
and speed. However, we recognize that for more accurate estimation of wave
characteristics in Tidal Inlet and Glacier Bay, it is necessary to develop
more sophisticated models considering the detailed bathymetry in Tidal Inlet
and three-dimensional wave propagation. The following section focuses on
empirical models of landslide-generated waves.
Landslide Velocity
Our calculations of landslide velocity, wave height, wave
velocity, and wave runup are based upon the measured parameters for the Tidal
Inlet landslide listed in Table 2. Values for landslide velocity in the following
section are based upon the maximum estimated landslide volume. We have used
several different briefly described methods and list the equations with their
original terminology and symbols. The results of these calculations are
summarized in Table 3.
One of the first physical models used to simulate landslide-generated
waves was created by Noda (1970) using the following assumptions:
§ The
landslide volume is small compared to the water volume (VL << VW)
§ The
landslide is rectangular
§ The
velocity-time history of the landslide movement is known
§ The
fluid is incompressible and its motion non-rotational, and linear equations
of surface gravity waves are applicable.
§ The
horizontal fluid velocity under the landslide is not a function of z, the
direction of the box drop.
§ Impact
phenomena can be ignored.
According to Slingerland and Voight (1979), landslide
velocity can then be modeled as:
vs = v0 + [2gs(sinb – tanjs cosb)]1/2 Eqn.
4
where:
vs = slide velocity
computed as a mass sliding on a plane
v0 = initial
slide velocity (assumed to be 0 ms-1)
g = gravitational constant
(9.81 ms-2)
s = landslide travel
distance (450 m) from the toe of the landslide mass to the water’s edge
b = slope angle in
degrees (40°)
js = angle
of dynamic sliding friction including pore pressure and roughness effects. Value
of tanjs is
assumed to be 0.25 + 0.15 based on Slingerland and Voight (1979).
According to this formula, the impact velocity is 63 m/s or
230 km/h.
Wave Height
According to Noda (1970), the wave height can be modeled as:
h = F l Eqn.
5
where:
h = wave height (m)
F = Froude Number = v/(gd)0.5
v = landslide velocity (63m/s)
g = acceleration of gravity (9.81 m/s2)
d = water depth (200 m)
l= maximum thickness of
landslide mass (30 m)
Using a velocity of 63 m/s, equation 5 yields a potential wave height in
Tidal Inlet of 43 m.
Slingerland and Voight (1979) used data from a study on
Mica Reservoir in British Columbia to refine a previously developed model
and developed the following regression equation for wave height (first wave):
log(hmax/d)
= a + b log (KE) Eqn.
6
where:
a = -1.25
b = 0.71
KE = 0.5 (lhw/d3) (rs/r) (vs2/gd) Eqn.
7
where:
KE (1<KE<100) is the dimensionless
kinetic energy,
l = landslide length (500 m)
h = landslide thickness (30 m)
w = average landslide width (700 m)
d = water depth (200 m)
rs=
landslide density (2.6 g/cm3)
r =
water density (1.0 g/cm3)
vs = slide velocity (63 m/s)
Substituting the above values into Eqn. 6 yields a KE
value of 3.6, which in turn is substituted into Eqn. 6 to yield a wave height
of 27 m.
Huber and Hager (1997)
attempted a forecasting model for impulse waves into reservoirs. The input
parameters for their model were:
§ slope
angle at the impact site
§ plunging
slide volume Vs over a finite shore distance b, equal to the
width of the slide at impact with water
§ slide
velocity and direction at the impact site
§ water
depth d near the impact site
§ water
body bathymetry
§ distance
x from the impact site to the location under consideration
The underlying assumptions
of the analysis were that:
§ the
ratio of wave height H to water depth d is smaller than the wave breaking
limit ratio of 0.78
§ the
relative wave heights are calculated for distances of 5<x/d<100 for
2-D flume tests and 5<x/d< 30 for 3-D tests in the wave pool
§ slide
velocity vs is larger than about 50% of the wave velocity
or celerity, C
§ slide
angle a is between 28° and 60°. For a < 25° friction inhibits the sliding of material
§ slide
mass is a dense flow of debris (rather than a dense rock mass or fragmental
rockfall)
According to Huber
and Hager (1997), wave height H can be calculated as:
H = 0.88 sina (rs/r)0.25 (Vs/b)0.5 (d/x)0.25 Eqn.
8
Using values previously
stated for a, rs, r, d, landslide volume Vs of 10,500,000 m3, a distance
x of 350 m to the middle of Tidal Inlet, and a finite shore distance b
of impact along the shore equal to the average width of the landslide of
700 m, Eqn. 8 yields a wave height H of 76 m. The wave height, H, is mainly
influenced by the impact angle a, and secondly by the specific slide volume (Vs /b).
All other factors in Eqn. 8 are of minor importance.
Wave Velocity
Landslide generated
waves propagate in semicircles over an open water surface. H, the wave
height, varies with propagation direction and travel distance. The largest
waves travel in the direction of maximum momentum, while lateral waves
traveling along the shore are significantly smaller. The following formula
was applied by Wiegel (1964) to determine wave celerity (or velocity) C:
C= (g(d + H)) 0.5 Eqn.
9
A water depth, d,
of 200 m in Tidal Inlet and an average wave height H of 49 m (Table 3),
result in a wave velocity C of 49 m/s.
According to the formulation
of Huber and Hager (1997):
C= (g*d) 0.5 Eqn.
10
A water depth, d,
of 200 m results in a wave velocity of 44 m/s.
Wave Runup
According to Chow (1960), wave runup on the slope of the
opposite shore of Tidal Inlet can be calculated according to:
vs2 = 2gh, or h = vs2/2g ≈ 200 m Eqn.
11
According to Eqn.10, a landslide velocity vs of
63 m/s results in a wave runup h of ~200 m. Accordingly, any vessel in Tidal
Inlet which is in the impact area of the landslide, could be expected to
be displaced by as much as 200 m.
Huber and Hager (1997) also provided a calculation for
wave runup based on work by Mueller (1995) and Huber (1997), as follows:
R/d = 1.25 (p/2b)0.2 (H/d)1.25 (H/L)-0.15 Eqn.
12
Where R is the wave runup height over the level of the
water body, b is the angle of steepness of the opposite slope (60°), H is the approaching wave height (76 m using Huber and Hager’s Eqn.
8 for wave height), L is the wave length (5 times the water depth d) and
d is the water depth (200 m). Using these values, Eqn.11 yields a wave runup
of 123 m on the shore opposite the landslide.
According to Synolakis
(1987), solitary wave runup can be calculated as:
R/d = 2.831 (cotb)0.5*(H/d)1.25 Equ. 13
Using 60° for b, and 76 m for H, and 200 m for d, a potential runup
of approximately 131 m is calculated for the slope opposite the Tidal Inlet
landslide.
Hall and Watts (1953) calculated solitary wave runup using
the following equation
R/d = 3.1 (H/d)1.15 Eqn. 14
With wave height H = 76 m, and
water depth d = 200 m, wave runup is calculated as approximately 208 m.
If Eqn.8 and Eqn.12 are
applied to determine the wave height and wave runup at Blue Mouse Cove (fig.
2), a distance, x, of about 7.25 km across Glacier Bay from the landslide
impact into Tidal Inlet, a wave height of 40 m could be expected, with a
wave runup varying between 40 and 67 m, depending upon the depth of water
with Blue Mouse Cove at specific locations. This estimation of wave height
and runup indicates that even at the other side of the western arm of Glacier
Bay, people on land near Blue Mouse Cove and in cruise ships are potentially
at risk.
Table 2. Tidal Inlet landslide characteristics and other
values used in calculations.
| |
|
| |
Elevation of top of scarp
|
700 m
|
|
| |
Elevation of base of scarp
|
600 m
|
|
| |
Slide Length (base of scarp to toe)
|
500 m
|
|
| |
Slide Width (Average)
|
700 m
|
|
| |
Slide Width (Maximum)
|
1200 m
|
|
| |
Slide Thickness (Average)
|
30 m
|
|
| |
Landslide Travel Distance to shore of Tidal Inlet
|
450 m
|
|
| |
Slide Density
|
2.6 g/cm3
|
|
| |
Maximum Slope Angle of Landslide to Tidal Inlet
|
40°
|
|
| |
Average Slope Angle of Opposite Shore
|
60°
|
|
| |
Landslide Area
|
293,000 m2
|
|
| |
Landslide Volume (Max) Block Shape
|
10,700,000
m3
|
|
| |
Landslide Volume (Min) Ellipsoidal Shape
|
4,928,000 m3
|
|
| |
Maximum Water Depth (Tidal Inlet)
|
200 m
|
|
|
|
|
|
|
Table 3. Tidal Inlet values of landslide velocity, wave
height, wave runup on opposite shore, and wave speed based on range of volumes
of a block-shaped landslide with minimum and maximum volumes of 5.25 and
10.5 million m3, respectively, calculated from the different formulas
cited.
|
Calculated Property and
Calculation Method Reference
|
Using Minimum
Block Slide Volume
|
Using Maximum
Block Slide Volume
|
|
Landslide Velocity
|
|
|
|
Noda (1970)
|
63 m/s
|
63 m/s
|
|
Wave Height
|
|
|
|
Slingerland and Voight (1979)
|
17 m
|
27 m
|
|
Noda (1970)
|
43 m
|
43 m
|
|
Huber and Hager (1997) (mid-inlet)
|
54 m
|
76 m
|
|
Average Wave Height
|
38
m
|
49
m
|
|
Wave Runup on Opposite Slope
|
|
|
|
Chow (1960)
|
203 m
|
203 m
|
|
Huber and Hager (1997)
|
65 m
|
123 m
|
|
Synolakis (1987)
|
68 m
|
131 m
|
|
Hall and Watts (1953)
|
113 m
|
208 m
|
|
Average Wave Runup
|
112
m
|
166
m
|
|
Wave Velocity
|
|
|
|
Weigel (1964)
|
48 m/s
|
49 m/s
|
|
Huber and Hague (1997)
|
44 m/s
|
44 m/s
|
Conclusions
- Glacier ice in Tidal Inlet became ice-free by AD 1890. The removal of
ice decreased lateral support for the hillside. Although a previous landslide
could have existed prior to the end of the LIA, a landslide above the northern
shore of Tidal Inlet recently moved sometime between 1892 and 1919 as determined
from close examination of photographs. Several large earthquakes during
1899-1900 in the Yakutat Bay region could have triggered the landslide
movement in Tidal Inlet. The general lack of revegetation of back scarps
and distinctness of the landslide features—main and secondary scarps, including
rotational blocks, supports the assumption of recent movement of the landslide
mass.
- The majority of the Tidal Inlet landslide mass appears to be dormant. No
evidence of ongoing movement was found along the base of the main scarp.
A shallow secondary failure in the central portion of the landslide mass
could have occurred at a different time than the main landslide within
the period of 1892-1919. Along the right flank (western side) of the landslide
mass, two sets of linear cracks within the soil mass indicate the possibility
of recent slow movement or settlement of the landslide mass. GPS monitoring
at several points on the landslide mass over a period of the next several
years should determine whether the landslide is creeping slowly or is dormant.
This determination is critical because the potential destabilization and
triggering of more rapid landslide movement by earthquakes or other triggers
is affected by the present stability.
- The estimated volume of the Tidal Inlet landslide, ranging from 5 to
10 million m3, provides a range of values for calculating wave
height, runup and velocity. A number of empirical methods are used to
calculate wave height resulting in a maximum of 76 m and wave runups on
the opposite slope up to 200 m assuming the maximum landslide volume impacting
Tidal Inlet. Estimates of wave speed ranged from 45-50 m/s. Although these
values are considerably less than those experienced during the 1958 landslide
in Lituya Bay, the consequence to vessels or persons in Tidal Inlet and
the adjacent western arm of Glacier Bay would be very high. More detailed
three-dimensional wave modeling is needed to assess the potential wave
height and velocity that would travel beyond Tidal Inlet into the western
arm of Glacier Bay taking into account refraction and reflection of waves.
In comparison to Lituya Bay, significantly higher risk exists at Glacier
Bay due to the high frequency of cruise ships traveling within a few kilometers
of the landslide site (fig. 15).
Acknowledgements
Financial support was provided by USGS; NPS; Alaska Division of Geological & Geophysical
Surveys; and the Geophysical Institute, University of Alaska. This investigation
benefited greatly from the assistance of many individuals. Mary Kralovec
and Lewis Sharman, of the NPS in Glacier Bay National Park kindly assisted
in contractual and logistical arrangements for the field work. The NPS provided
use of the NPS research vessel, Nunatak, for lodging and access to sites
around Tidal Inlet. The help of Ken Grant and Joe Tibles, captain and assistant
on the Nunatak, ensured the success of the field investigations. Bill
Eichenlaub of NPS provided digital imagery that aided greatly in field
mapping. Matthias and Ernst Jakob, both volunteered their time in this investigation.
In addition to the authors, several other scientists also contributed to
this investigation including David Brew (USGS) who has conducted geologic
mapping in coastal Alaska and Eric Geist (USGS) who specializes in landslide-induced
wave modeling. Allen Crider (USGS) provided aid with preparing many of the
graphics in this report. Ben Morgan and Bob Fleming of the USGS reviewed
early versions of the report.
References
Abele, G., 1997, Influence of glacier and climatic
variation on rockslide activity in the Alps. in Matthews, J.A., Brunsden,
D., Frenzel, B., Gläser
B., and Weiß, M.M., eds., Rapid Mass Movement as a Source of Climatic
Evidence for Holocene. Gustav Fisher Verlag, Stuttgart, Germany, p. 1-6.
Arendt, A., Echelmeyer, K., Harrison, W.D., Lingle, C., Valentine, V., 2002,
Rapid wastage of Alaska glaciers and their contribution to rising sea level:
Science, v.. 297, n. 5580, p. 382-386.
Berrisford, M.S. and Matthews, J.A., 1997. Phases of
enhanced rapid mass movement and climatic variation during the Holocene:
a synthesis in Matthews,
J.A., Brunsden, D., Frenzel, B., Gläser, B., and Weiß, M.M., eds.,
Rapid Mass Movement as a Source of Climatic Evidence for Holocene. Gustav
Fisher Verlag, Stuttgart, Germany, p. 409-440.
Bovis, M.J., 1990, Rock-slope deformation at Affliction Creek, southern
Coast Mountains, British Columbia: Canadian Journal of Earth Sciences, v.
27, p. 243-254.
Bovis, M.J., and Evans, S.G., 1996, Extensive deformations of rock slopes
in southern Coast Mountains, southwest British Columbia, Canada: Engineering
Geology, v. 44, p. 163-182.
Brew, D.A., Horner, R.B., and Barnes, D.F., 1995, Bedrock-geologic and geophysical
research in Glacier Bay National Park and Preserve: Unique opportunities
of local to global significance: Proceedings of the Third Glacier Bay Science
Symposium, 1993, in Engstrom, D.R., ed., National Park Service, Anchorage,
Alaska, p. 5-14.
Brew, D.A. 200_, Reconnaissance bedrock geologic map of Glacier Bay National
Park, southeastern Alaska: U.S. Geological Survey Scientific Investigation
Map I-____, 1:125,000 scale, 1 sheet, __ p. pamphlet. (written commun., 10/02).
Chow, V.T., 1960, Open channel hydraulics, McGraw-Hill, New
York, NY., 680 p.
Church, H.K., 1981, Excavation Handbook, McGraw-Hill, New York, N.Y., 1024
p.
Cruden, D.M., and Varnes, D.J., 1996, Landslide types and processes, Chapter
3 in Landslides: Investigations and Mitigation, Turner, A.K., and Schuster,
R.L. eds., Transportation Research Board, Special Report 247, p. 36-75.
EBA Engineering Inc., 1997, Proposal for preliminary study and risk assessment
of Tidal Inlet landslide, Glacier Bay National Park, Alaska: February, 1997,
EBA Proposal No. 0806-97-B7381.
Evans, S.G. and Clague J.J., 1994, Recent climatic change and catastrophic
geomorphic processes in mountain environments: Geomorphology, v. 10, p. 107-128.
Fastie, C.L., 1995, Causes and ecosystem consequences of multiple pathways
of primary succession at Glacier Bay, Alaska: Ecology, v. 76, p. 1899-1916.
Fletcher, H.J., and Freymueller, J.T., 1999, New GPS constraints on the
motion of the Yakutat Block: Geophysical Research Letters v. 26, n. 19, p.
3029-3032.
Fritz, H.M., Hager, W.H., and Minor, H.E., 2001, Lituya Bay case: Rockslide
impact and wave run-up: Science of Tsunami Hazards, v. 19, n. 1, p. 3-22.
Goodwin, R.G., 1988, Holocene glaciolacustrine sedimentation in Muir Inlet
and ice advance in Glacier Bay, Alaska, U.S.A.: Arctic and Alpine Research,
v. 20, p. 55-69.
Haeberli, W., Wegmann, M., and Vonder Muhll, D.,1997, Slope stability problems
related to glacier shrinkage and permafrost degradation in the Alps: Ecologae
Geologicae Helvetiae, v. 90, n. 3, p. 407-414.
Hall, J.V. and Watts, G.M., 1953, Laboratory investigation of the vertical
rise of solitary waves on impermeable slopes, Beach Erosion Board, Corps
Engineers, Technical Memo No. 33, U.S. Department of the Army, Washington,
D.C..
Heusser, C.J., 1960, Late-Pleistocene Environments of North Pacific North
America: American Geographical Society, Special Publication No.35, p. 308.
Hooge, P.N., Hooge, E.R., Dick, C.A., Solomon, E.K., 2000, Glacier Bay Oceanography
and the oceanographic analyst GIS extension: CD-ROM Set, U.S. Geological
Survey, Alaska
Huber, A., 1997, Quantifying impulse wave effects in reservoirs: 19 ICOLD
Congress, Florence, Q. 74, R. 35.
Huber, A. and Hager, W.H., 1997, Forecasting impulse
waves in reservoirs: Commission Internationale des Grands Barrages, Dix-neuvième Congrès
des Grands Barrages, Florence, 1997, p. 993-1005.
Keefer, D.K., 1984, Landslides caused by earthquakes: Geological Society
of America Bulletin, v. 95, p. 406-421.
Kofoed-Hansen, H.; Gimenez, G.E., and Kronborg, P.,
2001, Modeling of landslide-generated waves in MIKE21: Proceedings 4th
DHI Software Conference, Helsingør,
Denmark, p.1-21.
Larsen, C.F., Motyka, R.J., Freymueller, J.T., and Echelmeyer, K.A., 2001,
New GPS constraints on crustal deformation along the Fairweather Fault and
Implications for motion of the Yakutat Block, Southern Alaska: Eos Trans.
AGU, v. 82, Fall Meet. Suppl., Abstract G41A-0197.
Larsen, C.F, Freymueller, J.T., and Echelmeyer, K.A, and Motyka, R.J., 2002,
Tide gauge records of uplift along the northern Pacific-North American plate
boundary, 1937 to 2001: Journal of Geophysical Research, In Press.
Mader, C.L., and Gittings, M.L., 2002, Modeling the 1958 Lituya Bay mega-tsunami,
II: Science of Tsunami Hazards, v. 20, n. 5, p. 241-245.
Mann, D.H., 1986, Wisconsin and Holocene glaciation of southeast Alaska,
in Hamilton, T.D., Reed, K.M., and Thorson, R.M., eds., Glaciation in Alaska--the
geologic record: Anchorage, Alaska Geological Society, p. 237-262.
Miller, D.J., 1960, Giant waves in Lituya Bay, Alaska: U.S. Geological Survey
Professional Paper 354C, p. 51-83.
Miller, R.D., 1975, Surficial geologic map of the Juneau urban area and
vicinity, Alaska: U.S. Geological Survey Miscellaneous Investigations Series
Map I-885, 1:48,000.
Molenaar, D., 1990, Glacier Bay and Juneau Icefield Region and the Glacierized
Ranges of Alaska-Northwestern Canada: Pictorial Landform Map. Molenaar Landform
Maps.
Motyka, R.J., 2003, Little Ice Age subsidence and post Little
Ice Age uplift at Juneau Alaska, inferred from dendrochronology and geomorphology:
Quaternary Research, v. 59, n. 3, pp. 300-309.
Motyka, R.J., and Beget, J.E., 1996, Taku Glacier, southeast Alaska, U.S.A.:
Late Holocene history of a tidewater glacier: Arctic and Alpine Research,
v. 28, p. 42-51.
Motyka, R.J., O’Neel, S., Connor, C.L., and Echelmeyer, K.A., 2002, 20th
century thinning of Mendenhall Glacier, Alaska, and its relationship to climate,
lake calving, and glacier run-off: Global and Planetary Change, v. 35, p.
93-112.
Mueller, D.R., 1995, Auflaufen und Ueberschwappen von Impulswellen an Talsperren.
Mitteilung 137: Laboratory of Hydraulics, Hydrology and Glaciology, Swiss
Federal Institute of Technology, Zurich.
Nicoletti, P.G., and M. Sorriso-Valvo, 1991, Geomorphic controls of the
shape and mobility of rock avalanches: Bulletin of the Geological Society
of America, v. 103, n. 10, p. 1365-1373.
Noda, E., 1970, Water waves generated by landslides: Proceedings of the
American Society of Civil Engineers. Journal Waterways Harbors Div. v. 96,
n.4, p. 835-855.
Plafker, George, and Thatcher, Wayne, 1982, Geological and geophysical evaluation
of the mechanisms of the great 1899-1900 Yakutat Bay, Alaska, earthquakes
[abs.]: Program and Abstracts, AGU Conference on fault behavior and the earthquake
generating process, Snowbird, Utah, Oct. 11-15, 1982.
Post, A., and Motyka, R. J., 1995, Taku and LeConte Glaciers, Alaska: calving
speed control of late Holocene asynchronous advances and retreats: in Nelson,
F. E. ed., Glaciers and Late Quaternary Environments of Alaska: I, Essays
in Honor of William O. Field. Physical Geography, v. 16, p. 59-82.
Reid, H. F., 1896, Glacier Bay and its glaciers: U.S. Geological Survey
16th Annual Report, Part 1, p. 421-461.
Rossman, D.L., 1963, Geology of the eastern part of the Mount Fairweather
quadrangle--Glacier Bay, Alaska: U.S. Geological Survey Bulletin 1121-K,
p. K1-K57.
Ryder, J.M., 1998, Geomorphological processes in the alpine areas of Canada:
the effects of climate change and their impacts on human activities: Geological
Survey of Canada Bulletin, v. 524, Vancouver, BC., 44 pp.
Slingerland, R. L. and Voight, B., 1979, Occurrences, properties, and predictive
models of landslide-generated water waves. In: Developments in Geotechnical
Engineering 14B: Rockslides and Avalanches, 2, Engineering Sites. Voight,
B., ed., Elsevier Scientific Publishing Company, p. 317-397.
Synolakis, C.E., 1987, The run-up of solitary waves: Journal of Fluid Mechanics,
v. 185, p. 523-545.
Thompson, S.C., Clague, J.J., and Evans, S.G., 1997,
Holocene activity of the Mt. Currie scarp, Coast Mountains, British Columbia,
and implications
for its origin: Environmental & Engineering Geoscience, v. III, n. 3,
p. 329-348.
Varnes, D.J., 1978, Slope movement types and processes: in Schuster, R.L.,
and Krizek, R.J., eds., Landslides-Analysis and Control: Transportation Research
Board Special Report 176, National Academy of Sciences, Washington, D.C.,
p. 11-33.
Varnes, D.J., Radbruch-Hall, D.H., and Savage, W.Z., 1989, Topographic and
structural conditions in areas of gravitational spreading of ridges in the
western United States: U.S. Geological Survey Professional Paper 1496, 28p.
Wiegel, R.L., 1964, Oceanographical Engineering, Prentice-Hall, Englewood
Cliffs, New Jersey, 532 p.
List of Figures
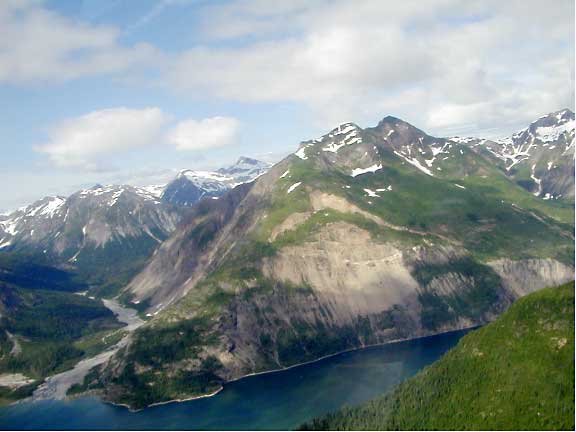
Figure. 1
Detached landslide mass perched above the northern shore of Tidal Inlet,
Glacier Bay National Park,
Alaska.
Peak at top right edge of photo is about 1130 m high. In the lower left,
the distance across Tidal Inlet is about 800 m. Photograph taken on July
12, 2002.
Figure. 2. A) Location map of Glacier Bay National
Park, Alaska and B) map showing the locations of Tidal Inlet and Blue Mouse
Cove along the western arm of Glacier Bay, and Lituya Bay along the Pacific
coast. Active faults systems of Fairweather-Queen Charlotte Islands and
Transition (from Brew et al., 1995), and extent of glacier during Little
Ice Age (dashed line) and approximate dates and reported locations of glacial
retreat in 1794 near Icy Strait and in 1879 in the northern part of the western
arm of Glacier Bay.
Figure 3. A) Topographic map of Tidal Inlet,
Glacier Bay National Park from USGS Mt. Fairweather (D-2) topographic map
(scale 1:63,600 with contour interval of 100 feet). Outline of Tidal Inlet
landslide shown in red. Points 1, 2, 3, and 4 referred to in text are shown
as circled numbers in red. Simplified bathymetry from Hooge et al., (2000). B) Profile A-A’ across Tidal Inlet. Approximate location of cross section
of recent Tidal Inlet landslide shown as dashed red line.
Figure 4. Geologic map
of northern portion of Tidal Inlet (modified from Brew, written commun.,
2002). Boundary of
Tidal Inlet landslide outlined in red. Geologic units shown are Qs (Surficial
Deposits)
Kmn (Migmatite in Geikie and Muir Provinces), DSrt (Undivided Rendu and
Tidal Formation Rocks), DSp (Pyramid Peak Limestone), and Stg (Tidal Formation).
Map contains a contour interval of 100-ft.
Figure 5. Deeply eroded LIA glacial till below
the left (east) flank and toe of the recent Tidal Inlet landslide. Distance
between small ridge tops
is about 15 m. View southeast towards Tidal Inlet.
Figure 6. Vertical aerial photograph (1996)
showing approximate boundaries of the Tidal Inlet landslide mass, excluding
scarp areas. Main scarp, minor scarp, and toe identify most recent landslide
features. Extension of dashed line along eastern and western flanks indicates
possible boundary of previous pre-LIA landslide. The dashed line of the toe
indicates the maximum width of the recent landslide, approximately 1230 m.
The maximum length from the base of the center of the main scarp down to
the toe (perpendicular to width) is approximately 500 m. Lineaments (LI,
L2, and L3) are in proximity to the main scarp and left (east) flank of the
Tidal Inlet landslide.
Figure 7. View looking east along lineament
L1 with its steep, backfacing escarpment. The general downslope profile can
be seen from left to right along the horizon.
Figure 8. Portion of aerial photograph showing
Tidal Inlet and eastern side of west arm Glacier Bay taken July 6, 1948.
Note talus (bright light color) below recent landslide mass above northern
shore (upper left corner) extending from landslide toe to shore of Tidal
Inlet below central portion of landslide. Photograph taken by US Navy at
1:40,000-scale.
Figure 9. Main (upper) and minor (lower) scarps of recent Tidal Inlet landslide.
Evidence of the secondary landslide movement is the lighter bare slope in
center of the photograph (arrow). Photograph taken July 12, 2002.
Figure 10. Eastern section of the main scarp.
Note the subsequent accumulation of rockfall talus below the main scarp.
Photograph taken July 15, 2002.
Figure 11. Western portion of the main scarp
in thinly layered, slightly folded and fractured bedrock, turbidite of Tidal
Formation. Note the small revegetation (bushes) in the center of the escarpment.
Photograph taken July 15, 2002.
Figure 12. Back-facing rotational escarpments
and resulting trough, roughly perpendicular to the downslope direction within
the main body of the Tidal Inlet landslide. Direction of landslide movement
is to the left, the same as the predominant downslope direction.
Figure 13 A) Profile from hand-held GPS with
locations of permanent GPS monitoring stations (red dots) on upper portion
of landslide. Irregular surface profile is indicative of movement of multiple
rotational blocks. B) Enlarged aerial photographic view of upper part of
Tidal Inlet landslide showing GPS profile points (green dots) starting from
top of main scarp and proceeding to location of secondary failures. Labels
for red dots show GPS monitoring points. Points TI-6D and TI-3A are so close
to each other that they are shown as a single red point. Linear shadows across
portions of width of photo show rotational blocks, some of which disrupted
by secondary failure in middle of view.
Figure 14. Sketch showing hypothetical subsurface
model for Tidal Inlet landslide movement involving LIA glacial retreat and
debuttressing of slopes in Tidal Inlet. A) Ice surface during maximum of
LIA about AD 1800 with rupture surface of pre-LIA landslide possibly extending
below present shoreline; bedrock dipping slightly to north, B) Initiation
of recent rock slump with separate rotational blocks (only 4 of 13 blocks
represented) shortly following (1892-1919) removal of lateral support for
slope with glacial retreat from Tidal Inlet, and C) Present perched landslide
above shoreline of Tidal Inlet showing both recent and pre-LIA rupture surfaces
with more steeply dipping bedrock. Sketch shows approximate profile that
is not necessarily to scale.
Figure 15. View from Tidal Inlet landslide looking westward towards Blue
Mouse Cove of two cruise ships in the western arm of Glacier Bay passing
Tidal Inlet (lower center).