Surficial sediment character of the New York-New Jersey offshore continental shelf region: A GIS Compilation
|
|
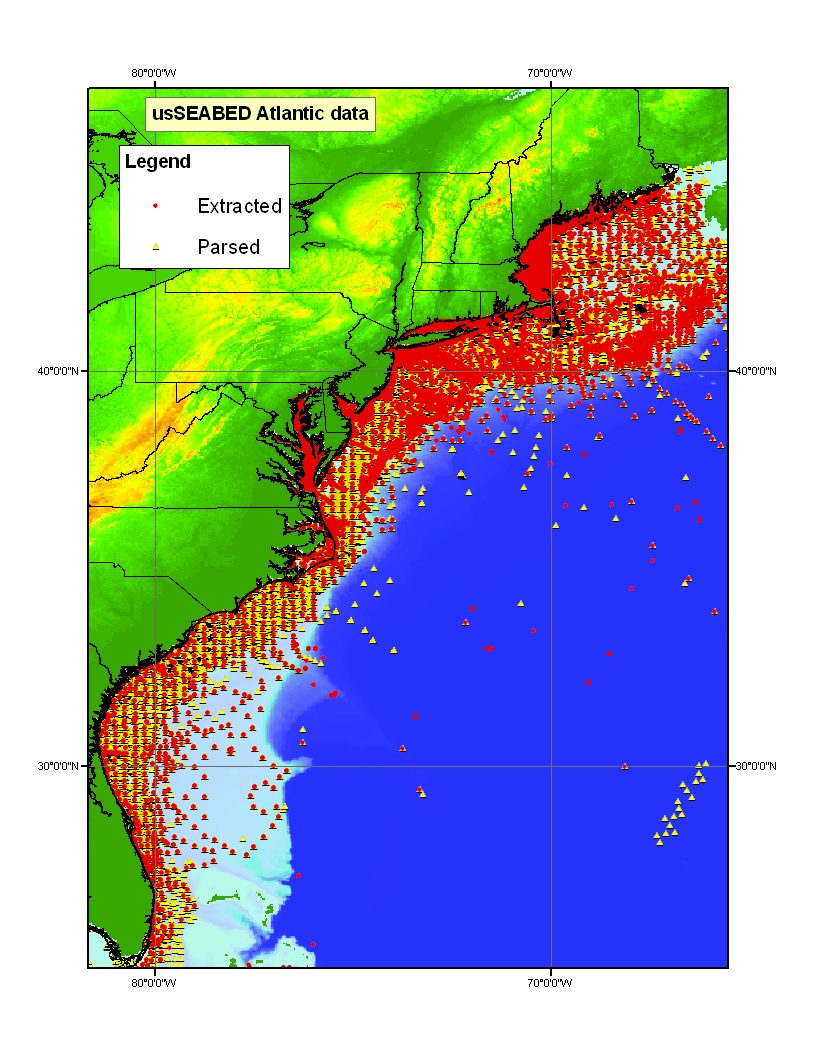
IntroductionOverviewBroad continental shelf regions such as the New York Bight are the product of a complex geologic history and dynamic oceanographic processes, dominated by the Holocene marine transgression (>100 m sea-level rise) following the end of the last Pleistocene ice advance ~ 20,000 years ago. The area of the U.S. Exclusive Economic Zone (U.S. EEZ) territory, extending 200 nautical miles seaward from the coast, is larger than the continental U.S. and contains submerged landforms that provide a variety of natural functions and societal benefits, such as: critical habitats for fisheries, ship navigation and homeland security, and engineering activities (i.e. oil and gas platforms, pipeline and cable routes, potential wind-energy-generation sites). Some parts of the continental margins, particularly inner-continental shelf regions, also contain unconsolidated hard-mineral deposits such as sand and gravel that are regarded as potential aggregate resources to meet or augment needs not met by onshore deposits (Williams, 1992). The present distribution of surficial sediment off the northeastern United States is shaped from the deposits left by the last glaciation and reflects the cumulative effects of sediment erosion, transport, sorting, and deposition by storm and tidal processes during the Holocene rise in sea level. As a result, the sediments on the sea floor represent both an historical record of former conditions and a guide to possible future sedimentary environments. The U.S. Geological Survey (USGS) through the Coastal and Marine Geology Program, in cooperation with the University of Colorado and other partners, has compiled extant sediment character and textural data as well as other geologic information on the sea floor from all regions around the U.S. into the usSEABED data system (Reid and others, 2005; Buczkowski and others, 2006; Reid and others, 2006). The usSEABED system, which contains information on sediment grain size and lithology for more than 340,500 stations within the U.S. EEZ. has been developed and populated with data as part of the USGS Marine Aggregate Resources and Processes and the National Benthic Habitats projects in order to provide the base-line data needed to update the current maps of offshore surficial geologic character and sediment distribution. The maps are also used to characterize benthic sea floor environments important for marine ecosystems.
U.S. Geological Survey, Data Series 118 (Reid and others, 2005), of the usSEABED data release series, represents the combined efforts of the USGS and several other government agencies to provide a unified resource for accessing and preserving records of U.S. east coast sea floor geologic information and sediment texture data.
This report is based on data contained in U.S. Geological Survey Data Series 118 (Reid and others, 2005) and shows an assortment of example GIS products that are possible using usSEABED. All data are intended to be GIS-ready and should not require any additional cleanup, formatting, or renaming of fields in order to use the data in a Geographic Information System. This project employs the Environmental Systems Research Institute's (ESRI) ArcView™ software. Many of these maps were made as part of the ongoing USGS study to assess marine aggregate resources offshore New York and New Jersey, but these maps can serve many other purposes. The marine science community, educators, students and others are encouraged to use these data to generate GIS products for their own purposes. The objectives of the Marine Aggregate Resources and Processes project are to produce a series of new geologic maps and reports of the sea floor that will provide scientific insights into the character and geologic development of U.S. continental margins and to use these maps and information to assess the potential availability of offshore sand and gravel resources. The mapping and aggregate resource assessments are being conducted on a national scale using the usSEABED data base as described in Williams and others (2003). Potential uses for these data include: (1) defining the geological variability of the sea floor in relation to benthic habitat diversity; (2) improving our understanding of the processes that control the distribution and transport of bottom sediments and benthic habitats; (3) locating aggregate resources for beach nourishment and industrial applications; and (4) providing a detailed geospatial framework for future marine science research, monitoring, and management activities. The initial assessments are in progress for the New York Bight and Louisiana offshore areas. ApplicationsThe usSEABED dataset has many potential uses. Discussed here are three illustrated applications of how the data may be used. Examples of maps that may be made with the data included on this CD-ROM may be found in the Browse Maps section of this publication. |
Since the passing of the Sustainable Fisheries Act of 1996, Regional Fishery Management councils around the U.S. have been describing and identifying essential fish habitat (EFH) in their respective regions to more effectively manage the Nation's fisheries. Congress defined EFH as "those waters and substrate necessary to fish for spawning, breeding, feeding or growth to maturity." |
| Sand and Gravel Resouces for Beach Nourishment 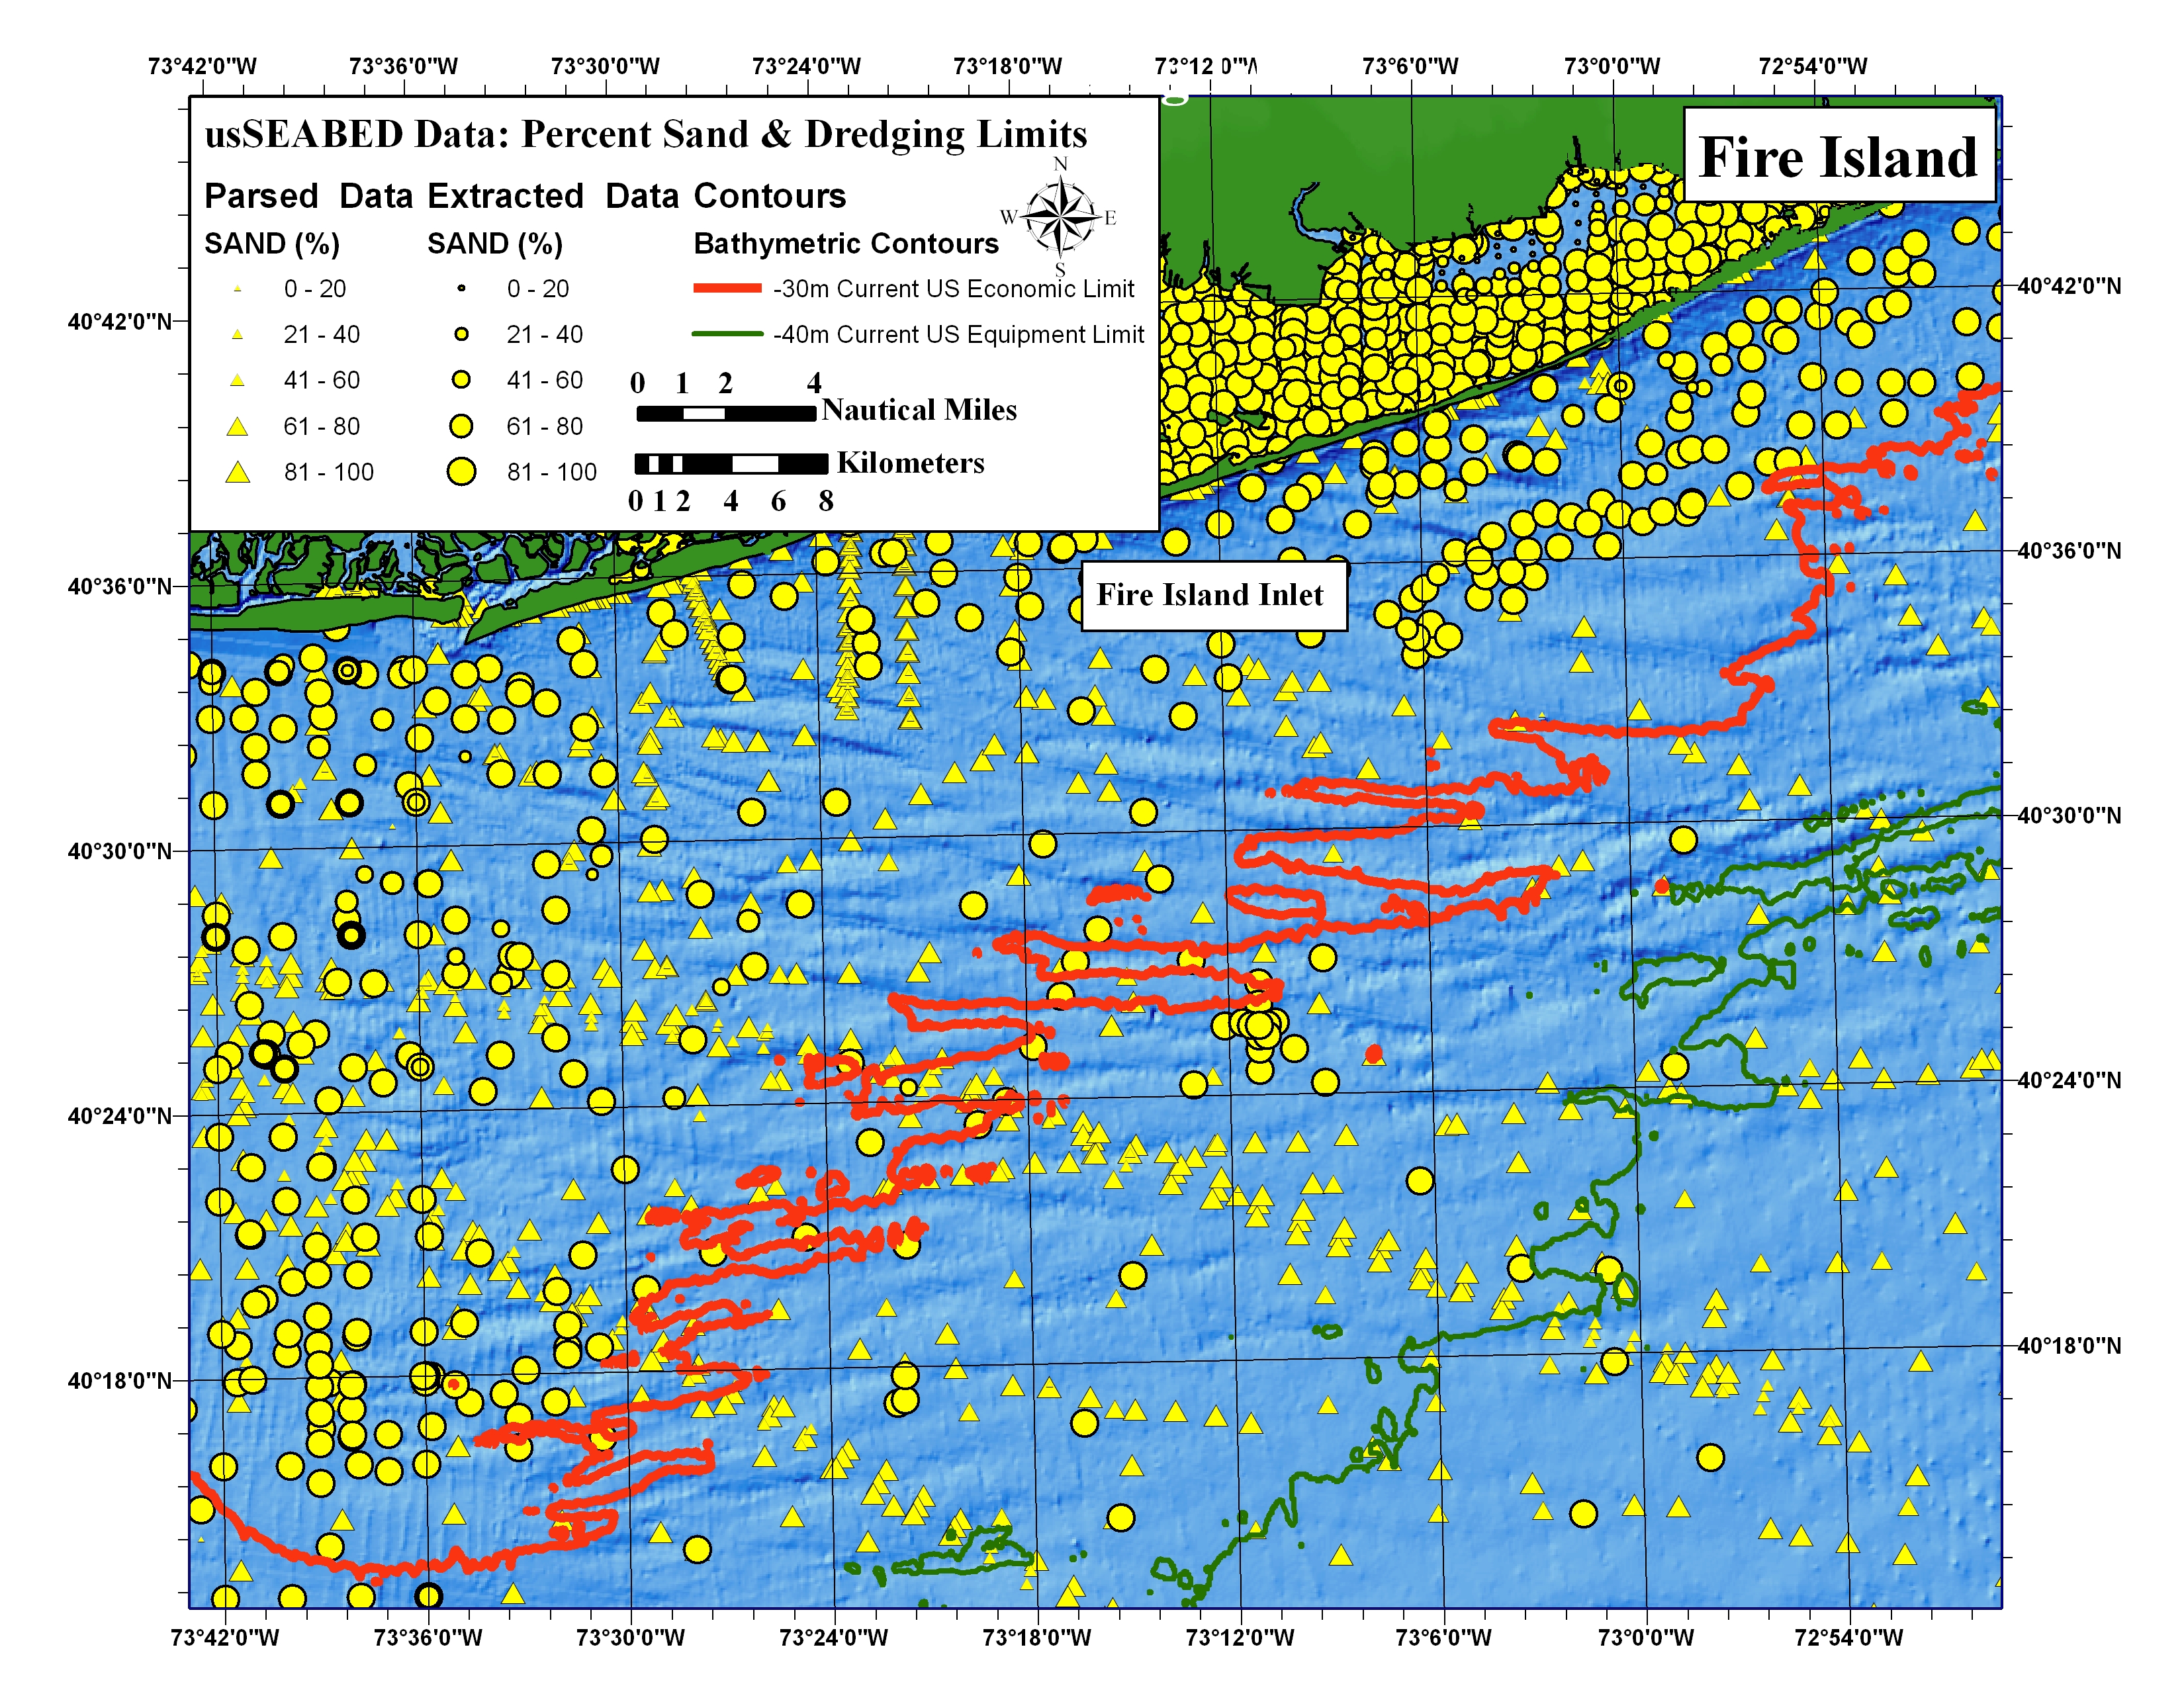
| Screen Size | Full Size | pdf Version | |
|
Beach nourishment, a method of dredging sand from offshore areas and pumping it ashore to widen and elevate beaches and dunes is often viewed as a cost-effective and environmentally acceptable method for use on developed coasts to mitigate erosion, reduce storm and flooding risk, enhance recreation, and restore degraded ecosystems. For beach nourishment to be viable, however, large volumes of high quality sand are necessary and the sand deposits must be located reasonably close to the beaches being nourished. Also, the sand deposits ideally should be in water depths ranging from approximately -10 m, an approximate “close-out depth” for nearshore sediment transport, to -40 m, an approximate current limit of U.S. commercial dredging. The map above shows the percent sand composition of usSEABED data points on the Long Island inner shelf in relation to the current water depth dredge limits. For beach nourishment, >90 % sand is optimal for best performance. |
|
Planning Sea-Floor Routes and Utilities Placement 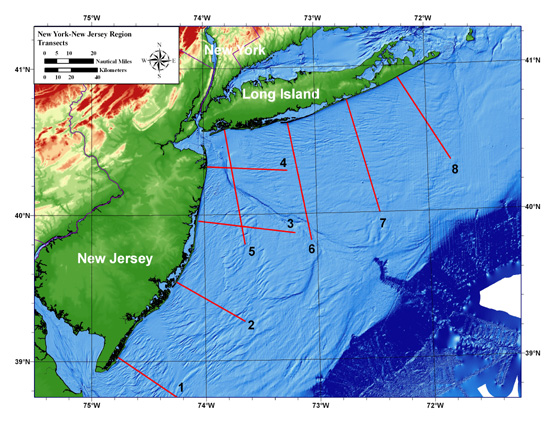 | Screen Size | Full Size | pdf Version | The New York Bight shelf is the product of a complex geologic history and dynamic oceanographic processes, dominated by the Holocene marine transgression during the past 20,000 years. Engineering activities (i.e., pipeline and cable routes, potential wind-energy-generation sites) are increasing within these regions as infrastructure and resource planning tries to keep pace with growing demand. |
|
| pdf Version | North-south transect from Rockaway Beach, NY along the NJ coast displaying sedimentary features of the geologic record, important in engineering uses of the sea floor. The sandy inner shelf extends 20 km offshore to -32 m water depths, while the slightly elevated region (-28 m) farther south is in contrast to the deeply incised (-64 m) Hudson Shelf Valley that displays a marked asymmetry. |
![]() To view files in PDF format, download free copy of Adobe Reader.
To view files in PDF format, download free copy of Adobe Reader.
Main Menus
OFR 2006-1046 Home | Introduction | Nomenclature | Sea-Floor Photos
| Data Dictionary |
Data Catalog | Browse Maps | References | Related Websites | Acknowledgments | Contacts | For Educators | Disclaimer | README
Sub-Menus
Introduction | Overview | Applications

![]() U.S. Department of the Interior |
U.S. Geological Survey
U.S. Department of the Interior |
U.S. Geological Survey
URL: pubsdata.usgs.gov/pubs/of/2006/1046/htmldocs/intro.htm
Page Contact Information: Publishing Services
Page Last Modified: Saturday, 12-Jan-2013 22:23:14 EST