Surficial sediment character of the Louisiana offshore continental shelf region: A GIS Compilation
|
|
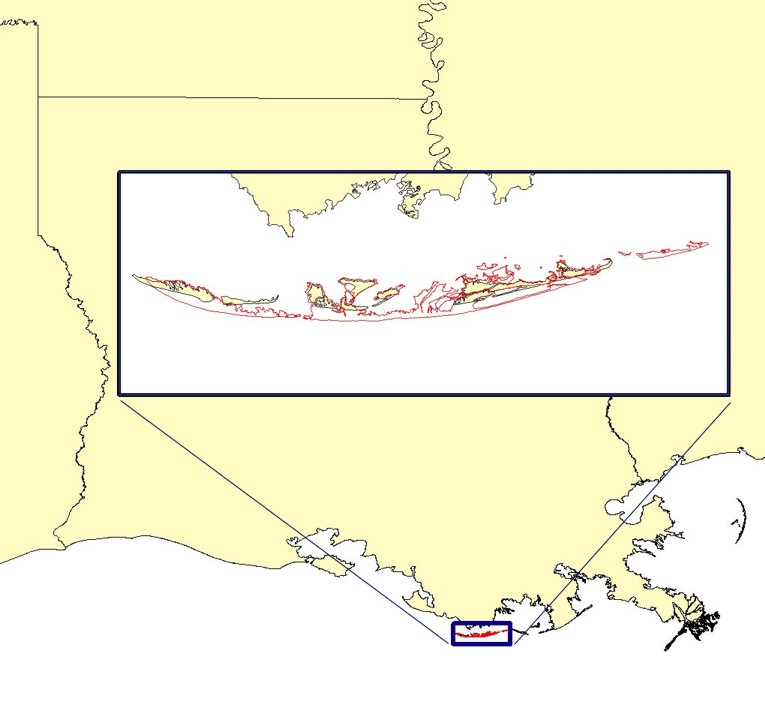
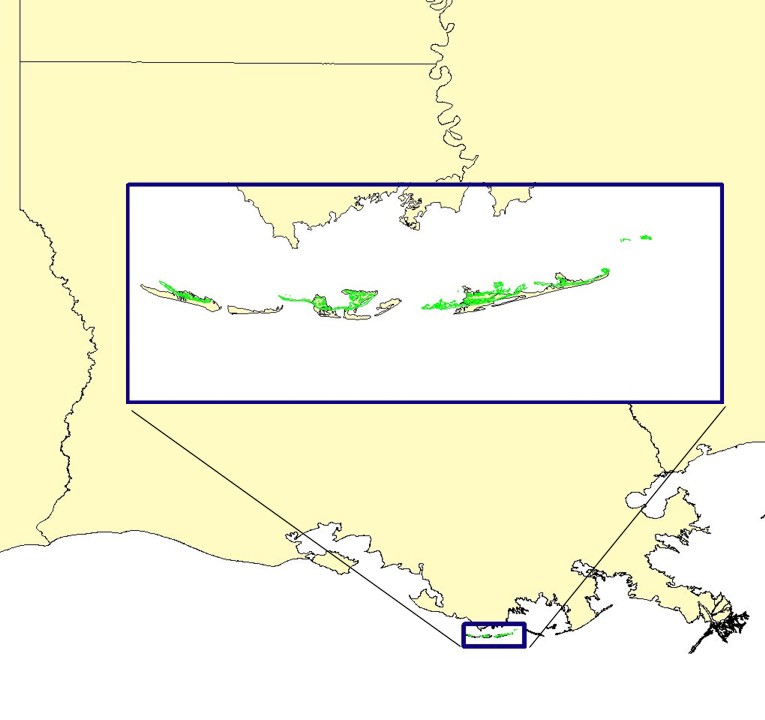
IntroductionSettingThe Louisiana coastal zone, comprising the Mississippi River delta plain stretching nearly 400 km from Sabine Pass at the Texas border east to the Chandeleur Islands at the Mississippi border, represents one of North America’s most important coastal ecosystems in terms of natural resources, human infrastructure, and cultural heritage. At the same time, this region has the highest rates of coastal erosion and wetland loss in the Nation due to a complex combination of natural processes and anthropogenic actions over the past century. Comparison of historical maps dating back to 1855 and recent aerial photography show the Louisiana coast undergoing net erosion at highly variable rates. Rates have increased significantly during the past several decades. Earlier published statewide average shoreline erosion rates were >6 m/yr; rates have increased recently to >10 m/yr. The increase is attributable to collective action of storms, rapid subsidence, and pervasive man-made alterations of the rivers and the coast. In response to the dramatic landloss, regional-scale restoration plans are being developed by a partnership of federal and state agencies for the delta plain that have the objectives of maintaining the barrier islands, reducing wetland loss, and enhancing the natural sediment delivery processes. There is growing awareness that the sustainability of coastal Louisiana's natural resources and human infrastructure depends on the successful restoration of natural geologic processes. Critical to the long term success of restoration is scientific understanding of the geologic history and processes of the coastal zone region, including interactions between the rivers, wetlands, coast, and inner shelf. A variety of geophysical studies and mapping of Late Quaternary sedimentary framework and coastal processes by U.S. Geological Survey and other scientists during the past 50 years document that the Louisiana delta plain is the product of a complex history of cyclic delta switching by the Mississippi River and its distributaries over the past ~10,000 years that resulted in laterally overlapping deltaic depocenters. The interactions among riverine, coastal, and inner shelf processes have been superimposed on the Holocene transgression resulting in distinctive landforms and sedimentary sequences. Four Holocene shelf-phase delta complexes have been identified using seismic reflection data and vibracores. Each delta complex is bounded by transgressive surfaces. Following each cycle of deposition and abandonment, the delta lobes undergo regional subsidence and marine reworking that forms transgressive coastal systems and barrier islands. Ultimately, the distal end of each of the abandoned delta lobes is marked by submerged marine sand bodies representing drowned barriers. These sand bodies (e.g. Ship Shoal, Outer Shoal, Trinity Shoal, Tiger Shoal, St. Bernard Shoal) offer the largest volumes and highest quality sand for beach nourishment and shoreline and wetlands restoration. These four large sand shoals on inner continental shelf, representing the reworked remnants of former prograded deltaic headlands that existed on the continental shelf at lower sea level, were generated in the retreat path of the Mississippi River delta plain during the Holocene transgression. Penland and others (1989) have shown these sand bodies represent former shoreline positions associated with lower still stands in sea level. Short periods of rapid relative sea-level rise led to the transgressive submergence of the shorelines which today can be recognized at the -10 m to -20 m isobaths on the Louisiana continental shelf. Trinity Shoal and Ship Shoal represent the -10 m middle-to-late Holocene shoreline trend, whereas Outer Shoal and the St. Bernard Shoals define the -20 m early Holocene shoreline trend (Penland and others, 1989). Collectively, these sand shoals constitute a large volume of high quality sandy sediment potentially suitable for barrier island nourishment and coastal restoration. The USGS has actively supported coastal and wetlands geologic research for the past two decades in partnership with universities (e.g., Louisiana State University, University of New Orleans), state agencies (e.g. Louisiana Geological Survey, Louisiana Department of Natural Resources), and private organizations (Williams and others, 1992a,b; Williams and Cichon, 1993; List and others, 1994). These studies have focused on regional-scale mapping of coastal and wetland change and developing a better understanding of the processes that cause coastal erosion and wetlands loss, particularly the rapid deterioration of Louisiana's barrier islands, estuaries, and wetlands environments. With a better understanding of these processes, the ability to model and predict erosion and wetlands loss will improve. More accurate predictions will, in turn, allow for proper management of coastal resources. Improved predictions will also allow for better assessments of the utility of different restoration alternatives. Note: Much of the preceding descriptive material is from the recent publication, "Mississippi River Delta Plain, Louisiana Coast and Inner Shelf: Holocene Geologic Framework and Processes". Please refer to that report for more information about the delta plain geologic history and processes and a complete listing of references, many of which are included in the references section of this report. Citation: Williams, S.J., Kulp, M., Penland, S., Kindinger, J.L., and Flocks, J.G., (in press), Mississippi River Delta Plain, Louisiana Coast and Inner Shelf: Holocene Geologic Framework and Processes, chapter in Gulf of Mexico, its origins, water, biota, and human impacts (C. Holmes and W. Tunnell, eds.), Texas A&M Press Books. The shoreline change maps of the Isles Derniers below are examples from U.S. Geological Survey Digital Data Series 79 (Williams and others, 2003), Coastal Erosion and Wetland Change in Louisiana: Selected USGS Products, depict historic shoreline change of the Louisiana coast and are provided as additional information demonstrating how the delta plain has undergone dramatic change due to a complex combination of natural and man-made processes.
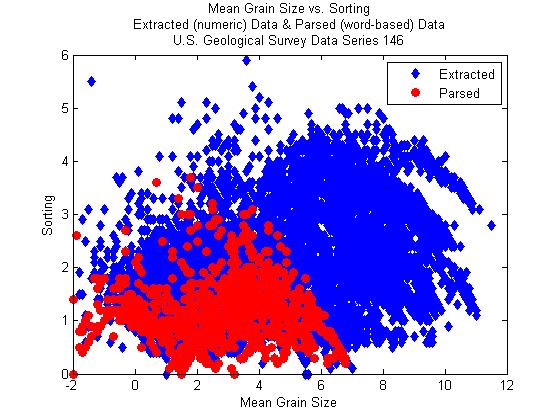
Data at a GlanceScatter diagram of superimposed plots of mean sediment grain size (x-axis) vs. sorting (y-axis) for the Extracted data (in blue) and the Parsed data (in red) along the Louisiana coastal margin from USGS Data Series 146.
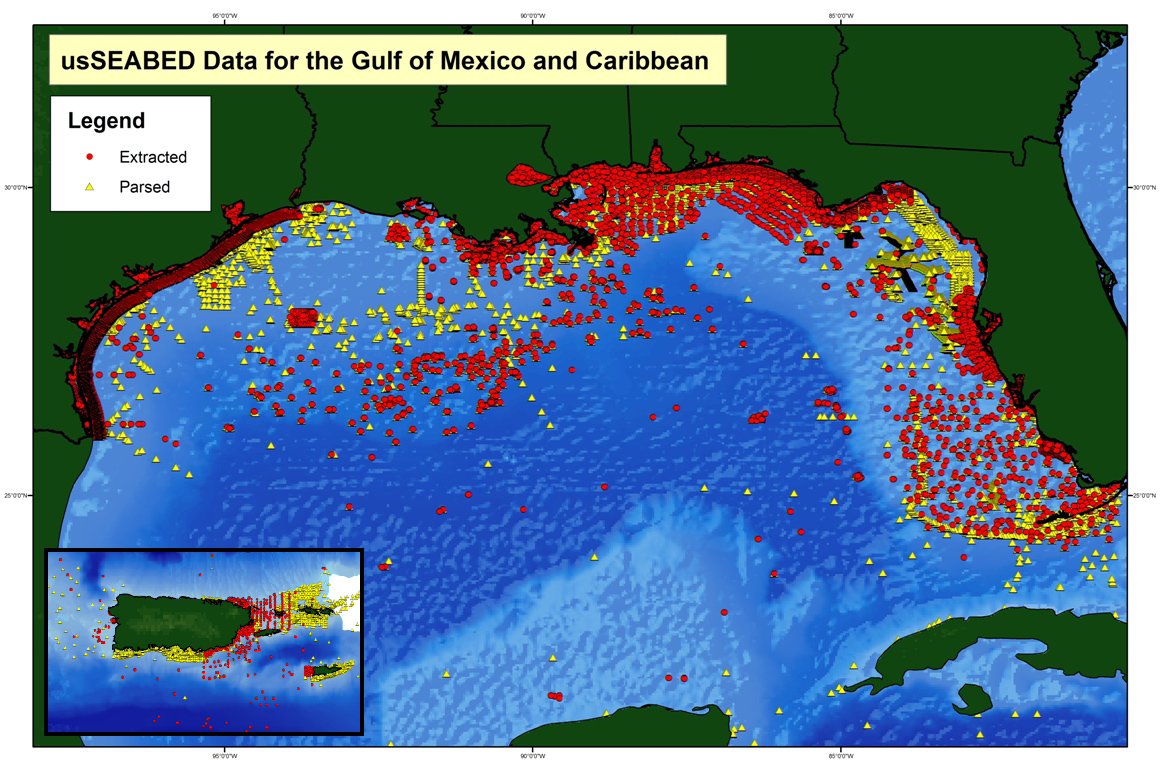
| Screen Size | pdf | usSEABED Overview Publications in the usSEABED data release series, represent the combined efforts of the USGS and several other government agencies and universities to provide a unified resource for accessing and preserving records of sea floor geologic information and sediment texture data.
This report focuses on the Louisiana delta plain offshore region, an area that has been intensely studied by the USGS for many years. The goal of these studies has been to better understand the geologic history and processes of the coastal and wetland landscape features as well as offshore components of the delta plain. | ||||||||||||||||||||||
The objectives of the Marine Aggregate Resources and Processes project are to produce a series of new geologic maps and reports of the sea floor that will provide scientific insights into the character and geologic development of U.S. continental margins and to use these maps and information to assess the potential availability of offshore sand and gravel resources. The mapping and aggregate resource assessments are being conducted on a national scale using the usSEABED data base as described in Williams and others (2003b). Potential uses for these data include: (1) defining the geological variability of the sea floor, in relation to benthic habitat diversity; (2) improving our understanding of the processes that control the distribution and transport of bottom sediments and benthic habitats; (3) locating aggregate resources for beach nourishment and industrial applications; and (4) providing a detailed geospatial framework for future marine science research, monitoring, and management activities. The initial assessments are in progress for the New York Bight and Louisiana offshore areas.
This report is based on data contained in U.S. Geological Survey Data Series 146 (Buczkowski and others, 2006) and shows examples of GIS products that are possible using usSEABED. All data are intended to be GIS-ready; that is the data should not require any additional cleanup, formatting, or renaming of fields in order to use the data in a Geographic Information System. This project employs the Environmental Systems Research Institute's (ESRI) ArcView™ software. Many of these maps were made as part of the ongoing USGS study to assess marine aggregate resources offshore Louisiana, but these maps can serve many other purposes. The marine science community, educators, students and others are encouraged to use these data to generate GIS products for their own purposes.
The usSEABED data set has many potential uses. Illustrated here are three applications of how the data may be used. Further examples of maps that may be made with the data included on this CD-ROM may be found in the Browse Maps section of this publication.
Since the passing of the Sustainable Fisheries Act of 1996, Regional Fishery Management councils around the U.S. have been describing and identifying essential fish habitat (EFH) in their respective regions to more effectively manage the Nation's fisheries. Congress defined EFH as "those waters and substrate necessary to fish for spawning, breeding, feeding or growth to maturity."
|
| Screen Size | Full Size | |
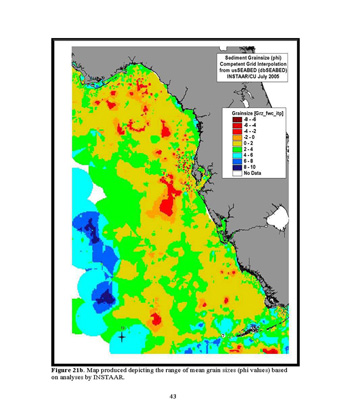
The Florida Fish and Wildlife Conservation Commission in collaboration with other groups modeled and mapped water-column and benthic habitat data in relation to catch and effort data associated with the pink shrimp fishery on the West Florida Shelf (WFS). Some of the water-column habitat data included bottom temperature, bottom current speed and current direction. Sediment distribution maps produced using usSEABED data were produced by INSTAAR of the University of Colorado at Boulder. Suitability functions created from the fishery data were used to predict catch rates (CPUEs) in relation to depth, aspect, bottom type, bottom temperature, bottom current speed, current direction, and VMS zones. Habitat suitability models (HSM) linked to geographic information systems (GIS) were used to predict spatial distributions and abundances of pink shrimp monthly from March 2004 to June 2005. This multi-institution project is intended to foster new relationships between public institutions and private business, and can benefit both the fishing industry and fisheries management (Rubec and others, 2005). |
| Screen Size | Full Size | |
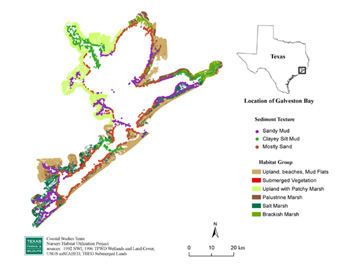
The Texas Parks and Wildlife Department, funded in part by a US Fish and Wildlife Service Wildlife Grant, is conducting a spatial and temporal evaluation of fish and shellfish nursery habitat in two Texas bay systems: Galveston and San Antonio. The Department’s Coastal Fisheries Division, Coastal Studies Team is using usSEABED sediment information from USGS DS-146, in part to characterize shoreline bottom texture (sand, silt, mud, clay, or a mixture), which aids in differentiating back-bay habitats. |
|
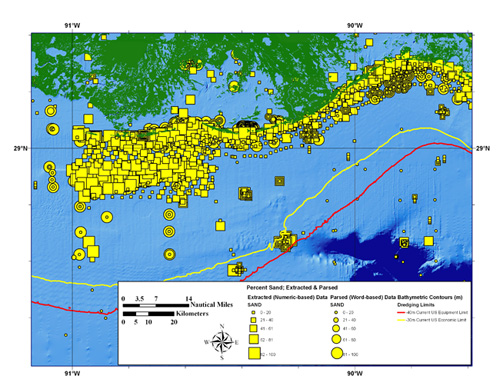
| Screen Size | Full Size | pdf Version | Beach nourishment, a method of dredging sand from offshore areas and pumping it ashore to widen and elevate beaches and dunes is often viewed as a cost-effective and environmentally acceptable method for use on developed coasts to mitigate erosion, reduce storm and flooding risk, enhance recreation, and restore degraded ecosystems. For beach nourishment to be viable, however, large volumes of high quality sand are necessary and the sand deposits must be located reasonably close to the beaches being nourished. Also, the sand deposits ideally should be in water depths ranging from approximately -10 m, an approximate “close-out depth” for nearshore sediment transport, to -40 m, an approximate current limit of U.S. commercial dredging. The map above shows the percent sand composition of usSEABED data points on the Louisiana inner shelf in relation to the current water depth dredge limits. For beach nourishment, >90 % sand is optimal for best performance .
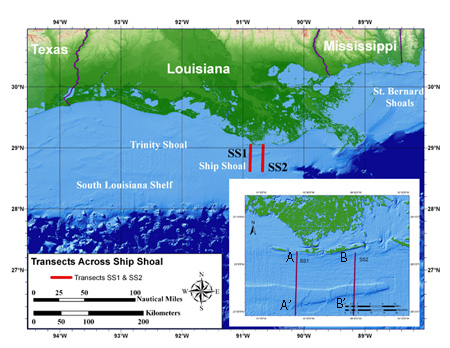
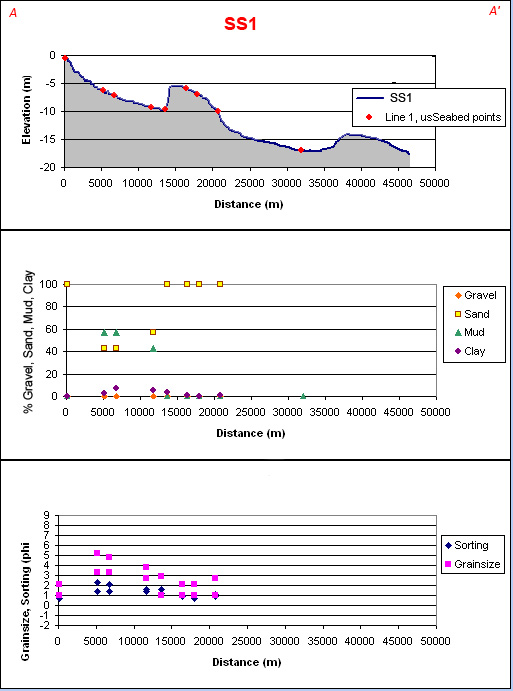
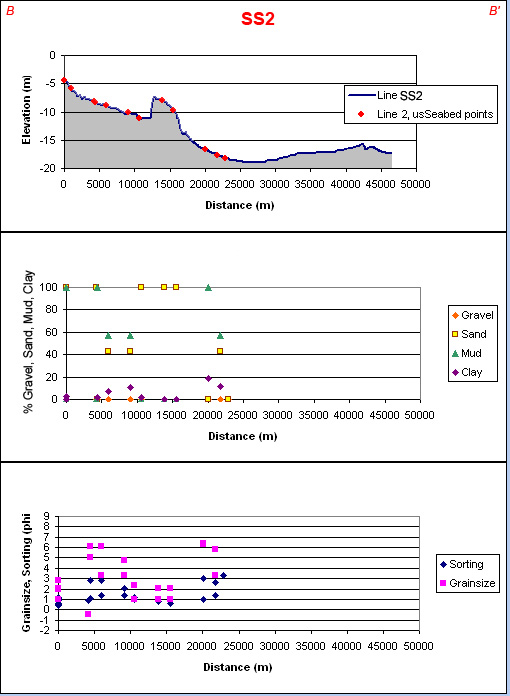
| Screen Size | Full Size | pdf Version | The Louisiana shelf is the product of a complex geologic history and dynamic oceanographic processes, dominated by the Holocene marine transgression during the past 20,000 years and cyclic shifts of the Mississippi River over the past 7,000 years. Engineering activities (i.e., oil and gas production, LNG facilities, pipeline and cable routes, potential wind-energy-generation sites) are increasing within these regions as infrastructure and resource planning tries to keep pace with growing demands. The shore-normal profiles SS1 and SS2 depict the seafloor morphology from the shoreface to 50 km seaward of Ship Shoal. Plots of sediment character below the profiles show the shoreface is predominantly muddy sand and Ship Shoal is nearly 100 percent sand.
|
Main Menus
OFR 2006-1195 Home | Introduction | Nomenclature | Coastal Change | Data Dictionary | Data Catalog | Browse Maps | References | Related Web Sites | For Educators | Acknowledgments | Contacts | Disclaimer| README
Sub-Menus
Introduction | Setting | usSEABED Overview | |

![]() U.S. Department of the Interior |
U.S. Geological Survey
U.S. Department of the Interior |
U.S. Geological Survey
URL: http://pubsdata.usgs.gov/pubs/of/2006/1195/htmldocs/intro.htm
Page Contact Information: Publishing Services
Page Last Modified: Saturday, 12-Jan-2013 22:32:33 EST