U.S. Geological Survey Open-File Report 2008-1351
USGS Cold-Water Coral Geographic Database—Gulf of Mexico and Western North Atlantic Ocean, Version 1.0
Using the Database
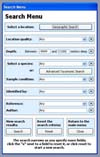
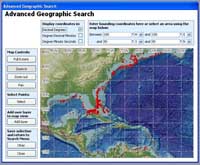
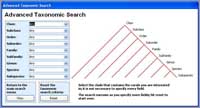
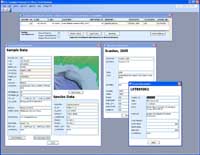
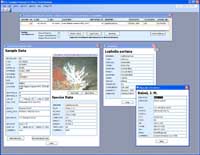
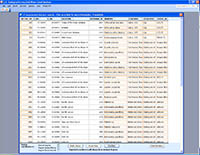
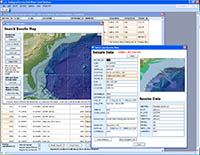
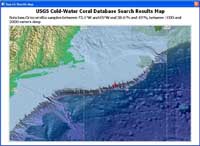
Data in the database can be displayed in a variety of formats, including tables and maps. By using the taxonomic and geographic search functions, the user can choose to display subsets of the data with only the pertinent fields visible. Many fields can be clicked to bring up additional information about the data. For example, the cruise ID can be clicked to see the name of the ship, the cruise dates, and the name of chief scientist; the taxonomic binomen can be clicked to view the complete taxonomy from Class to Subspecies. Detailed instructions for searching and displaying the data are provided below. The search menu provides an easy-to-use query builder (Figure 4). Searches can be performed geographically, taxonomically, or by other parameters such as water depth, author, scientist who identified the specimen, or the quality of the location data. The user needs to enter only as many fields as he or she would like. If no criteria are specified, all the data are shown. To reset the entire search query, the user clicks the Reset button at the bottom of the window. To reset just one of the criteria, the user clicks the X button next to that field. The Geographic Search button opens a new window (Figure 5) that allows the user to either enter the coordinates of a rectangle within which to search for data or drag a rectangle over the map area he or she would like to search. The Advanced Method includes more advanced mapping tools. Buttons to select zooming, panning, or point selection are on the left. In the Standard Method, the user simply drags a rectangle across the map. In either version, the user can specify the coordinates to be displayed in decimal degrees, degrees and decimal minutes, or degrees, minutes, and seconds by clicking the buttons at the top of the window. The Advanced Taxonomic Search button opens a new window (Figure 6) that lets the user search for corals based on any level of their taxonomy. Every time an item is selected from one of the dropdown menus, the values are refreshed to include only data pertinent to that selection (for example, if a genus is specified, only species within that genus will be shown). The Taxonomic Search can be reset by clicking the Reset button at the bottom of the window. When the Geographic Search or Advanced Taxonomic Search parameters are set, the user clicks Okay to return to the main search menu, where additional parameters can be set. Location quality is a subjective criterion (see discussion in the Methods section) assigned to help the user filter out entries (generally older data) obtained using less accurate navigation. Alternatively, selecting 3 for low-quality location data will return entries from older cruises. The default Depth search includes values of -9999, which represents an unknown depth. The known values are in meters below sea level and are positive numbers. Sample condition refers to whether the coral was dead or alive when identified. In many cases, that information was not included in the source publications and is reported in the database as unknown. The Identified by, Reference, and Author criteria give the user a variety of ways to find a particular subset of data. When the user is satisfied with the selected search criteria, he or she clicks the Search button at the bottom of the Search Menu window. The Search Results window will then appear. (See Figures 7a, 7b, 7c, and 7d for examples.) All of the coral samples that match the selected criteria are listed. Selecting the column heading of the “Search Results” window will sort the data in ascending order. By default the data is sorted in ascending order by record number (RECORD_NO). Fields that are bordered in orange (for example, RECORD_NO, BINOMEN, CITATION1, and CRUISE_ID) are clickable and will bring up a window containing more information about that field. The user can specify the coordinates to be displayed in decimal degrees, degrees and decimal minutes, or degrees, minutes, and seconds by clicking the buttons at the bottom of the window. The Field Definitions button in the bottom right will open a window containing a list of all of the fields with descriptions If the user clicks the RECORD_NO for a sample, it will open the Sample and Species View window (see Figures 7a and 7b for examples). This window shows all of the data for a particular sample including a small map showing where the sample was collected. Also, if a photo (or photos) is associated with the sample, a Show Photo button will appear under the map. If there is more than one photo, a Next Photo button will appear under the photo. Above each photo is a link to a higher resolution version of the photo. Clicking on any field surrounded by an orange box will bring up more information about that field. The Field Definitions window can be accessed by clicking the button at the bottom left. The Show Map button under a photo will replace the photo with the location map. In the Advanced Method, clicking on the View Map button at the bottom of the Search Results window will open a Search Results Map. This map will display all of the points listed in the Search Results (see Figure 7d for an example). The buttons on the left allow the user to switch among panning, zooming, and selecting a point. If the user clicks the Select Point button and then a sample point on the map, the Sample View window for that point will appear. If more than one point is very close to the selected point, the sample data for all of them will be retrieved and a statement in red (for example, “Sample 1 of 5”) will appear at the top of the Sample Data page. Clicking the Next button allows the user to see each of the samples. Clicking the Open Print Map button will open a printable version of the map with the search criteria specified at the top (Figure 8). The area covered by this map will be approximately the same as the area of the Search Results Map, so the user must be sure to set the zoom level and location before clicking Open Print Map. The map can be sent to a printer or saved as a PDF file. With the Advanced Method, the user can add one personal geographic-information-system (GIS) layer to both the Geographic Search window and the View Map window. The Add Layer button allows the user to select an ESRI shapefile (point, line, or polygon) from his or her computer and add it to the map view. When Add Layer is clicked, the user is prompted to select a shapefile (.shp), a color, and a line weight (or point size). The added layer, it will appear in every map in the database (Geographic Search, Search Results, and Print Map) until the Remove Layer button is clicked. Only one layer can be added at a time, and the layer must be in a geographic coordinate system (WGS-84). To export the search results for further use, the user clicks the Export Data button at the bottom of the Search Results menu. The Standard Method can export comma-separated values, Excel spreadsheets, and MS Access databases. The Advanced Method can export the same file types plus dBase IV files and ESRI shapefiles. To export, the user first sets the search criteria and clicks Search. He or she then clicks the Export button at the bottom of the Search Results page to open the Data Export Utility page. The fields are selected in the dropdown menu on the left and then appear in the “Fields to be Exported” list on the right. The order of the fields can be changed with the up and down arrows, or a field can be removed by clicking the X next to it. The user has the option to choose a preset group of fields to export from a list at the top of the window. All Fields exports every field in the database, Taxonomic Data is focused on taxonomy, and Cruise and Navigation includes mainly fields related to the cruise and navigation data. The binomen (BINOMEN), latitude (Y_DD), longitude (X_DD), and original reference (CITATION1) will always be included in the exported data and cannot be deleted. After clicking the Export Data button, the user will be prompted to specify a location, file type, and name for the saved file. The default export location is denoted as “C:\,” and the default file name is “Export.” The metadata documentation produced during the process of exporting is based on the complete data set in the USGS CoWCoG as of the publication date. If the user makes changes to the database, the metadata file exported will not reflect those changes. Likewise, the metadata will not reflect selections made to export a narrow range of data. For example, the metadata says that water-depth values can be between -9999 m and 3259 m (where -9999 m represents no data). If the user exports records only from water depths greater than 1000 m, the exported metadata will still say that water-depth values can be between -9999 m and 3259 m. Metadata are exported in XML format, which can be read by ArcCatalog and converted to other formats using a software program called Metadata Parser (MP), available for free download from the USGS at http://geology.usgs.gov/tools/metadata/tools/doc/mp.html. The position data have been transformed (with some exceptions) to the WGS-84 datum. Many references do not specify the datum that was used when the locations of samples were recorded, so some general assumptions were made while transforming the data. The recorded locations for samples collected between 1927 and 1983 were assumed to be based on NAD27, and the locations of samples collected after 1983 were assumed to be based on NAD83. Data collected before 1927 were not transformed because the positional shift resulting from transformation to another datum would fall within the margin of error for most of these points (which are often reported only to within a third of a degree). Also, points recorded with no known collection date or cruise date were not transformed. All exported shapefiles use the WGS-84 datum, however. The original latitudes and longitudes (as reported in the source publications) are included in the data for users who would like to perform their own transformations. The GIS folder contains the images and shapefiles used to display maps within the database. The background image is a section of the dataset named 2-Minute Gridded Global Relief Data (ETOPO2), which is available from the National Geophysical Data Center, National Oceanic and Atmospheric Administration, U.S. Department of Commerce, at http://www.ngdc.noaa.gov/. Use of the zoom tool on coastal areas around the U.S. displays additional higher-resolution data from the Coastal Relief Model (CRM). These data have been resampled to save space and are displayed at a ½ minute resolution. The Images folder contains photographs of some of the samples that are included in the database. It is recommended that the user view them through the database to see them in the full context of the associated data |