Figure 1. Map showing the location of the northern Cape Cod Bay survey area (outlined in red) between Duxbury Beach and Provincetown, MA. The 50-meter depth contour is shown for reference. Area outlined in red indicates area shown in figures 3-7. |
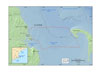 |
Figure 2. Photographs of the research vessels used for the geophysical mapping in this project. A: R/V Megan T. Miller (06012, 07002), B: R/V Rafael (07001, 08002), C: R/V Connecticut (07003). Field-activity numbers are shown in parentheses. |
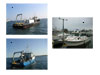 |
Figure 3. Map showing tracklines along which bathymetric depth data were collected in the northern Cape Cod Bay survey area. Tracklines are color-coded by field activity serial number. |
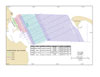 |
Figure 4. Map showing shaded-relief bathymetry of the seafloor in northern Cape Cod Bay. Coloring and bathymetric contours represent depths in meters, relative to the Mean Lower Low Water (MLLW) datum. Areas shown in gray hillshade indicate gaps in the bathymetric coverage that were filled during post-processing using interpolation. |
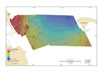 |
Figure 5. Map showing tracklines along which acoustic backscatter data were collected in the Cape Cod Bay survey area. Tracklines are color-coded by field activity serial number. |
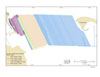 |
Figure 6. Map showing acoustic-backscatter intensity of the seafloor in the northern Cape Cod Bay survey area. Backscatter intensity is an acoustic measure of the hardness and roughness of the seafloor. In general, higher values (light tones) represent rock, boulders, cobbles, gravel, and coarse sand. Lower values (dark tones) generally represent fine sand and muddy sediment. Locations of sediment samples are identified as yellow circles. |
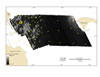 |
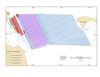
Figure 7. Map showing tracklines along which seismic reflection profiles were collected in the northern Cape Cod Bay survey area. Tracklines are color-coded by survey and seismic system. |
 |


