 |
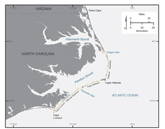
Figure 1. Map showing overview of study area with National Parks, inlets, and major water bodies identified. |
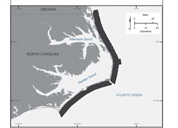 |
Figure 2. Map showing extent of inner shelf geophysical data coverage (False Cape, Virginia, to west of Cape Lookout, North Carolina).. |
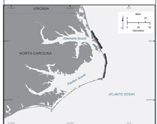 |
Figure 3. Map showing extent of nearshore geophysical data coverage (north of Oregon Inlet to Cape Hatteras). |
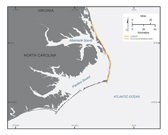 |
Figure 4. Map showing extent of ground-penetrating radar (GPR) and SWASH shoreline position surveys on barrier islands. |
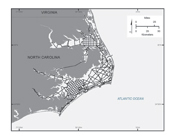 |
Figure 5. Map showing extent of back-barrier geophysical trackline data (Albemarle, Pamlico, and Core Sounds and tributaries). |
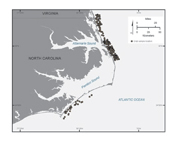 |
Figure 6. Map showing locations of USGS Van Veen sediment grab samples on the inner continental shelf. |
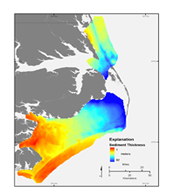 |
Figure 7. Map showing the thickness of Quaternary sediments (where mappable) in the study area. |
 |
Figure 8. Map showing the depth to the base of the interpreted lowstand erosional surface and major incised valleys in the study area. |
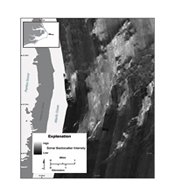 |
Figure 9. Map showing a region of coarse sediment (light gray to white) on the inner continental shelf off Hatteras Island. This region is nearly devoid of modern sediment and thus indicates exposure of Pleistocene deposits. |
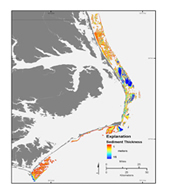 |
Figure 10. Map showing the thickness of modern sand on the inner continental shelf. |
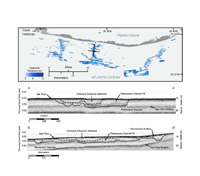 |
Figure 11. Map and seismic trackline data showing network of tidal creek lithosomes preserved on the inner continental shelf north of Cape Hatteras. |
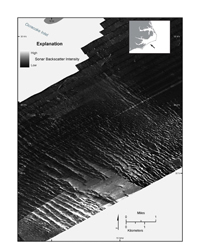 |
Figure 12. Map showing a region of sorted bedforms (Murray and Thieler, 2004) on the inner continental shelf off Ocracoke Inlet, between Cape Hatteras and Cape Lookout, as imaged by sidescan sonar. Coarse sediments are imaged as high acoustic backscatter (light gray to white); fine sediments are imaged as low acoustic backscatter (dark gray to black). |
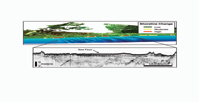 |
Figure 13. Perspective view from offshore, looking onshore near Kitty Hawk, North Carolina. The nearshore surveys in the coastal ocean off Kitty Hawk reveal a pattern of shore-oblique bars in the nearshore, shown as the “corrugated” pattern in the blue-toned bathymetric map. The bars likely influence nearshore wave characteristics and the resulting sediment transport and erosion on the beach. Alongshore variability in shoreline change is shown from SWASH surveys (see text for discussion). The shore-oblique bars appear to have an origin related to the presence of a variable shallow geologic framework, shown here in the seismic line as a large complex of cut and fill structures (arrows) related to the late Pleistocene course of the paleo-Roanoke River Valley Complex (PRVC; see text for discussion) that passes underneath Kitty Hawk. |

