USGS - science for a changing world

FISC - St. Petersburg

Coastal & Marine Geology Program > Center for Coastal & Watershed Studies > Professional Paper 1751

Systematic Mapping of Bedrock and Habitats along the Florida Reef Tract—Central Key Largo to Halfmoon Shoal (Gulf of Mexico)

USGS Professional Paper 1751

by Barbara H. Lidz, Christopher D. Reich, and Eugene A. Shinn

Introduction:
Table of Contents
Project Overview
Project Objective
Geologic Setting
Primary Datasets
Primary Products - Overview Maps & Evolution Overview:
Bedrock Surface map.
Introduction
Depth to Pleistocene Bedrock Surface
Reef & Sediment Thickness
Benthic Ecosystems & Environments
Sedimentary Grains in 1989
Summary Illustration Index Map
Evolution Overview
Tile-by-Tile Analysis
Satellite image of the Florida Keys showing location of tiles.
Organization of Report
Tiles: 1, 2, 3, 4,
5, 6, 7/8, 9/10,
11
Summary
Acknowledg-
ments
References
Disclaimer
Related
Publications

Tile 7/8

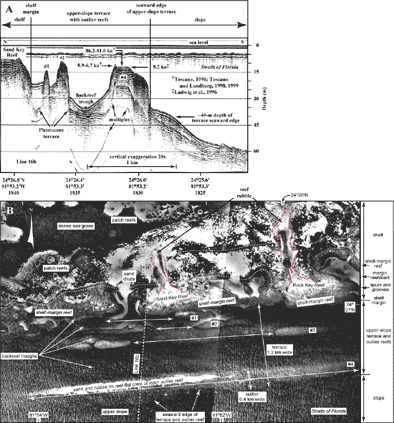
Rock Key and Sand Key Reefs: Rock Key and Sand Key Reefs are neighboring Holocene reefs located on the shelf edge west of Eastern Dry Rocks and southwest of Key West (Fig. 97C). The area is best known for the definitive multiple tracts of outlier reefs, referred to in the literature as the Sand Key outlier reefs. The term was coined to describe coral reefs that developed seaward of and are disconnected from a shelf margin by unfilled backreef troughs (Lidz et al., 1991). In line drawings traced from sparker profiles, Enos (1977, his Fig. 40) was the first to show that two such tracts existed in the Rock Key/Sand Key Reefs area. Three tracts were later documented seismically (Figs. 91B, 106A; Lidz et al., 1991). Four tracts were ultimately established photographically (Fig. 106B; Lidz et al., 2003; also see Benthic Ecosystems for Tile 7 and Tile 8).

(A) Original seismic documentation of three tracts of outlier reefs off Sand Key Reef southwest of Key West. (B) Aerial photo (1975) of Sand Key Reef area shows four tracts of outlier reefs and their sandy backreef troughs.
Figure 106. (A) Original seismic documentation of three tracts of outlier reefs off Sand Key Reef southwest of Key West (Fig. 91B; from Lidz et al., 1991). Numbered reefs correspond to numbered tracts in (B). Largest outlier, cored and dated (Ludwig et al., 1996; Toscano, 1996; Toscano and Lundberg, 1998), developed at the seaward edge of a broad upper-slope terrace. Note discontinuity of the Holocene section on the reef crest (see Fig. 107A). Also note reflection representing nearly flat terrace surface between the largest outliers and lack of reflections beneath the reefs. Coral reefs and reef rubble typically obscure sound-wave penetration to underlying rock surfaces. 'Multiples' are an artifact common in seismic-reflection data. These reflections replicate those of existing, overlying, geologic surfaces and should not be regarded as representing any subsurface stratigraphic horizon. ka = thousands of years. Latitude and longitude in degrees and decimal minutes based on GPS coordinates. Hours (military time) below coordinates serve as navigational correlation points along seismic line. (B) Original aerial-photo documentation (1975) of four tracts of outlier reefs (#1-4) and their sandy backreef troughs (from Lidz et al., 2003). Seismic line 16b in (A) just missed tract #3, as shown on photo (B). Note discontinuity of Pleistocene shelf-margin reef, and discontinuity and hummocky outlines of outliers. Also note landward patch reefs, linear Holocene spurs and grooves at seaward edge of Sand Key and Rock Key Reefs, and ovate zones of storm-transported reef rubble (red dotted lines) behind the two reefs. White dotted lines mark outer-shelf coral-rock ridges (e.g., Figs. 79A, 87A). Compare with geomorphic features in areas of major margin reentrants (Figs. 49A, 67). This key photo, diagnostic of the actual number of outlier-reef tracts present, is courtesy of Jim Pitts of the Department of Transportation in Tallahassee, Florida. [larger version]

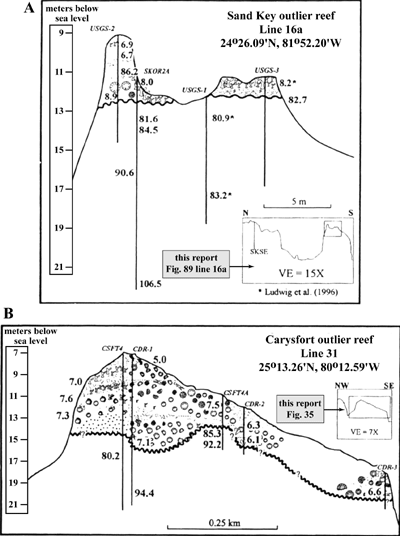
A 6.09-m-long core (USGS-1) was drilled in the center of the largest outlier (Fig. 89, line 16a). Conventional uncorrected 14C dates on recovered corals indicated they were older than 38 ka (Lidz et al., 1991). Later dated with high-precision radiometric methods, corals in that core yielded ages of ~83.2 and 80.9 ka (Ludwig et al., 1996). A nearby seaward core (USGS-3) yielded an age of 8.2 ka (Fig. 106A; Ludwig et al., 1996). Pleistocene corals beneath those dated at 8.2 ka yielded an age of 82.7 ka (Toscano, 1996). Toscano (1996) drilled an additional core (SKOR2A) through the seaward base of a coral pinnacle landward of the USGS-1 core and obtained high-precision radiometric ages ranging from 106.5 to 81.6 ka in the Pleistocene section and 8.0 ka at the top. In a discussion of sea-level fluctuations during deep-sea oxygen-isotope Stage 5 (Fig. 37), Toscano and Lundberg (1999) correlated the Pleistocene ages with high sea-level stands during substages 5c (106 ka), 5b (94-90 ka), and 5a (88-80 ka). A core through the center of the pinnacle (USGS-2) yielded ages from 8.9 to 6.7 ka and a reworked coral clast with an age of 86.2 ka (Toscano and Lundberg, 1998).

Coring showed that the pinnacle was composed of cemented coral rubble. Scuba divers can see its composition in a 3-m-high outcrop on its seaward side, where the rubble is layered (E.A. Shinn, personal observation). It is believed that the pinnacle is the remnant of a rubble field that formed when sea level was at about the same elevation as the top of the pinnacle. At that time, the rubble field extended from the seaward Holocene reefs across the top of the outlier reef and was spilling into its backreef trough. With rising sea level and increasing wave energy, the uncemented parts of the field in the middle of the outlier reef were eroded down to the Pleistocene surface (Fig. 106A). Ages and locations of Holocene corals in the seaward reefs indicated coral growth had backstepped with rising sea level (i.e., younger corals grew upward and landward over older corals).

In a comparison of outlier-reef ages, cores were also obtained in a landward-oriented transect across the Carysfort outlier reef off north Key Largo (upper Keys; Figs. 97B, 107B; Toscano, 1996; Toscano and Lundberg, 1998). As on the Sand Key outlier reefs, Holocene coral accretions on the Carysfort outlier are thicker (6-7 m) on the landward crest than on the seaward forereef slope (2-3 m). Coral dates on the Carysfort outlier confirm at least one instance where Pleistocene corals backstepped ~0.25 km between 85.3 and 80.2 ka (Fig. 107B). Several other dates show that Holocene coral growth advanced seaward more than 0.5 km before backstepping toward the end of accrual (Toscano and Lundberg, 1998).

Schematic cross sections of outlier reefs derived from seismic and core data
Figure 107. Schematic cross sections of outlier reefs derived from seismic and core data (modified from Toscano and Lundberg, 1998; landward direction is to left; Straits of Florida are to right). Non-asterisked Pleistocene ages are from Toscano (1996). (A) Cross section of the primary outlier off Sand Key Reef (lower Keys) shows comparatively thin discontinuous Holocene accretions on top of ~80-ka corals. (B) Cross section of the Carysfort outlier reef (upper Keys) shows generally thicker and more extensive Holocene accumulation on top of ~80-ka corals. Coral ages from both sites indicate reef growth ended in the mid-Holocene but not at the same time. The Carysfort corals are ~2 ka younger than the Sand Key corals. VE = vertical exaggeration. [larger version]

The differences in Holocene thickness and coral ages between the Carysfort and Sand Key outlier reefs reflect several factors relating to geographic location and a lower bedrock elevation to the southwest than northeast (see Bedrock Surface map).

  • The shelf flooded sooner in the lower than upper Keys, inducing earlier soil erosion and turbidity in the area of the Sand Key outliers than at the Carysfort outlier.

  • Shallow shelf waters reached the Sand Key corals through wide tidal passes in the lower and middle Keys, but a paucity of natural passes through the upper Keys protected the Carysfort corals.

  • Rate of sea-level rise was comparatively rapid in the early Holocene, drowning the deeper Sand Key outliers by removing them from the photic zone. A slowed rate of rise at about 7 ka allowed the Carysfort outlier to continue growing another 2 ka (Toscano and Lundberg, 1998; Figs. 102A, 106A, 107B).

  • Because of location at the open-ocean end of the Florida Keys chain where the Gulf of Mexico and Atlantic Ocean meet, the Sand Key outliers were subjected to greater cold-water stress than the Carysfort outlier, resulting in a thinner Holocene section.

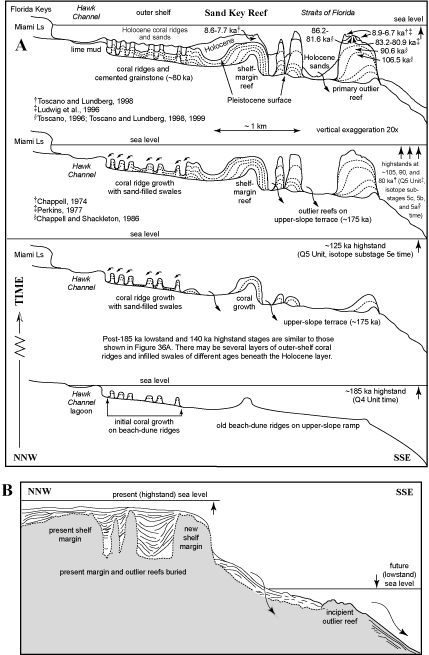
The Sand Key Reef area is one of four shelf-margin sites for which an evolutionary cross-sectional model was developed based on seismic and coral-age data correlated with sea-level maxima (Figs. 37, 108A; Lidz, 2004). The models depict the origin, timing, development, and changes in surface landforms, i.e., the geomorphogeny. Methods for model construction are given in the discussion of Carysfort Reef (Fig. 36A). The other two sites modeled are The Elbow (Fig. 40A) and Pelican Shoal (Fig. 96A).

Geomorphogenic model of the Sand Key Reef area
Figure 108. (A) Geomorphogenic model of the Sand Key Reef area shows a Pleistocene backstepped reef complex at the shelf margin and Holocene backfilled progradation of the shelf margin (terms proposed by Lidz, 2004; ages >125 ka modified from Lidz, 2004; see Carysfort Reef section for explanation of how model was developed). Note bands of outer-shelf coral ridges. Rendition showing three tracts of outlier reefs is based on seismic data (Figs. 89, line 16b, 91B, 106A; Lidz et al., 1991). Aerial-photo data document four discontinuous tracts (Fig. 106B; Lidz et al., 2003). Ls = limestone. ka = thousands of years. Holocene = the most recent 10 ka. Q1-Q5 Units = names assigned by Perkins (1977) to the five marine sections that compose the most recent part of the south Florida Pleistocene rock record. Marine-isotope substages refer to periods of time that correspond to major changes in the paleotemperature record (Fig. 37A, 37B). Long curved arrows indicate offshelf sediment transport. Short curved arrows indicate landward sediment transport and infilling of backreef troughs. (B) With continued accumulation of sediments, the future seismic record could indicate a progradational margin with multiple lateral sections of landward- and seaward-dipping beds between multiple buried parallel facies of coalesced reef complexes (Lidz, 2004). New outlier reefs may form in front of the present reef complexes. Long curved arrows indicate direction of sediment transport (to the south and west, off the shelf). [larger version]

Comparison of the four models indicates that Pleistocene development of the shelf-edge reef was the same (upward and landward, partly filling a backreef trough) at The Elbow (north) and Pelican Shoal (south) and the same (upward, landward, and seaward) at Carysfort Reef (north) and Sand Key Reef (south). In each case, the Pleistocene component represents a backstepped reef-complex margin (Fig. 108A).

Landward growth is also suspected in the primary Sand Key outlier reef. The nearly 1-km-wide base of the largest Sand Key outlier (Fig. 108A) implies initial presence of an extensive reef flat, or gradual development of one over which corals later backstepped. Pleistocene coral dates from three outlier-reef cores confirm that backstepping took place at 81.6 and 80.9 ka (Fig. 106A; Toscano and Lundberg, 1998). Backstepped Holocene reefs on the shelf are well documented (e.g., Shinn, 1980a; Lidz et al., 1985).

Interpreting this type of margin in seismic profiles across an ancient platform can be problematic, because contacts between seismic coral facies would dip landward (Fig. 108B). Based on dip and absent other data indicating orientation relative to an ancient sea, evolution could be misinterpreted as seaward growth.

Coastal & Marine Geology Program > Center for Coastal & Watershed Studies > Professional Paper 1751

Accessibility FOIA Privacy Policies and Notices

Take Pride in America logo USA.gov logo U.S. Department of the Interior | U.S. Geological Survey
URL: [disc] /pubs/pp/2007/1751/professional-paper/tile7-8/rock-key.html
Page Contact Information: Feedback
Page Last Modified: December 01, 2016 @ 04:15 PM (JSS)