![]()
![]()
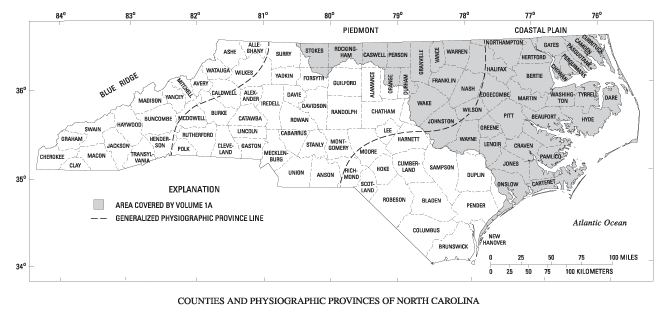
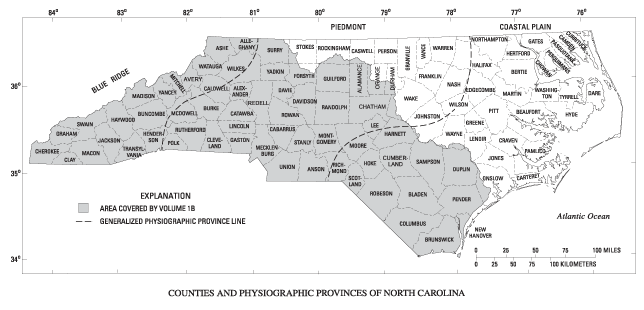
Counties and Physiographic Provinces of North Carolina
Volume A GIF · PDF (157K)
Volume B GIF · PDF (146K)
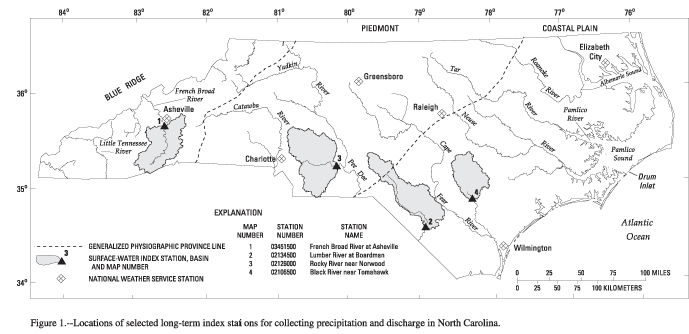
Figure 1. Locations of selected long-term index stations for collecting precipitation and discharge in North Carolina
GIF · PDF (239K)
Figure 2. Monthly precipitation for the 2003 water year and mean monthly precipitation for the period 1971-2000 at index stations
GIF · PDF (126K)
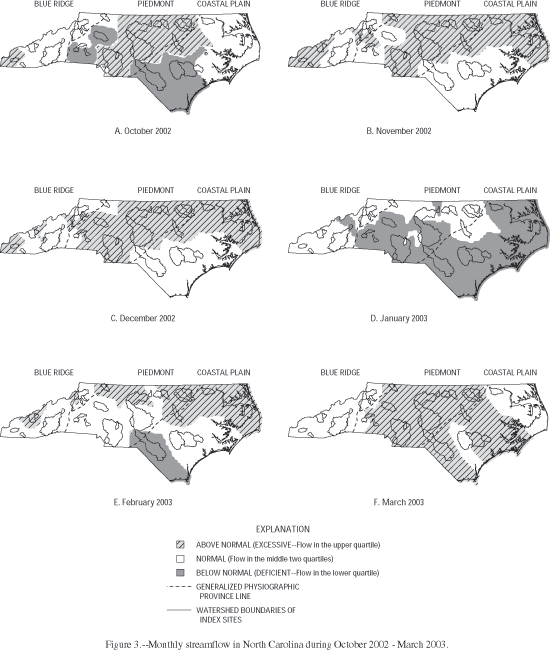
Figure 3. Monthly streamflow in North Carolina during October 2002-March 2003
GIF · PDF (341K)
Figure 4. Monthly streamflow in North Carolina during April-September 2003
GIF · PDF (330K)
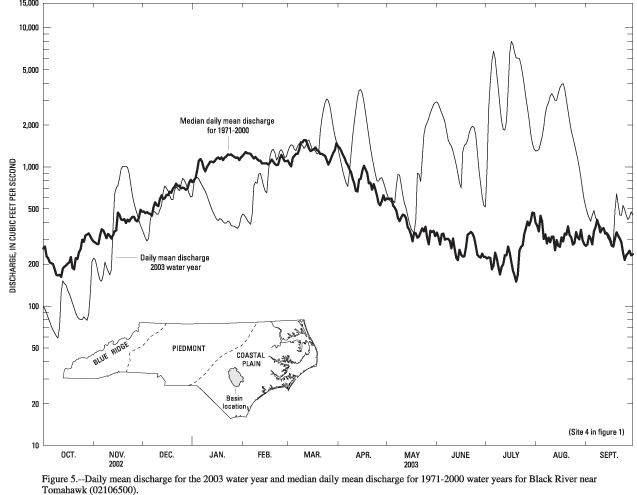
Figure 5. Daily mean discharge for 2003 water year and median daily mean discharge for 1971-2000 water years for Black River near Tomahawk
GIF · PDF ( 78K)
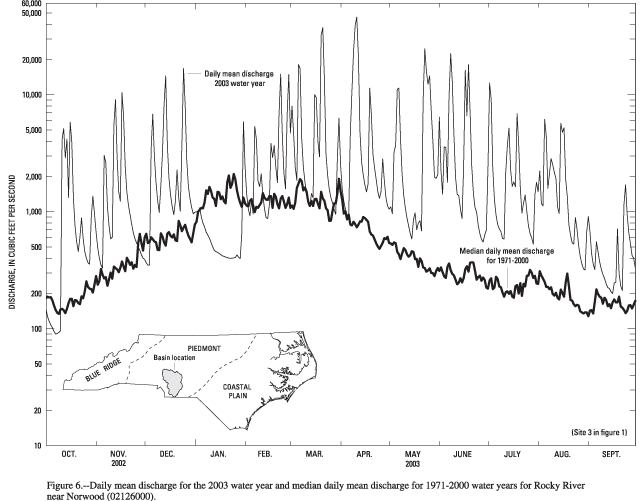
Figure 6. Daily mean discharge for 2003 water year and median daily mean discharge for 1971-2000 water years for Rocky River near Norwood
GIF · PDF ( 81K)
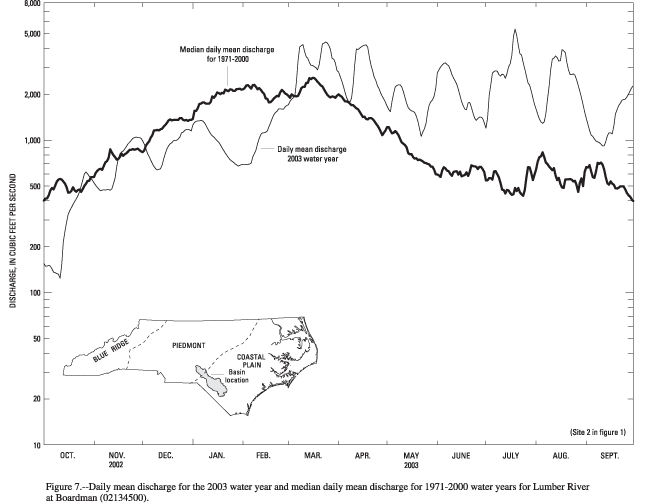
Figure 7. Daily mean discharge for 2003 water year and median daily mean discharge for 1971-2000 water years for Lumber River at Boardman
GIF · PDF ( 80K)
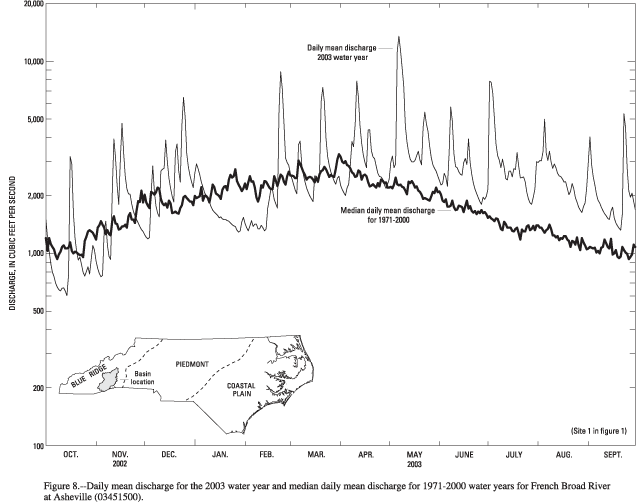
Figure 8. Daily mean discharge for 2003 water year and median daily mean discharge for 1971-2000 water years for French Broad River at Asheville
GIF · PDF ( 80K)
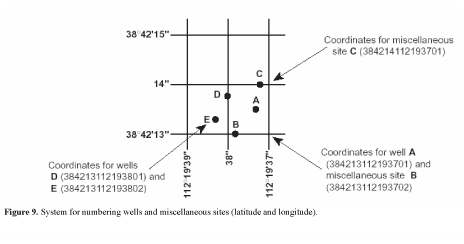
Figure 9. System for numbering wells and miscellaneous sites
GIF · PDF ( 73K)
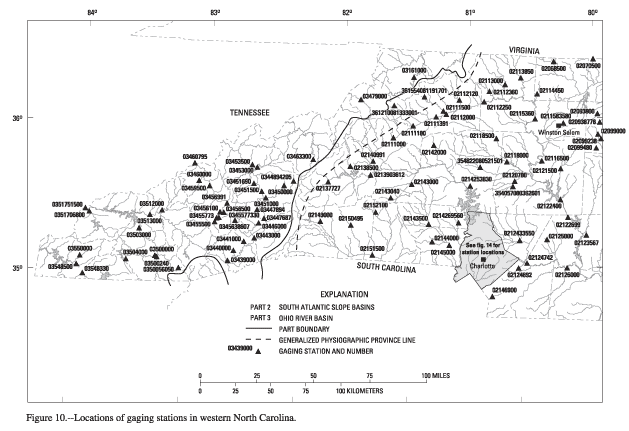
Figure 10. Locations of gaging stations in western North Carolina
GIF · PDF (317K)
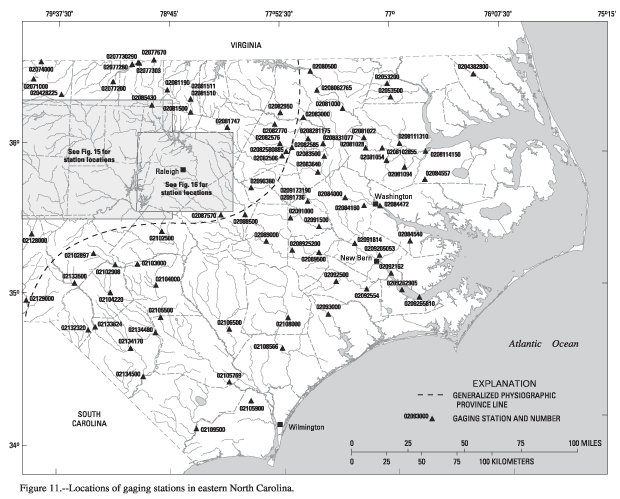
Figure 11. Locations of gaging stations in eastern North Carolina
GIF · PDF (328K)
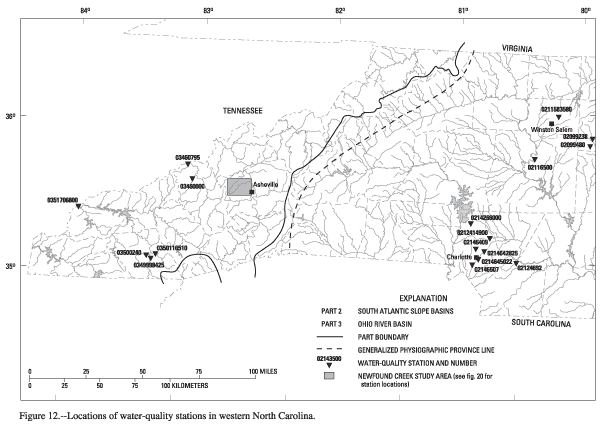
Figure 12. Locations of water-quality stations in western North Carolina
GIF · PDF (152K)
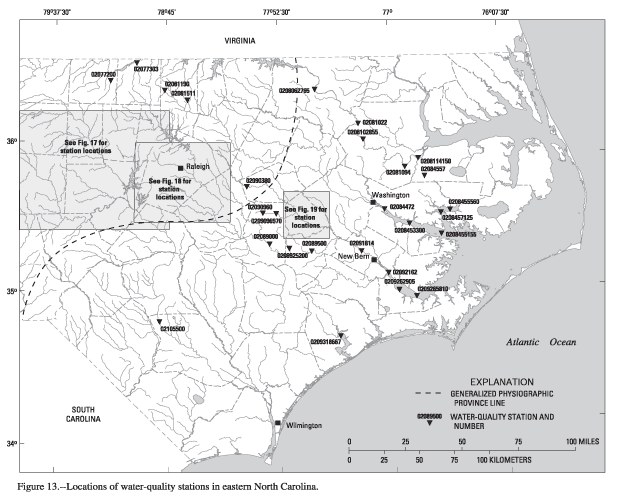
Figure 13. Locations of water-quality stations in eastern North Carolina
GIF · PDF (232K)
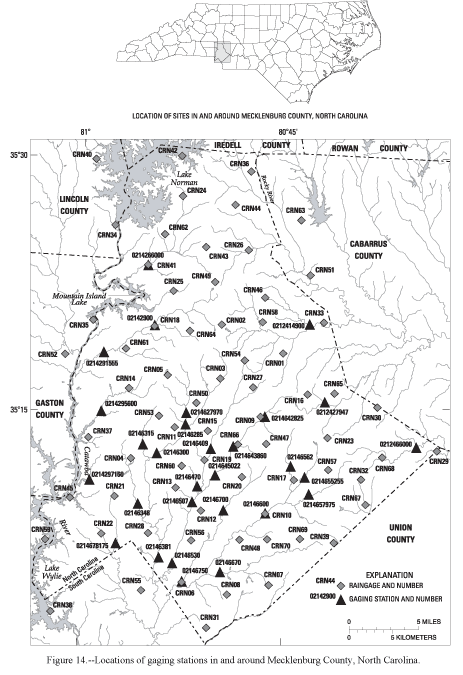
Figure 14. Locations of gaging stations in and around Mecklenburg County, North Carolina
GIF · PDF (376K)
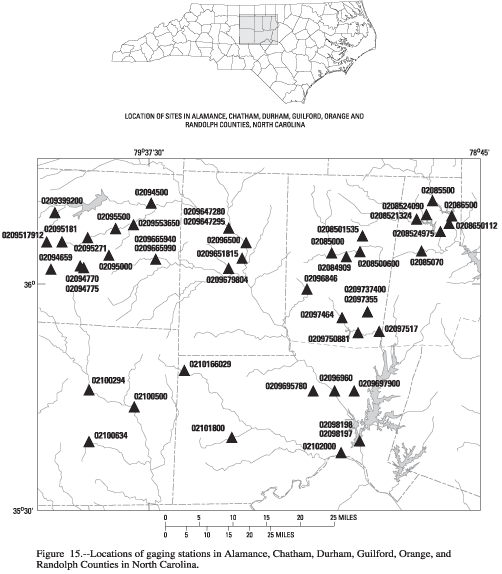
Figure 15. Locations of gaging stations in and around Alamance, Chatham, Durham, Guilford, Orange, and Randolph Counties Counties in North Carolina
GIF · PDF (136K)
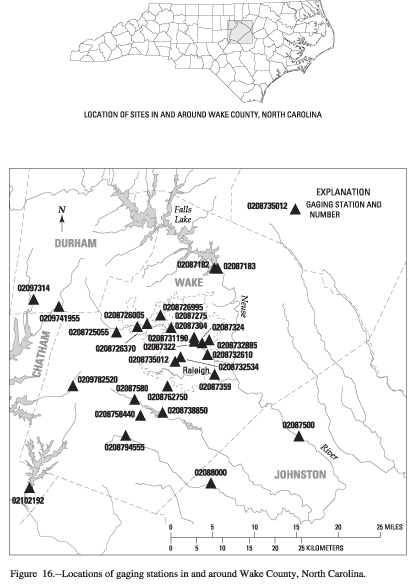
Figure 16. Locations of gaging stations in and around Wake County, North Carolina
GIF · PDF (112K)
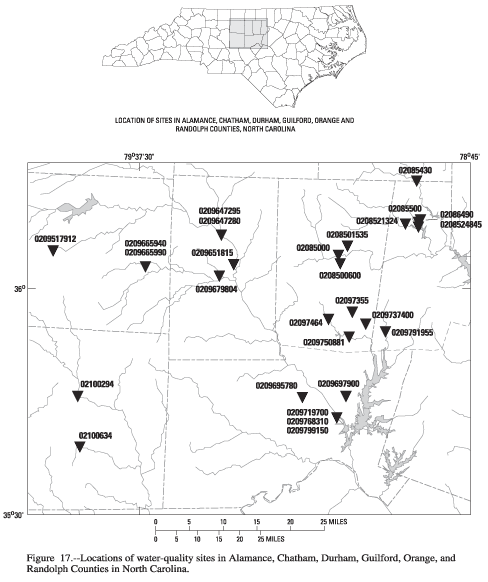
Figure 17. Locations of water-quality sites in and around Alamance, Chatham, Durham, Guilford, Orange, and Randolph Counties Counties in North Carolina
GIF · PDF (117K)
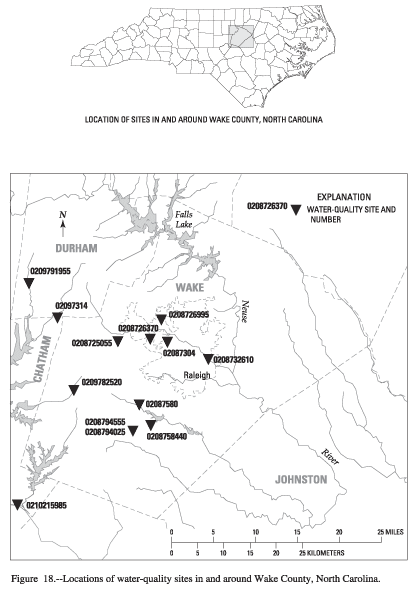
Figure 18. Locations of water-quality sites in and around Wake County, North Carolina
GIF · PDF ( 94K)
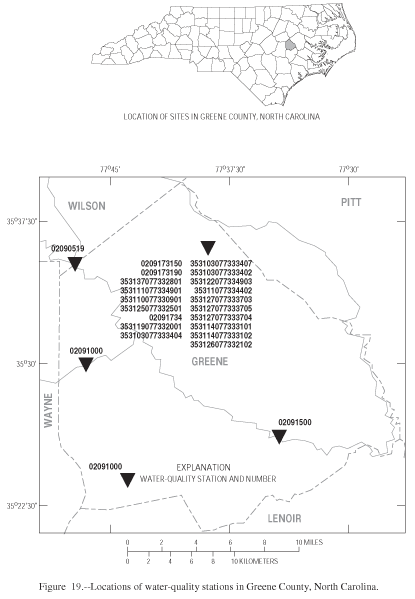
Figure 19. Locations of water-quality stations in Greene County, North Carolina
GIF · PDF ( 31K)
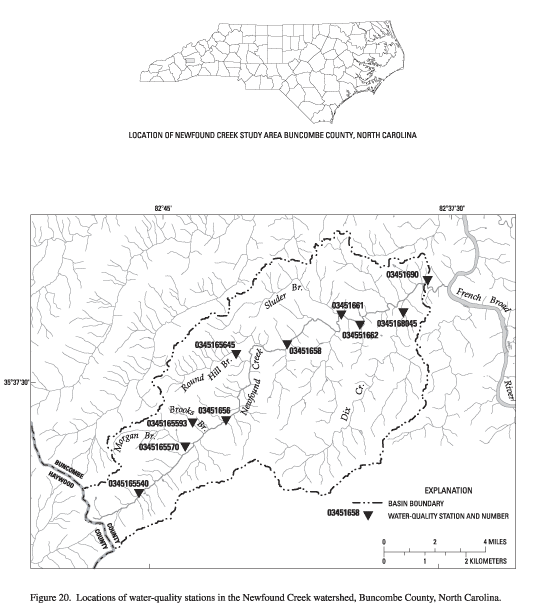
Figure 20. Locations of water-quality stations in the Newfound Creek watershed, Buncombe County, North Carolina
GIF · PDF (234K)
![]()
Return to WY 2003 Annual Data Report Home Page
![]()