![]()
Nutrients are an important indicator of surface water quality because inorganic nitrogen (nitrate and ammonia) and phosphorus control the growth of aquatic plants (p. 18). Excessive growth of aquatic plants can cause dissolved oxygen concentrations in streams to decrease during the night to levels that may not sustain certain species of fish.
In streams of the Central Columbia Plateau, naturally occurring levels of these essential nutrients have been increased as a result of land use practices. Inorganic nitrogen, which is water soluble, enters surface waters directly in runoff from agricultural fields treated with fertilizer, or indirectly via ground water. Phosphorus, also used as a fertilizer, is relatively insoluble and binds to soil particles, entering surface waters as a result of erosion. Nutrients also enter surface waters from feedlots and wastewater- treatment plants, either through runoff or via ground water in the case of land-applied waste.
Understanding the distribution of nutrients in surface waters permits managers to better identify best management practices (BMPs) that can improve water quality.
Seasonal variations in concentrations of nutrients are influenced by land use and by natural and human factors that cause variations in streamflow. For example, in the Quincy-Pasco subunit, high streamflows are from April through October, coinciding with the delivery of large quantities of irrigation water withdrawn from the Columbia River. Excess irrigation water, which contains low concentrations of nitrate, discharging to wasteways and drains dilutes nitrate present at high concentrations in ground water discharging to surface waters (see p. 8). Therefore, concentrations in surface waters are lowest in summer when delivery of irrigation water is at a peak (fig. 34).
Figure 34. Nitrate concentrations in the Quincy-Pasco subunit are lowest in summer and highest in winter when irrigation water is not being delivered.
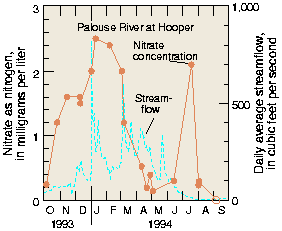
In the Palouse subunit, concentrations of nitrate in surface waters are highest during winter when storm runoff transports nitrogen from fields to streams (fig. 35). Lower concentrations of nitrate in surface waters during the summer are caused by lower nitrate concentrations in ground water discharging to streams and uptake by plants.
Figure 35. Nitrate concentrations in the Palouse subunit are highest in winter because of fall fertilizer applications and storm runoff.
As shown in figure 36, annual variation of inorganic nitrogen and phosphorus concentrations is related to land use. Phosphorus concentrations are generally less variable than nitrogen concentrations and are also generally lower in agricultural streams because phosphorus is applied to crops at a much lower rate and it binds with soil particles, thereby reducing its transport to surface waters.
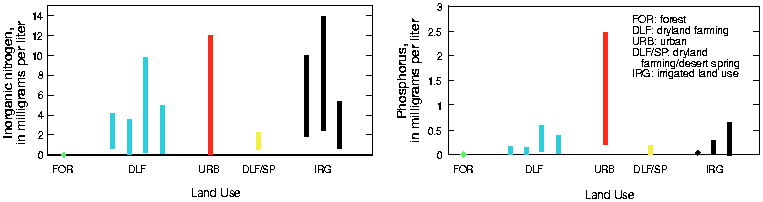 Figure 36.
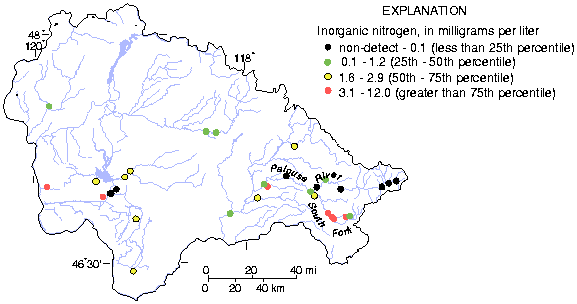
Inorganic nitrogen concentrations vary widely in streams in the dryland and irrigated agricultural and urban land use areas. In contrast, phosphorus concentrations are less variable throughout the year except at the urban land use sites, which are downstream from wastewater-treatment plant discharge to the South Fork of the Palouse River. (Each bar represents an annual range of concentrations at one site within that land use.)
Figure 36.
Inorganic nitrogen concentrations vary widely in streams in the dryland and irrigated agricultural and urban land use areas. In contrast, phosphorus concentrations are less variable throughout the year except at the urban land use sites, which are downstream from wastewater-treatment plant discharge to the South Fork of the Palouse River. (Each bar represents an annual range of concentrations at one site within that land use.)
Concentrations of nitrogen are most critical to aquatic life during the summer when aquatic plant growth is highest. Sites with the highest summertime concentrations include the wastewater- dominated South Fork of the Palouse River in the Palouse subunit and several irrigated streams in the Quincy-Pasco subunit (fig. 37) [33].
Figure 37. Sites with the highest summertime concentrations of inorganic nitrogen are in the South Fork of the Palouse River, which is dominated by wastewater discharge, and several streams in the Quincy-Pasco subunit [33].
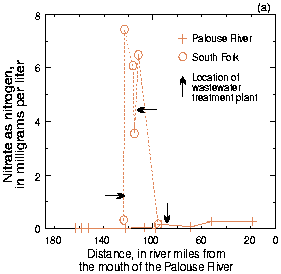
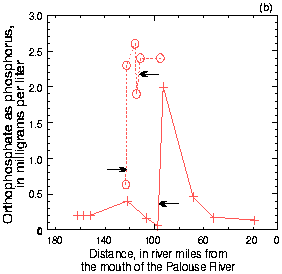
Discharge of treated wastewater during summer low flow elevates concentrations of nitrogen and phosphorus, resulting in eutrophication of the South Fork of the Palouse River (fig. 38). During the summer, plants in the South Fork increase to excessive amounts. Nitrogen is reduced in the lower river because of uptake by these aquatic plants whereas phosphorus concentrations are greater than what is required by plants, so concentrations in water remain high. The high phosphorus can be due to low oxygen conditions during the summer, which cause sediments to release phosphorus.
Figure 38. Summertime concentrations of (a) nitrogen and (b) phosphorus in the South Fork of the Palouse River (sampled August 1994) are elevated above levels at other sites on the river.
|
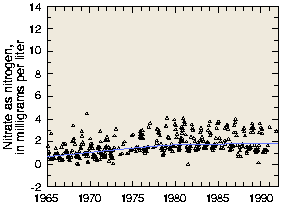
Concentrations of nitrate in the Palouse River have not changed significantly since 1965, which reflects the consistent land use (dryland agriculture) over time [33]. Figure 39. Nitrate trends in Palouse River at Hooper, Palouse subunit. |
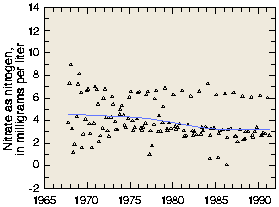
Nitrate has increased in Crab Creek because the acreage of irrigated land and therefore fertilizer application has increased. Figure 40. Nitrate trends in Crab Creek at Beverly, Quincy-Pasco subunit. |
Nitrate in Crab Creek Lateral has decreased, probably because of an increase in acreage of orchards, which require less fertilizer than row crops.
Figure 41. Nitrate trends in Crab Creek Lateral, Quincy-Pasco subunit.