
MAJOR FINDINGS
Bacteria in the Upper Tennessee River Basin
Fecal indicator bacteria are the most frequent and widespread water-quality standard exceedances involving potential adverse effects to human health in the Upper Tennessee River Basin. The indicator bacteria themselves usually are harmless and easy to detect, but they are indicators of the presence of fecal material and have been shown to be associated with some waterborne disease-causing organisms. The presence of indicator bacteria, however, cannot be considered direct proof of any threat to human health, and research is underway to find better indicators.
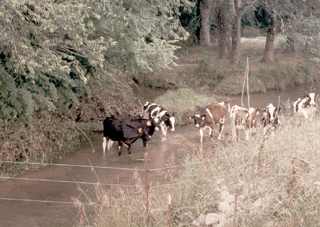 |
| Livestock are a major contributor to fecal coliform levels in area streams. |
 |
| In Upper Tennessee River Basin urban areas, deteriorated sewerage systems and combined sewer overflows produce elevated fecal coliform levels. |
Bacterial Counts Frequently Exceed Standards
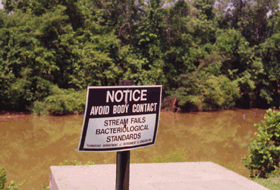
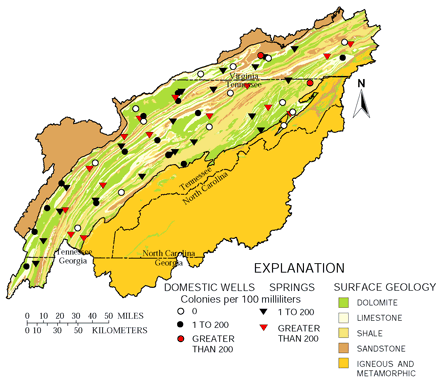
The State of Tennessees current water-quality standards are based on a total fecal coliform level of 200 colonies per 100 milliliters of water, as a mean value.(9) This value is commonly exceeded in agricultural and urban streams in the Upper Tennessee River Basin (fig. 10). In agricultural areas, livestock waste is the most likely bacterial source both from allowing livestock direct access to streams and runoff from animal-waste areas. Bacterial counts generally increase during higher streamflows associated with runoff events in the agricultural areas (fig. 11).
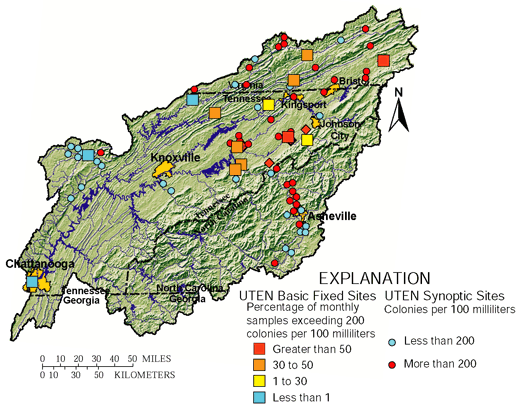 |
| Figure 10. Fecal coliform bacteria frequently exceed standards in Upper Tennessee River (UTEN) streams. |
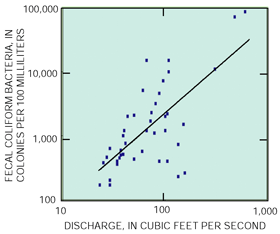 |
| Figure 11. Fecal coliform counts vary with streamflow at Big Limestone Creek in Tennessee. |
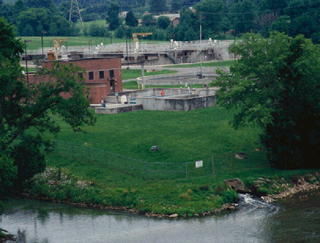
Deteriorated and leaky sewage systems, faulty sewage treatment plants, urban runoff, and combined sewer overflow systems are among the sources of bacterial contamination in many urban streams. For example, all of the urban streams draining the central Knoxville, Tennessee, area regularly exceed bacterial standards(10) because of widespread leakage from very old and deteriorating sewer systems in the older parts of the city. Replacement in 1998 of an obsolete combined sewer overflow system for one city neighborhood, however, has improved conditions for that neighborhood and adjacent parts of Fort Loudon Reservoir. These conditions highlight the continuing need for infrastructure improvements, especially in older urban areas.
Bacteria Frequently Are Detected in Domestic Wells and Springs
A common misconception is that untreated ground water from wells and springs generally is safe for consumption because percolation through the soil removes most contaminants. While the soil can act as a natural filter, this does not guarantee the absence of contaminants. In fact, about half of the waterborne-disease outbreaks in the United States since 1900 have involved contaminated ground water.(11)
Ground-water systems such as the carbonate systems of the Upper Tennessee River Basin are particularly susceptible to contamination from surface sources. Ground-water flow paths in these systems usually are shallow, principally involving the upper 10 to 20 feet of highly fractured and heavily weathered rock. In addition, the common presence of bedrock outcrops, areas of thin overburden, and karst features such as sinkholes provide direct avenues for aquifer contamination (fig. 12). Other potential sources for bacterial contamination include faulty or poorly placed septic systems and poor well construction or sanitation practices.
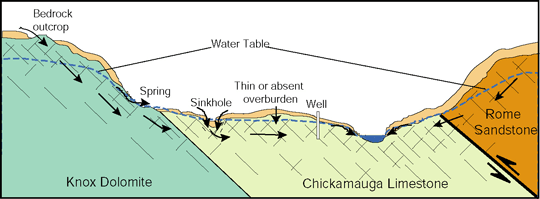 |
| Figure 12. Upper Tennessee ground-water flow systems can be affected by a number of potential contamination sources such as sinkholes, outcrops of bedrock, and areas with thin overburden. (Not to scale) |
For finished drinking water, the detection of as few as 4 coliform bacteria colonies per 100 milliliters (col/100 mL) or the detection of 1 col/100 mL of fecal coliform bacteria, or E. coli, warrants concern for human health.(12) Of 30 domestic wells used as sources for untreated drinking water, 11 (37 percent) exceeded the total coliform drinking-water standard and 9 (30 percent) the E. coli drinking-water standard (fig. 13). The highest E. coli value detected was 1,600 col/100 mL.
 |
| Figure 13. Coliform bacteria are often detected in Upper Tennessee River Basin ground water. |
Total coliform values for 35 springs sampled in the Upper Tennessee River Basin ranged from 10 to 1,900 col/100 mL and E. coli ranged from 0 to 660 col/100 mL. All of the springs tested exceeded drinking-water standards for total coliform bacteria, and 95 percent of the springs exceeded the E. coli standard. Two springs exceeded the E. coli body-contact standard of 126 col/100 mL. Sixteen of the 35 springs are used as domestic water supplies and others are used for filling water containers by the roadside with what usually is believed to be clean mountain spring water.
 |
| Most of the rural population in the Upper Tennessee River Basin depend on shallow domestic wells for water supply. |
 |
| Although much of the public perceives them as clean sources of drinking water, springs are very susceptible to contamination. |
Nutrients in the Upper Tennessee River Basin
Nutrients are nitrogen and phosphorus compounds that are essential for plant growth. When found at elevated concentrations, however, nutrients can degrade water quality. The enrichment of a water body with nutrients, called eutrophication, can result in dense, rapidly multiplying growths, or blooms, of algal species and other nuisance aquatic plants. These can clog water intake pipes and filters and interfere with recreational activities, such as fishing, swimming, and boating. Subsequent decay of algal blooms can overload water bodies with oxidizable debris and result in foul odors, bad taste, and reduced dissolved oxygen levels, which are harmful to other aquatic life.(13)
Nutrients in the Upper Tennessee River Basin originate from point and nonpoint sources. Point sources are typically piped discharges from wastewater-treatment facilities and large urban and industrial stormwater systems. Nonpoint sources include stormwater runoff from urban and agricultural areas. In the Upper Tennessee River Basin, applications of synthetic fertilizers and manure are major sources.
Nutrient Loadings and Yields Vary among Upper Tennessee River Subbasins
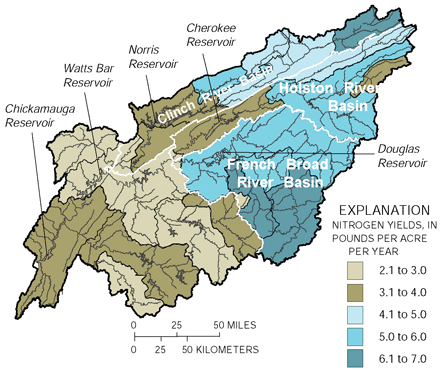 |
| Figure 14. Mean annual total nitrogen yields between 1973 and 1993 were highest in the upper French Broad and upper Clinch River Basins. |
Nutrient loadings in the Upper Tennessee River subbasins are primarily influenced by land use and streamflow conditions. Loads were estimated by using a constituent transport model and multiple regression to relate streamflow to the concentration of a water-quality constituent to derive loads.(14) Twenty-three stations with adequate streamflow and chemical records were used for nitrogen calculations and 20 for total phosphorus.
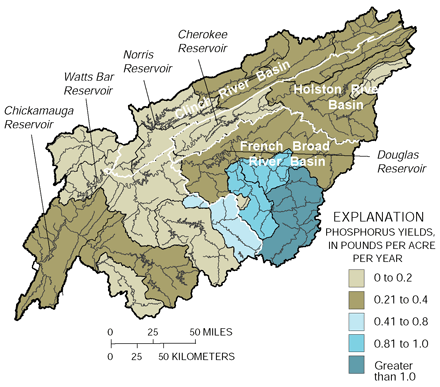
The highest yields in the study area for both nutrient species were detected in the French Broad River Basin, particularly the upstream portion that includes Asheville, North Carolina (figs. 14 and 15). The French Broad River, as a whole, accounted for about 40 percent of the 138,000 pounds per day (lb/d) average annual total nitrogen load(15) and about 25 percent of the 13,500 lb/d average annual total phosphorus load,(16) leaving the basin at Chattanooga, Tennessee. The Holston River Basin added another 22 percent of the total nitrogen load but only 8 percent of the total phosphorus load.
A combination of agricultural and urban runoff is probably responsible for conditions in the French Broad River. In addition, the French Broad River and its tributaries have a history of water-quality problems associated with industrial point-source discharges. These basins also had the highest yields and loadings in the Upper Tennessee River Basin for total ammonia and organic forms of nitrogen.
 |
|
| Figure 15. Mean annual total phosphorus yields between 1973 and 1993 were highest in the upper French Broad River Basin. |
Nutrient loadings and yields generally were lowest in those basins with relatively low percentages of agricultural land use and at sites directly downstream from tributary reservoirs. The fate of nutrients in the reservoirs depends on the physical characteristics of the reservoir (volume, surface area, depth, and hydraulic retention time) and its trophic state.(17) The tributary reservoirs in the Upper Tennessee River Basin commonly function as sinks for nutrient species by providing a favorable environment for nitrogen transformation and by efficiently trapping both dissolved and sediment-bound phosphorus. Outflow loads of total phosphorus below Norris Lake on the Clinch River, for example, were 37 percent of the inflow load from the Clinch and Powell River Basins. Load estimates for the Holston River upstream and downstream from Cherokee Reservoir similarly indicate that the reservoir traps about 46 percent of the incoming load of total phosphorus. In contrast, less trapping occurs in the main-stem reservoirs, which are predominantly flow-through systems with limited storage capacity and relatively short residence times. Outflow phosphorus loads downstream from Chickamauga and Watts Bar Reservoirs significantly exceeded the inflow loads from upstream drainages. The increased loads can be attributed to low rates of trapping as well as additional input from ungaged areas adjacent to the reservoirs.(16)
Nutrient Concentrations and Yields Vary with Land Use
The relation between total nitrogen concentrations and land-use percentages was investigated for 87 sites in the Upper Tennessee River Basin and was found to be statistically significant. Stations in forested watersheds had the lowest concentrations of total nitrogen, whereas stations in agricultural areas had the highest. Concentrations of nitrogen in urban and mixed land-use areas were significantly greater than forested watersheds but were somewhat less than nitrogen concentrations in agricultural watersheds. Total nitrogen concentrations tended to increase with increased development whether agricultural or urban (fig.16).(15)
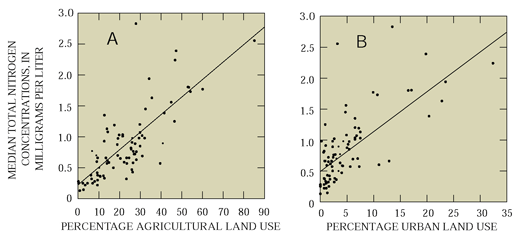 |
| Figure 16. Median total nitrogen concentrations can be related to (A) agricultural and (B) urban land uses. |
Nitrogen sources also were investigated by using regression analysis between annual basin yields and total annual inputs from fertilizer, animal waste, wastewater discharges, and atmospheric deposition. For total nitrogen, basin yields significantly and positively correlated with agricultural inputs but only weakly correlated with wastewater discharges and atmospheric inputs. This tends to identify agricultural land use as the major contributor to annual instream nitrogen yields.(18)
The relation between total phosphorus concentrations and land-use percentages also were investigated for 83 sites in the Upper Tennessee River Basin. Although the relation was not quite as clear as with nitrogen, statistically significant increases in total phosphorus concentrations also accompanied increased development whether urban or agricultural (fig. 17). As with total nitrogen, the lowest phosphorus concentrations were detected at sites in predominantly forested watersheds, whereas sites in urban and agricultural areas had the highest phosphorus concentrations.(16)
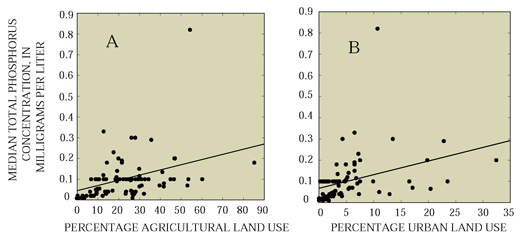 |
| Figure 17. Median total phosphorus concentrations can be related to (A) agricultural and (B) urban land uses. |
Phosphorus sources also were investigated by using calculated basin yields and total annual inputs from fertilizer, animal waste, wastewater discharges, and the atmosphere. Phosphorus yields were found to strongly correlate with wastewater discharges but not with the agriculturally related input categories. This suggests that wastewater discharges may account for most of the total phosphorus load in basin streams (J.F. Connell, U.S. Geological Survey, written commun., October 20, 2000). Agriculturally applied phosphorus may be assimilated quickly by area soils thereby reaching area streams slowly if at all.
 |
| Agricultural land uses appear to account for most of the total nitrogen loads to area streams. |
 |
| Wastewater discharges appear to account for most of the total phosphorus in Upper Tennessee River Basin streams. |
|
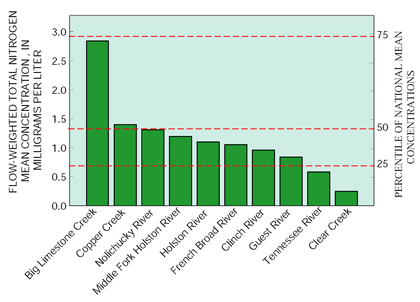
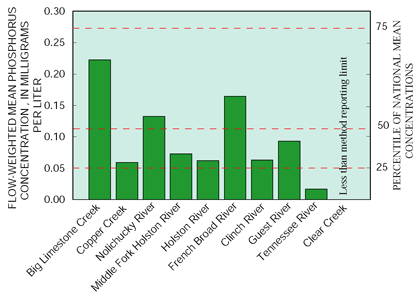
Although nutrient concentrations and loadings are a concern in parts of the Upper Tennessee River Basin, concentrations generally are low for most area subbasins when compared with national averages. Mean total nitrogen concentrations exceeded or equaled the national median values only for three agricultural sites: Big Limestone Creek (83 percent agricultural), Copper Creek (51 percent agricultural), and the Nolichucky River (39 percent agricultural). Similar results were obtained for total phosphorus at Big Limestone Creek and the Nolichucky River, but the French Broad River flowing into Tennessee from North Carolina also exceeded the national median value. Although relatively low, mean total phosphorus concentrations at most sites exceeded the U.S. Environmental Protection Agency (USEPA) goal of 0.05 mg/L total phosphorus for surface water entering reservoirs.
|

 |
|
| Nonurban residential development in the Blue Ridge Mountains is most likely the largest contributor to increasing total nitrogen concentrations. |
Nitrogen Species Changed by Wastewater Treatment
Prior to the widespread implementation of wastewater treatment, nitrogen loadings for most Upper Tennessee River Basin streams primarily consisted of reduced species such as ammonia and various organic forms. These nitrogen species generally are undesirable in surface water because of associated color changes and decreases in dissolved oxygen levels. In addition, under certain conditions, ammonia nitrogen can be highly toxic to aquatic life. Wastewater-treatment facilities convert these undesirable forms to the oxidized species, nitrite and nitrate.
At the Tennessee River at Chattanooga, Tennessee, as with most major streams in the Upper Tennessee River Basin, the ratio of reduced to oxidized nitrogen species began to change in the late 1970s (fig. 18), corresponding to the implementation of wastewater-treatment facilities. By about 1983, the oxidized nitrogen species, nitrate and nitrite, became the predominant forms of nitrogen discharged from the basin, a trend which has continued to the present.
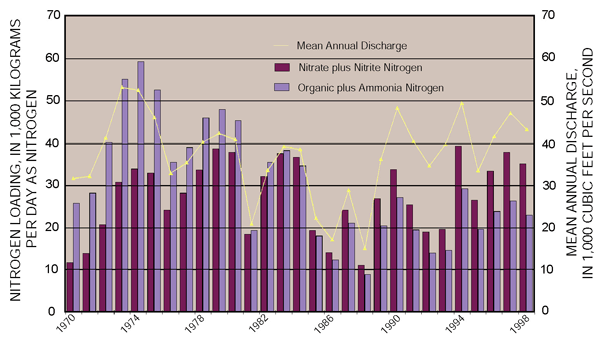 |
| Figure 18. The predominant nitrogen species changed at the Tennessee River at Chattanooga, Tennessee, between 1970 and 1998. |
Loading Trends Increase in Parts of the Upper Tennessee Basin
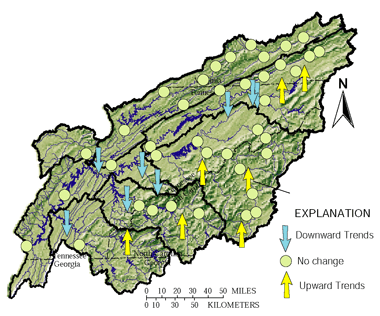 |
| Figure 19. Total nitrogen increased in parts of the Upper Tennessee River Basin between 1970 and 1993. |
Trend analyses for 56 stations using the seasonal Kendall statistical analysis test indicated significant increases in total nitrogen at seven sites in the Upper Tennessee River Basin and significant decreases at eight sites (fig. 19). Sites showing decreases were all on relatively major streams (average drainage area, 2,600 square miles) or below major impoundments. Of the seven sites showing increases, six are in the Blue Ridge physiographic province and six drain basins with forests accounting for more than 75 percent of the total land use. The exception is Beaver Creek, which drains the Bristol, Tennessee and Virginia, urban area in the Valley and Ridge Province. The average area of basins showing nitrogen increases was only 276 square miles.(15)
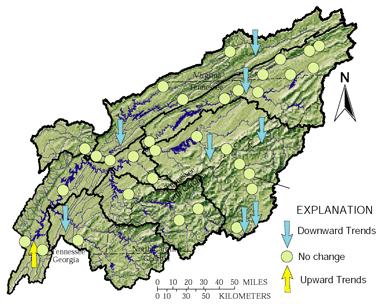 |
| Figure 20. Total phosphorus decreased or remained unchanged in the Upper Tennessee River Basin between 1970 and 1993. |
Of the seven sites showing increases, five are in the Blue Ridge in North Carolinatwo sites on the French Broad River and one each on the Little Tennessee River and tributaries to the Hiwassee and Pigeon Rivers. Much of this area is undergoing nonurban residential development in the form of vacation homes. Nitrogen loads are probably increased by the sewage and fertilizer use associated with this development.
Similar trend analyses for 42 sites to detect changes in total phosphorus concentrations yielded only one site with significant increases (fig. 20). West Chickamauga Creek, which drains a major industrial and urban setting, showed high concentrations for the entire period of record. Most (33) sites showed no trend, and eight sites showed significant decreases. These sites are dominated for the most part by pasture and forest; however, three sites are downstream from major wastewater discharges.(16) For sites in these more urbanized basins, improvements in wastewater-treatment processes are clearly responsible for the downward phosphorus trends.
All of the nutrients measured in the Upper Tennessee River Basin ground water were relatively low, as is usually typical of ground water. Most nutrient species are retained by soil particles or organic matter, taken up by plants, or utilized by soil bacteria and never enter the ground-water flow system. Exceptions are the nitrate and ammonia forms of nitrogen; however, only nitrate has a drinking-water standard, which is 10 mg/L. Drinking water containing nitrate concentrations higher than the standard can cause methemoglobinemia, a life-threatening illness in infants. Nitrate was present in all wells and springs sampled in the Upper Tennessee River Basin but usually at concentrations of 3 mg/L or less. This included all of the 30 domestic wells used for drinking-water supply that were sampled and the 35 springs sampled across the basin. The median nitrate concentration for domestic wells was 0.59 mg/L, slightly more than the 25th percentile value nationally; the median nitrate concentration for springs was 1.16 mg/L, which was significantly lower than the national 50th percentile. The higher concentrations detected in springs most likely reflect the predominance of relatively short ground-water flow paths associated with localized recharge and runoff. No nitrate concentrations in excess of the 10-mg/L standard were detected in any domestic wells or springs.
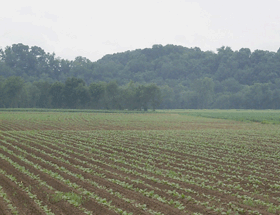
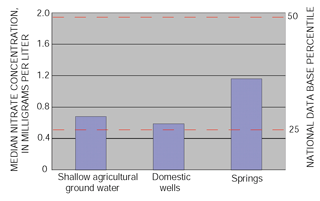
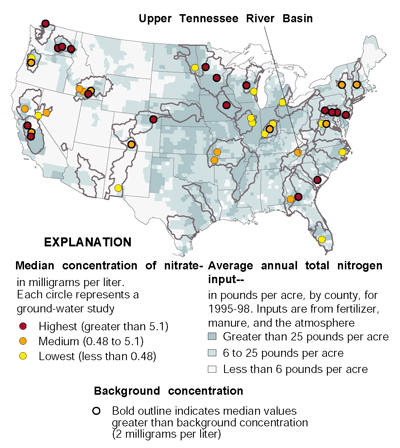
Nitrate concentrations in excess of the 10 mg/L standard were detected in 5 of the 30 wells installed during the study period to monitor shallow ground-water quality under and adjacent to tobacco fields. Tobacco is the main cash crop in the Upper Tennessee River Basin and is usually grown in small but intensively fertilized and cultivated plots. In general, fertilizer applications for tobacco cultivation are much greater than for any other row-type crop raised in the Upper Tennessee River Basin. The median nitrate concentration in the shallow agricultural monitoring wells, however, was 0.68 mg/Lonly slightly more than the median concentration for domestic wells and the national 25th percentile. Among the concentrations found nationally for agricultural and urban land uses, this value falls in the lower end of the medium range as shown in the accompanying figure. The results indicate that nitrate contamination of extensive areas of ground water in the Upper Tennessee River Basin is very unlikely. High nitrate concentrations relative to the 10 mg/L drinking-water standard were detected only in shallow ground water directly under heavily fertilized tobacco plots. Tobacco fields typically cover only about 2 acres and are widely scattered across the study area. The potential for nitrate contamination of drinking-water sources is, therefore, very low outside of the immediate vicinity of tobacco fields. |

| Table of Contents || Previous Section || Next Section || Glossary U.S. Geological Survey Circular 1205 Suggested citation:
|
