Data Series 894
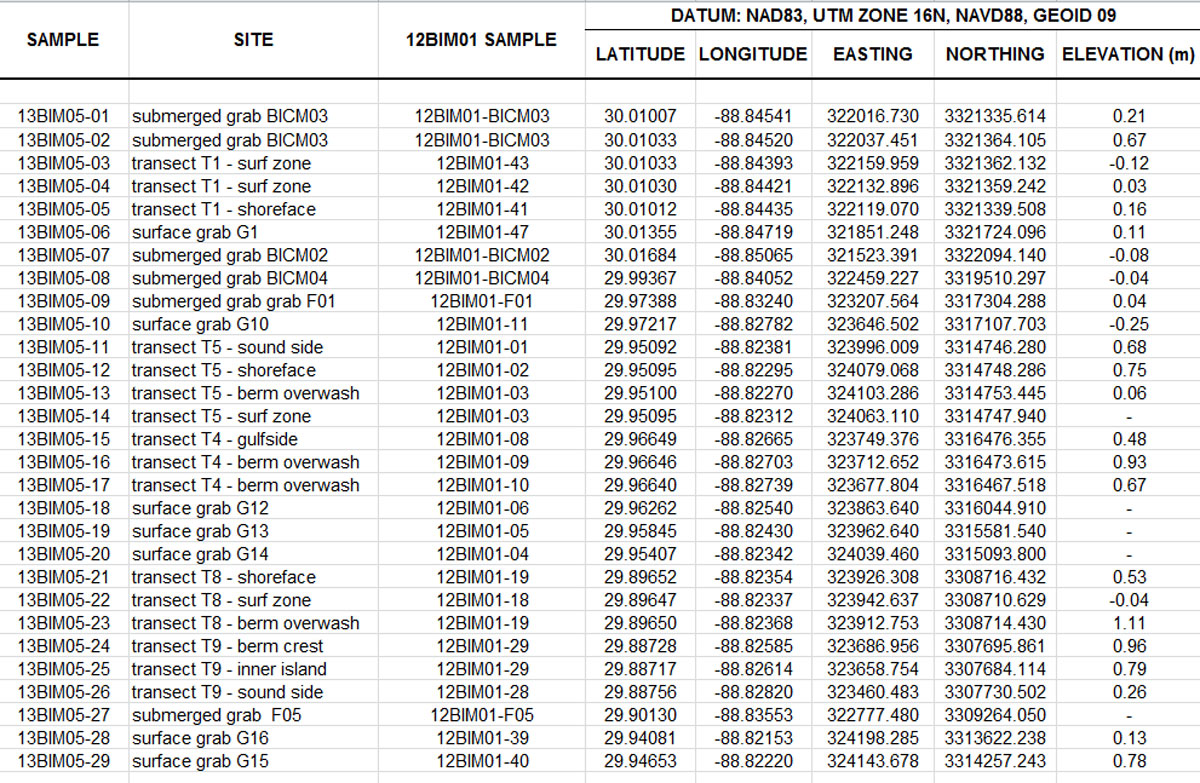
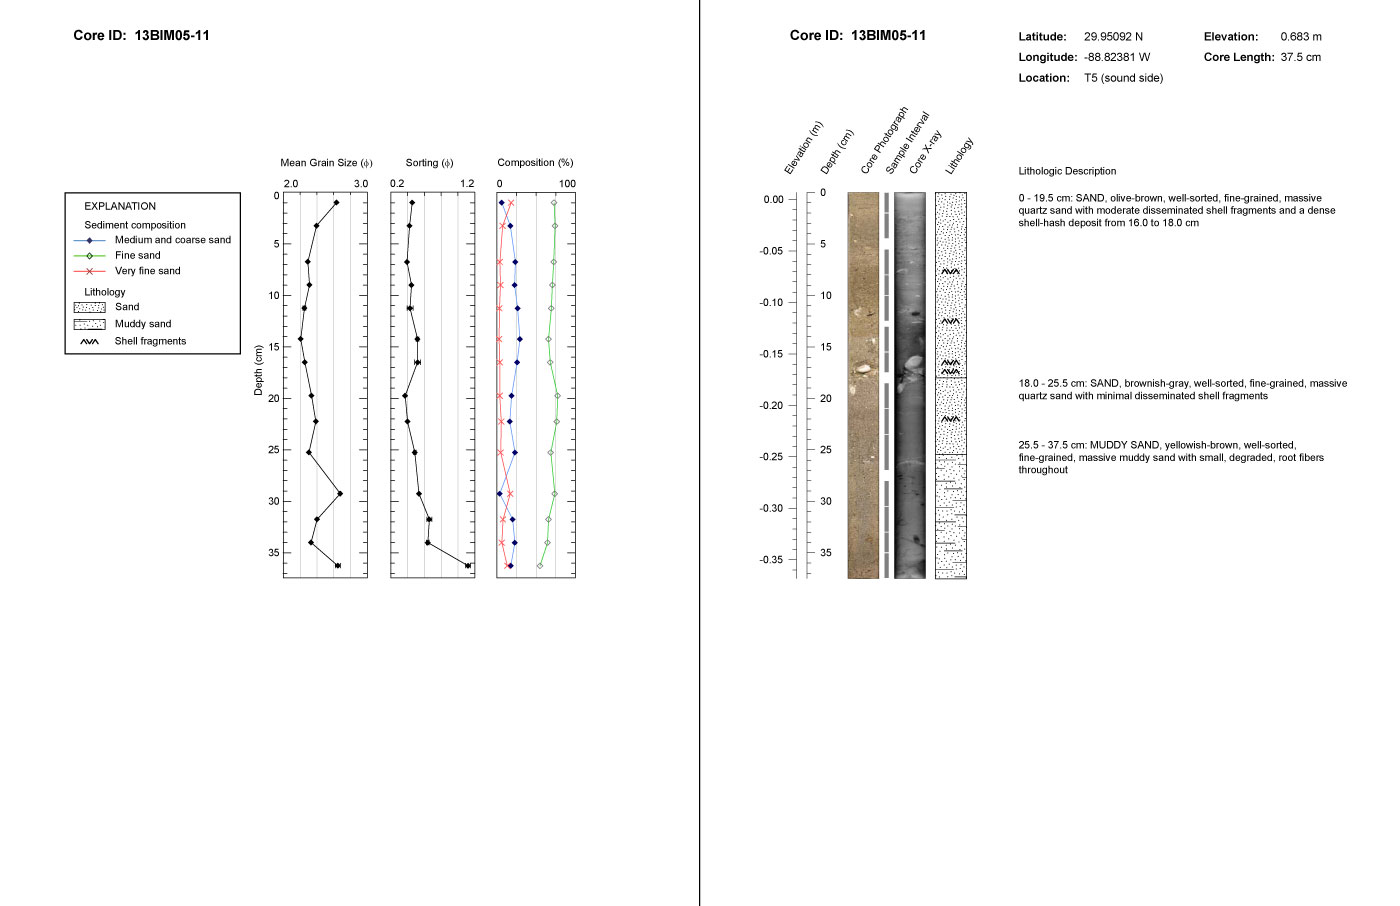
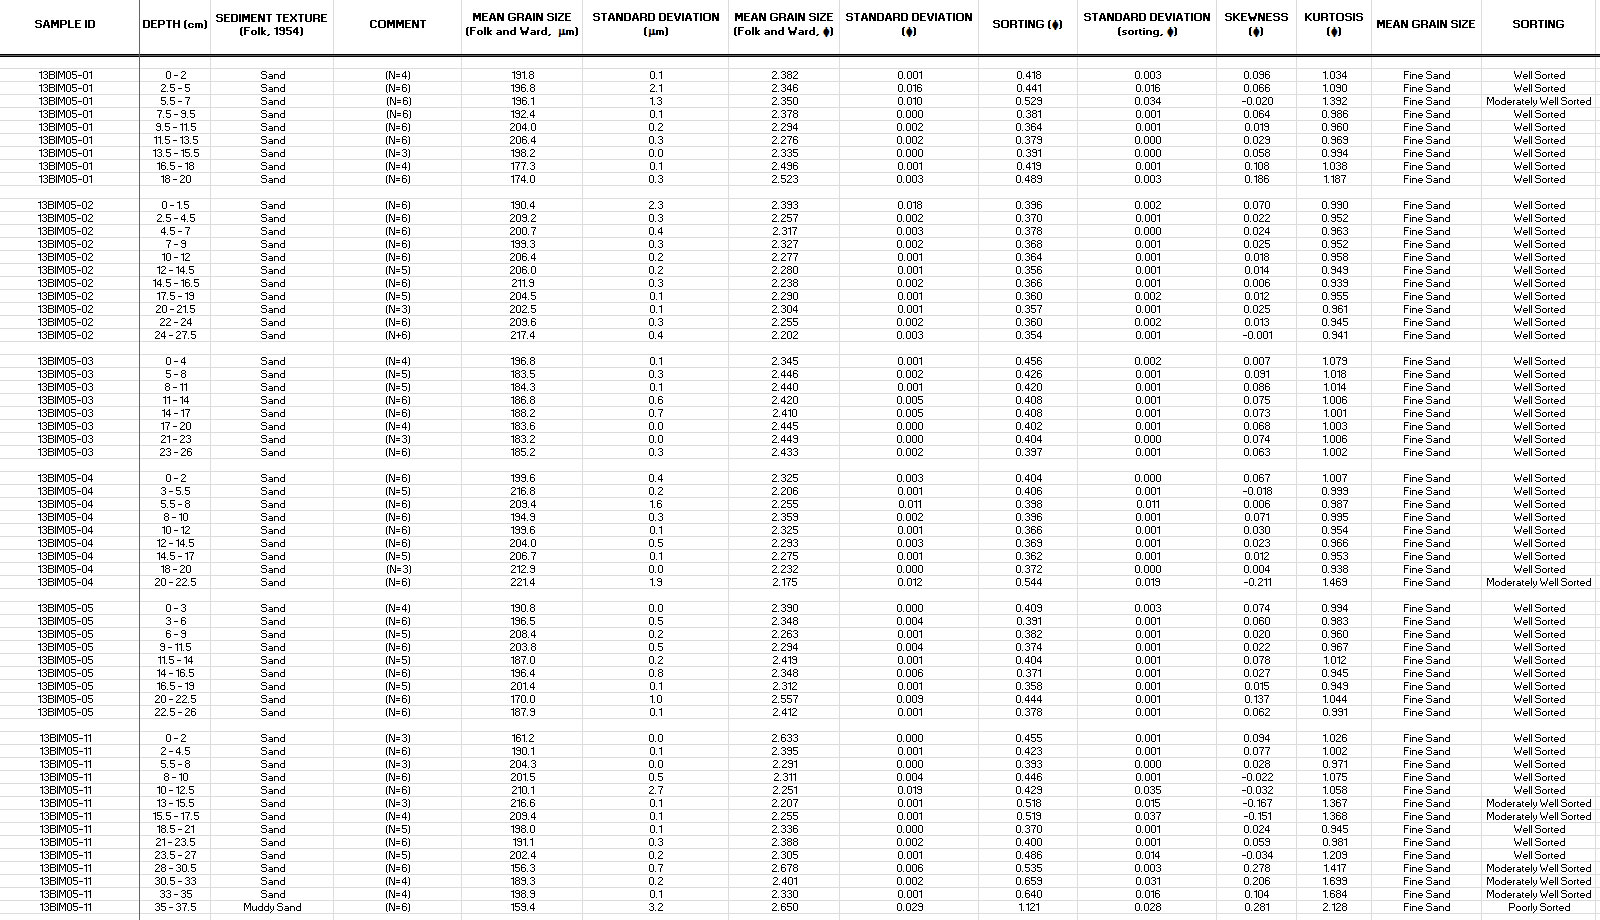
| Data Products and DownloadsThe sediment data described in this report, including descriptive core logs, high-resolution core photographs and x-radiographs, processed grain-size data, sample location maps, and Geographic Information System (GIS) data files with accompanying Federal Geographic Data Committee (FDGC) metadata, can be downloaded from the table below . Additionally, the core logs for the cores along each transect can be viewed by clicking on the transect identifier on the sample location map (fig. 7); the core logs are arranged by geographic location along transects from west (Chandeleur Sound) to east (GOM nearshore surfzone). Core logs for cores 13BIM05–01 and 13BIM05–02 are included with Transect T1 for ease of viewing. Error bars on the grain-size plots represent 2 standard deviations from the mean. Core logs in Portable Document Format (PDF) can be viewed using Adobe Systems’ free software program Adobe Reader. The core photographs and x-radiographs in high-resolution Joint Photographic Experts Group (JPEG) and Tagged Image File Format (TIFF) formats, respectively, can be viewed using standard image viewing software. The sample location tables and grain-size spreadsheets were created with Microsoft Excel 2010 and can be opened using Microsoft Excel 2007 or higher; these data may also be viewed using Microsoft’s free Microsoft Excel Viewer. The GIS map documents and shapefiles in the data table were created using Esri ArcGIS version 10.1 and can be opened with Esri ArcGIS version 10.0 or higher; these data may also be viewed using the free GIS viewer ArcGIS Explorer. All sample locations and GIS data files presented in this report use the projected coordinate system North American Datum of 1983 (NAD83), Universal Transverse Mercator (UTM) Zone 16 North (16N), and all elevations are North American Vertical Datum of 1988 (NAVD88) orthometric heights, derived using the GEOID09 geoid model. |
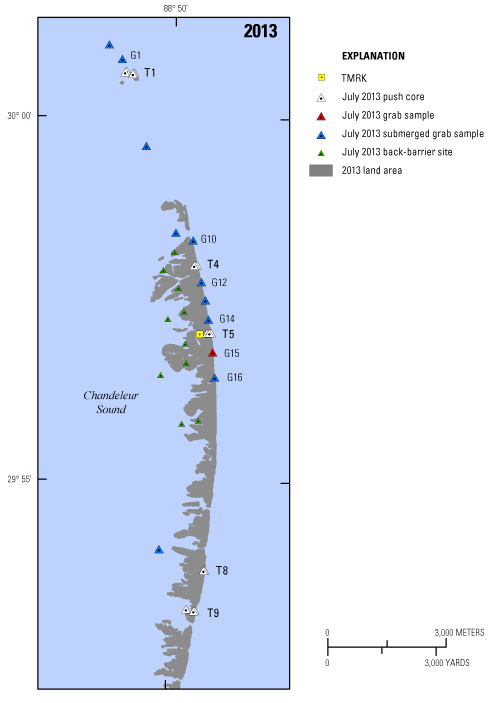
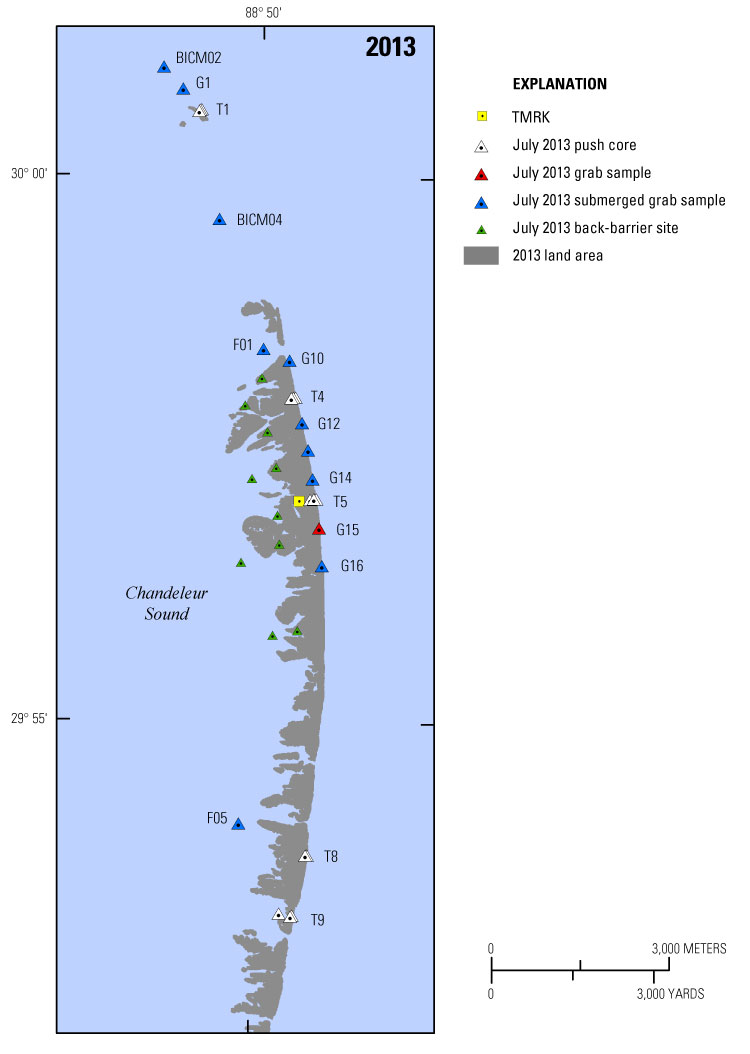
Figure 7. Locations of transect sediment samples collected from the northern Chandeleur Islands in July 2013 that are described in this report. Island extent is derived from U.S. Geological Survey lidar data collected in July 2013 (Plant and Guy, 2014). Click on a transect ("T") identifier to view the core logs for the cores along that transect. |
| Preview | File Description and Format | Download File | Metadata (html) |
|---|---|---|---|
 |
Sample locations (.xlsx) |
13BIM05_samplesites.zip (30 KB) |
|
 |
Core logs (.pdf) High-resolution core photographs (.jpg) High-resolution core x-radiographs (.tiff) |
13BIM05_Core-Logs.zip (1.58 MB) 13BIM05_Core-Photos.zip (84.4 MB) 13BIM05_Core-X-Rays.zip (150.2 MB) |
Not applicable |
 |
Grain-size summary statistics (.xlsx) |
grainsize_summary-statistics.zip (248 KB) |
|
 |
Esri ArcGIS project | 13BIM05-GIS.zip (2.0 MB) |
| Preview | File Description | Download File | Metadata (html) |
|---|---|---|---|
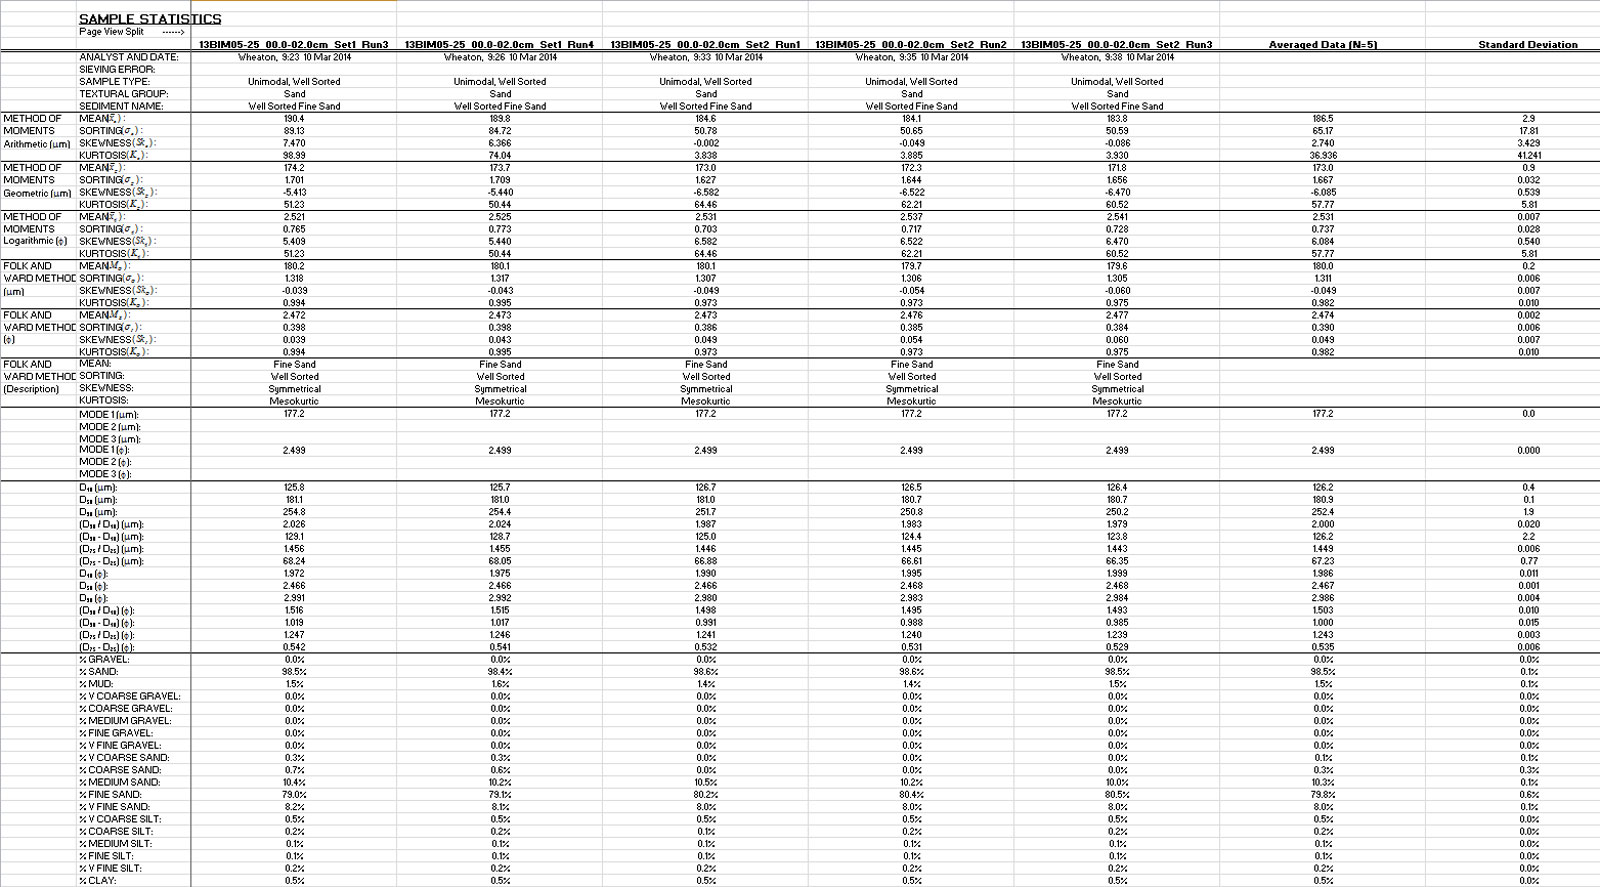 |
Grain-size GRADISTAT output (.xlsx) |
grainsize_GRADISTAT-Statistics.zip (3.2 MB) |
Not applicable |
Note: Any use of trade names is for descriptive purposes only and does not imply endorsement by the U.S. Government.

![]() U.S. Department of the Interior |
U.S. Geological Survey
U.S. Department of the Interior |
U.S. Geological Survey
URL: http://pubsdata.usgs.gov/pubs/ds/0894/ds894_data.html
Page Contact Information: GS Pubs Web Contact
Page Last Modified: Monday, 28-Nov-2016 20:30:23 EST
