Data Series 894
|
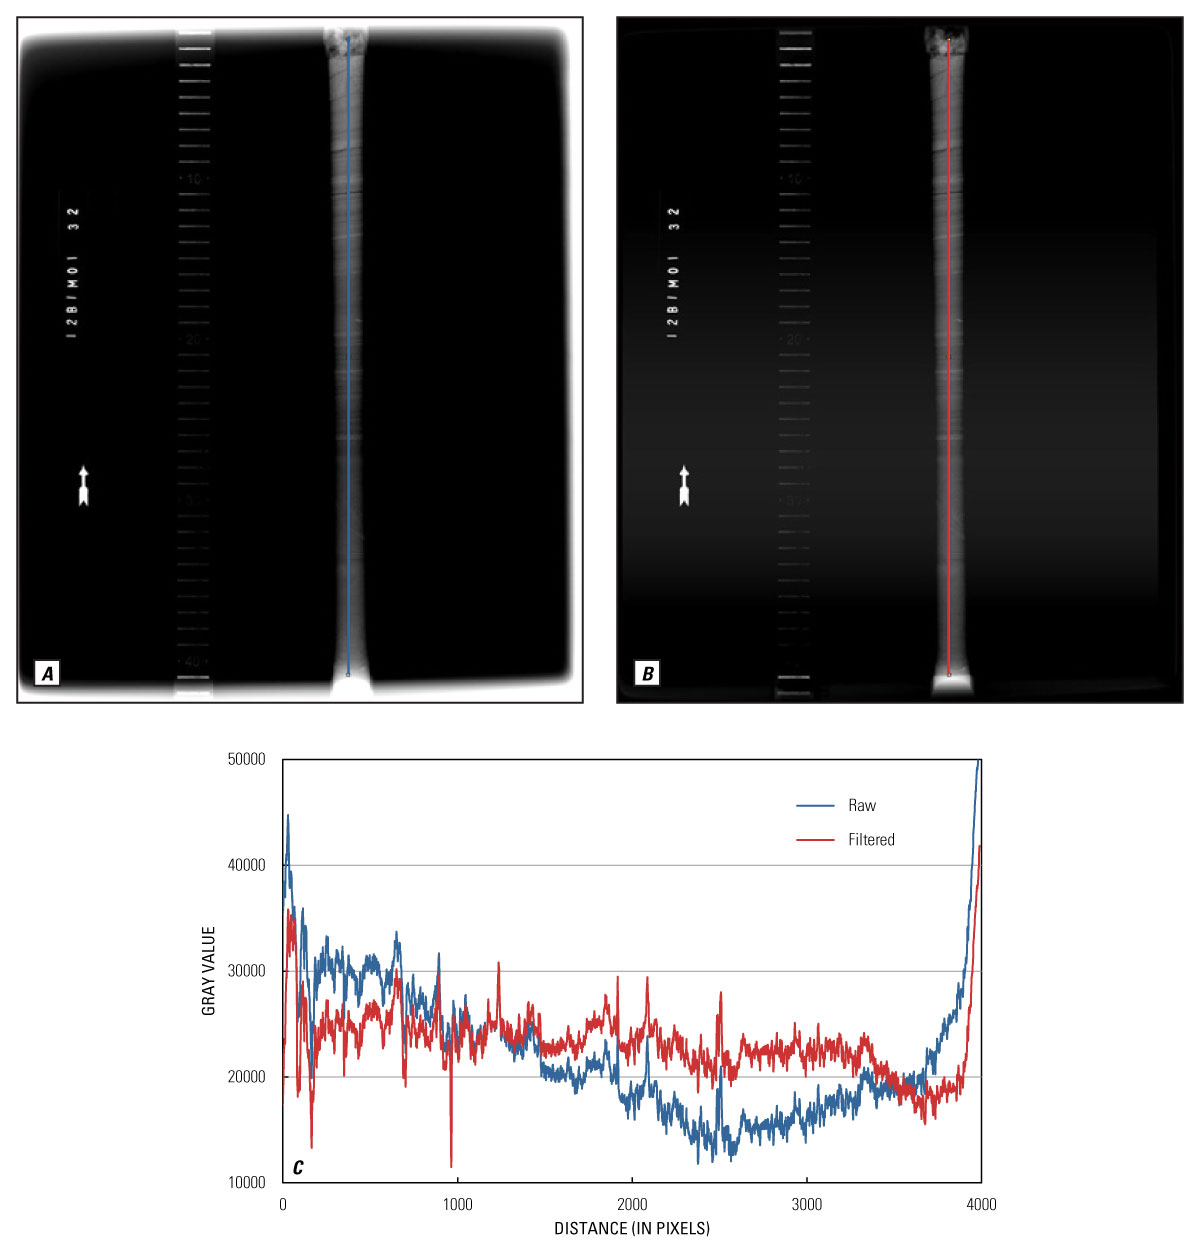
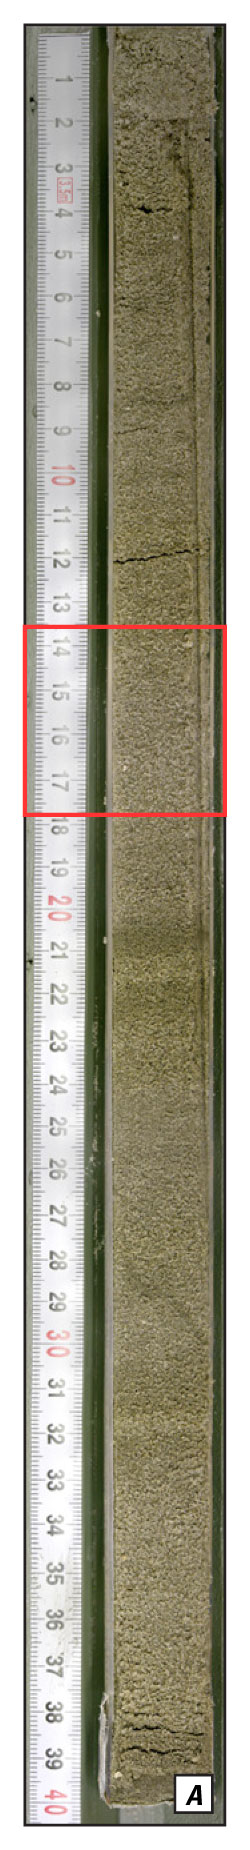
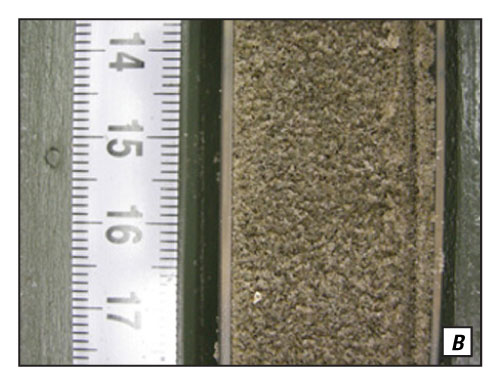
Laboratory Methods and AnalysisSample Elevations | Core Processing | Grain Size Analysis Sample ElevationsThe coordinate values of the GPS base station (TMRK) are the time-weighted average of values obtained from the National Geodetic Survey On-Line Positioning User Service (OPUS). The base station coordinates were imported into GrafNav, version 8.4 (NovAtel Waypoint Product Group), and the data from the rover GPS (the GPS unit collecting data at each sample site) were post-processed to the concurrent GPS session data at the base station. The final sample locations, including elevation, are the post-processed DGPS coordinates. The surface elevation for sample site 13BIM05–14 (transect T5), at which DGPS data were not collected, was interpolated from a 2.5-m by 2.5-m gridded surface of USGS lidar data collected in July 2013 using the Spatial Analyst Extract Values to Points tool in Esri ArcGIS version 10.2. DGPS data were not collected at four additional submerged grab sample sites (13BIM05–18, 13BIM05–19, 13BIM05–20, and 13BIM05–27); those sites do not intersect the lidar data and, therefore, surface elevations are not reported. Core ProcessingAt the SPCMSC sediment lab, the cores were x-rayed using a Diagnostic Imaging Systems, Inc., Ultra 12040HF x-ray unit at 95 kilovolts for 25 milliampere-seconds from a height of 79 cm. The x-radiograph was captured on a 17-inch phosphor cassette, which was scanned on an iCRco, Inc., iCR3600+ scanner at 254 pixels per inch and exported as a 16-bit Tagged Image File Format (TIFF) image. The raw x-radiographs show a pronounced anode heel effect (fig. 5A), which is a variation in x-ray intensity along the anode-cathode axis that results in a nonuniform pixel intensity across the image. The heel effect biased the imagery so that natural x-ray absorption parameters could not be compared down-core or with other cores. We corrected for the effect by subtracting a background pixel intensity template from each raw image, a technique similar to methods used in coral densification studies (Chalker and others, 1985; Carricart-Ganivet and Barnes, 2007; Carilli and others, 2010). The anode heel effect has been mostly removed from the filtered images (fig. 5B), and variations in the down-core pixel intensity (fig. 5C) correspond to variations in lamination densities and can be compared against other cores. Cores longer than approximately 38 cm, that either did not fit onto the phosphor cassette or extended into the area at the bottom of the x-radiograph, where the filter could not completely remove the heel effect (fig. 5B), were x-rayed in "top" and "bottom" segments and then merged in Adobe Photoshop CS5. Each core was split lengthwise, photographed, described using standard sediment-logging methods, and subsampled for grain-size analysis. The cores were photographed in approximately 3.5-cm, overlapping segments with a Nikon COOLPIX P5000 digital camera using the macro (close-up) focus mode from a fixed height. The resulting images were "stitched" together using The Panorama Factory version 5.3 software (fig. 6A). The advantage of macro-zoom mode, instead of a whole-core photograph, is that individual grains are easily identified in close-up images (fig. 6B), allowing for the identification of light versus dark lithologies using image processing software such as ImageJ. Down-core intensity plots generated by ImageJ can be compared against the core x-radiographs as an additional tool to analyze laminations and sediment variability within and among the cores. The core descriptions, x-radiographs, and photographs can be viewed or downloaded from the Data Products and Downloads page.Informal sedimentary units were identified in each core based on changes in observed texture and frequency or intensity of laminations on the x-radiographs. The cores were subsampled at 2- to 3-cm intervals with 1-cm buffers around the unit boundaries to avoid sampling across units. In most cores, more units were identified from the x-radiographs than were observed visually; however, many of the contacts identified in the x-radiographs coincided with observed lithologic changes. For cores with visible lithologic contacts in addition to those identified by the x-radiograph, the sampling intervals and buffers were adjusted to incorporate the x-radiograph and visible stratigraphies.
Grain-Size AnalysisGrain-size analyses on both the bulk sediment grab samples and the core sediment samples were performed using a Coulter LS 200 particle-size analyzer, which uses laser diffraction to measure the size distribution of sediments ranging in size from 0.4 microns (µm) to 2 millimeters (mm) (clay to very coarse-grained sand). A total of 11 grab samples and 183 core samples were analyzed. To prevent shell fragments from damaging the LS 200, particles greater than 1 mm in diameter were separated from all samples prior to analysis with a number 18 (1000 µm, 1 mm) U.S. standard sieve, which meets the American Society for Testing and Materials (ASTM) E11 standard specifications for determining particle size using woven-wire test sieves. Prior to sieving, each down-core sample was dried at 45 degrees Celsius for 24 hours, and the fraction of sediment greater than 1 mm was recorded as a percent of the bulk sample dry weight. Two subsamples from each sample were processed through the LS 200 a minimum of three times apiece. The LS 200 measures the particle-size distribution of each sample by passing sediment suspended in solution between two narrow panes of glass in front of a laser. The particles scatter light into characteristic refraction patterns that are measured by an array of photodetectors in intensity per unit area and recorded as relative volume for 92 size classification channels (or bins). The size-classification boundaries for each bin were based on the ASTM E11 standard. The raw grain-size data were run through the free software program GRADISTAT (Blott and Pye, 2001). The GRADISTAT program calculates the mean, sorting, skewness, and kurtosis of each sample geometrically in metric units and logarithmically in phi units (Φ) (Krumbein, 1934) using the Folk and Ward (1957) method and the cumulative particle-size distribution. GRADISTAT also calculates the fraction of sediment from each sample by size category (for example, clay, coarse silt, fine sand) based on a modified Wentworth (1922) size scale. A macro function in Microsoft Excel, developed by the USGS, was applied to the data to calculate the average and standard deviation of each sample set (six runs per sample) and highlight runs that varied from the set average by more than plus or minus (±) 1.5 standard deviations. Excessive deviations from the mean are likely the result of equipment error or extraneous material in the sample and are not considered representative of the sample. Runs that deviated excessively were removed from the results, and the sample average was recalculated using the remaining runs. The grain-size data can be viewed or downloaded from the Data Products and Downloads page.
Note: Any use of trade names is for descriptive purposes only and does not imply endorsement by the U.S. Government. |

![]() U.S. Department of the Interior |
U.S. Geological Survey
U.S. Department of the Interior |
U.S. Geological Survey
URL: http://pubsdata.usgs.gov/pubs/ds/0894/ds894_lab-methods.html
Page Contact Information: GS Pubs Web Contact
Page Last Modified: Monday, 28-Nov-2016 20:30:32 EST