Data Series 894
|
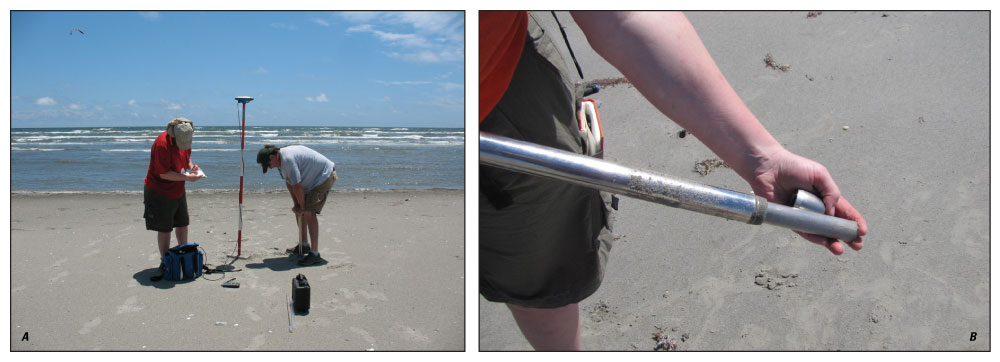
Field Data CollectionFrom July 5 to 19, 2013, SPCMSC scientists collected sediment samples from the berm, the adjacent island, and back-barrier environments (USGS Field Activity Number (FAN) 13BIM05). The sampling goal was to reoccupy all the sites sampled in 2012 (Bernier and others, 2014), but only some of the 2012 sites were reoccupied due to time and access constraints. Many of the sites that were subaerial in 2012 were completely submerged in 2013: several sites located on the berm or natural island in 2012 were located in either the nearshore surf zone or on shallow back-barrier sand flats in 2013 (fig. 3). All sample locations were recorded at the time of collection with a Garmin GPSMAP 76S handheld Global Positioning System (GPS) receiver. At most sites, position and elevation data were also recorded with an Ashtech Differential Global Positioning System (DGPS) receiver and antenna, which provided more accurate horizontal and vertical control than handheld GPS systems. A rapid-static survey technique was used, with a static occupation duration of 5 minutes at each sample site. DGPS data was recorded concurrently throughout the survey at a previously installed USGS benchmark (TMRK) with the same instrument combination. 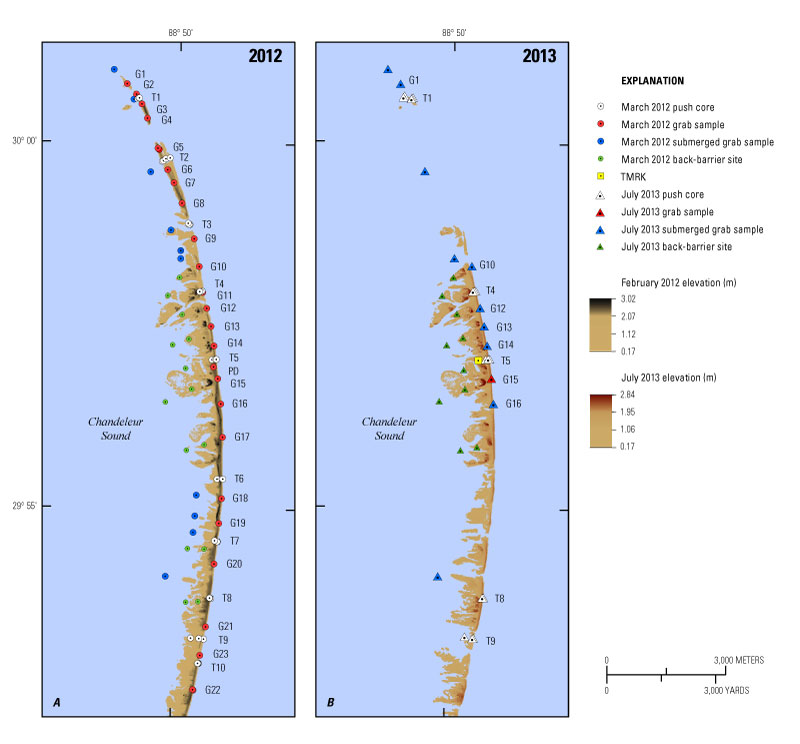
Figure 3. Locations of all sediment samples collected from the northern Chandeleur Islands in (A) March 2012 and (B) July 2013. Analysis of 2012 and 2013 sediment samples collected at back-barrier sites (green symbols) are described in a separate report (Marot and others, 2014). Island elevations are represented by interpolated 2.5-meter by 2.5-meter (m) resolution gridded surfaces derived from U.S. Geological Survey (USGS) lidar data collected in February, 2012 (Guy and others, 2014 a, b) and from USGS lidar collected in July 2013 (Guy and Plant, 2014). Elevations are North American Vertical Datum of 1988 (NAVD88) orthometric heights, derived using the GEOID09 geoid model. Click on a grab sample ("G") or transect ("T") identifier to view an oblique aerial photograph of that area (Morgan and others, 2013; Morgan and Westphal, 2014). Grab SamplesOf the 29 surface and 10 shallow water (submerged) grab samples collected in 2012, eleven of those sites were reoccupied in 2013 (fig. 3). Seven grab samples were collected at sites that were located along the subaerial berm axis in 2012. Of those sites, only 1 (site G15) was still located on land in 2013; the rest were located in the nearshore surf zone. For consistency with the 2012 sample classification, all samples collected from the shallow surf zone were labeled “submerged grab samples,” even when collected at “surface grab sample” sites in 2012. Additionally, 4 of the 10 submerged grab-sample sites from 2012 were reoccupied in 2013; two of those sample locations targeted sites previously sampled in 2006 and 2008 (Kulp and others, 2011a, b). All samples were bagged, labeled with the site and sample numbers, and transported to SPCMSC for processing and analysis. Sample information and site locations for 2013 (with corresponding 2012 locations) are in the file 13BIM05_samplesites.xlsx and in the GIS folder on the Data Products and Downloads page. Push CoresEighteen short (< 40 centimeters (cm)), 2.54-cm diameter push cores were collected along 5 transects across the berm and natural island or in adjacent shallow water environments with an AMS sand/loose sediment soil probe (fig. 4). In 2012, there were 31 push cores collected from along 10 transects (Bernier and others, 2014). The original sampling protocol specified that three cores were collected along each transect, with core locations from (1) the sound side of the berm, the pre-berm island shoreface, or the natural island, (2) the berm crest (the highest point along the berm axis as chosen in the field), and (3) the berm or post-berm island shoreface adjacent to the Gulf of Mexico. Changes to the depositional environments at some of the individual sampling sites occurred between 2012 and 2013, which forced the use of a sampling strategy different from the one used in 2012. For example, samples 12BIM01–02 and 13BIM05–12 were collected at approximately the same geographic location along transect T5; however, in 2012 the sample was taken at the berm crest, whereas in 2013 the sample was collected from the island shoreface. Consequently, some 2012 core sites were reoccupied but had become representative of different depositional environments between sampling years. Additional core sites were sampled in 2013 representing the extant sound side—crest—shoreface configuration. After extraction, each core was capped, sealed, and labeled with the transect location, core number, and orientation. The cores were then transported to SPCMSC for processing and analysis. Sample information and site locations for 2013 (with the corresponding 2012 locations) are in the file 13BIM05_samplesites.xlsx and in the GIS folder on the Data Products and Downloads page.
Note: Any use of trade names is for descriptive purposes only and does not imply endorsement by the U.S. Government.
|

![]() U.S. Department of the Interior |
U.S. Geological Survey
U.S. Department of the Interior |
U.S. Geological Survey
URL: http://pubsdata.usgs.gov/pubs/ds/0894/ds894_field-data-collection.html
Page Contact Information: GS Pubs Web Contact
Page Last Modified: Monday, 28-Nov-2016 20:30:31 EST
