Data Series 968
| Introduction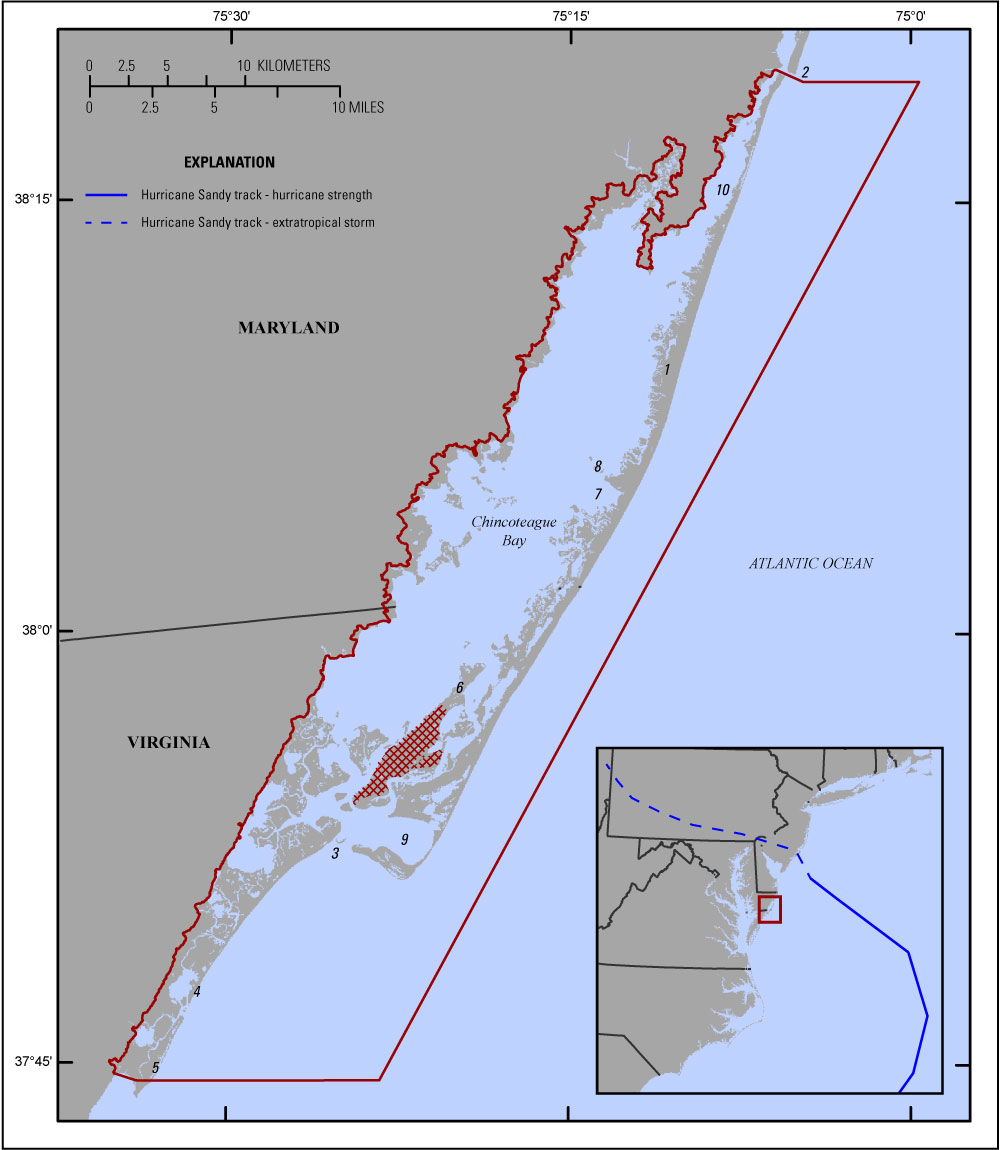 Figure 1. Map showing the study area from Assateague Island, Maryland, to Metompkin Island, Virginia. Red box indicates study-area extent; urban areas on Chincoteague Island (red hatched extent) were excluded from analysis. Numbered features are (1) Assateague Island, (2) Ocean City Inlet, (3) Chincoteague Inlet, (4) Assawoman Island, (5) Metompkin Islands, (6) Chincoteague Island, (7) Green Run Bay, (8) Pirate Islands, (9) Tom’s Cove, and (10) Sinepuxent Bay. Inset shows track of Hurricane Sandy offshore of the U.S. Atlantic coast. Base map modified from U.S. Geological Survey 1:200,000 scale digital data overlaid with coastal land area derived from Landsat 5 imagery acquired April 28, 1989. [Click image to enlarge] On October 29, 2012, Hurricane Sandy made landfall near Brigantine, New Jersey, after becoming the largest Atlantic tropical cyclone in the National Hurricane Center’s extended best track record. At its maximum extent, tropical-storm force winds from Hurricane Sandy extended more than 1,500 kilometers (km) (870 nautical miles) from the eye (Blake and others, 2013). Hurricane Sandy tracked approximately parallel to the U.S. Atlantic coast before turning to the northwest and making landfall as an extratropical storm, impacting large extents of the coastline from North Carolina to Massachusetts with rain, winds, waves, and storm surge. The U.S. Geological Survey’s (USGS) National Assessment of Coastal Change Hazards program has a long history of responding to and documenting the impacts of storms along the Nation’s coasts and incorporating these data into storm impact and coastal change vulnerability assessments. As part of the USGS response to Hurricane Sandy (Buxton and others, 2013), coastal change data were collected as part of the Storm Impacts and Vulnerability of Coastal Beaches project to evaluate and update coastal change models and predictive capabilities (for example, see Stockdon and others, 2013; Sopkin and others, 2014). These studies, however, focused on sandy shorelines and sandy barrier-island systems, without consideration of impacts to coastal wetlands. The goal of the USGS Barrier Island and Estuarine Wetland Physical Change Assessment project is to integrate a wetland-change assessment with existing coastal-change assessments for the adjacent sandy dunes and beaches, initially focusing on Assateague Island along the Maryland and Virginia coastline (fig. 1). Assateague Island is approximately 60 km (about 37 miles) long, extending from Ocean City Inlet in the north to Chincoteague Inlet in the south and separated from the mainland by the Chincoteague Bay estuary. Assateague Island is largely undeveloped and is managed by the National Park Service (Assateague Island National Seashore), the U.S. Fish and Wildlife Service (Chincoteague National Wildlife Refuge), and the Maryland Park Service (Assateague State Park). Beach, dune, forested, shrub, and wetland environments provide habitat for and support a diverse wildlife and shorebird population, including wild horses and the endangered piping plover (Carruthers and others, 2011; Gieder and others, 2014). The geomorphology of this wave-dominated barrier island is especially influenced by overwash and breaching events resulting from the passage of tropical storms and hurricanes in the summer and extra-tropical “nor ’easters” in the fall and winter (Carruthers and others, 2011). The storm surge from Hurricane Sandy ranged from about 1.1 to 1.5 meters (m) (3.5 to 5 feet) above mean higher high water (Blake and others, 2013) along the Maryland and Virginia coastline encompassing Assateague Island. Analysis of pre- and post-storm topography and aerial photography showed changes to the sandy ocean-facing shoreline on Assateague Island that varied from erosion and scarping along the beach and dune face to erosion and overwash of low-lying berms and dunes (Sopkin and others, 2014). Corresponding changes to the back-barrier wetland environments, however, are not well documented. This report describes data that were derived from Landsat 5 and Landsat 8 imagery from 1984 to 2014, including wetland and terrestrial habitat extents; open-ocean, back-barrier, and estuarine mainland shoreline positions; and sand-line positions. The study-area extent includes Assateague Island as well as estuarine mainland and barrier wetlands extending south to Assawoman and Metompkin Islands in Virginia. Urban areas on Chincoteague Island were excluded from the analysis (fig. 1). These data can be downloaded from the Data Downloads page and provide pre- and post-Hurricane Sandy baseline data as well as a longer term (annual to decadal) context for assessing changes to the back-barrier shoreline and wetland environments. Similar sand- and shoreline positions were previously extracted from high-resolution aerial photography (Guy, 2015). Metrics derived from these data, such as island or wetland width and rates of shoreline change, can be used to assess morphological and ecological changes or incorporated into models to assess the likelihood of wetland change from future storm events and integrated with existing vulnerability assessments for the adjacent beach and dune environments. |

![]() U.S. Department of the Interior |
U.S. Geological Survey
U.S. Department of the Interior |
U.S. Geological Survey
URL: http://pubsdata.usgs.gov/pubs/ds/0968/ds968_intro.html
Page Contact Information: GS Pubs Web Contact
Page Last Modified: Monday, 28-Nov-2016 20:44:06 EST
