Data Series 977
Notice: This USGS Publication Supersedes Data Series 892
Awuna1GTN-P code: U23 Latitude: 69°10.226′N Longitude: 158°00.402′W Elevation: 362 meters above mean sea level Installation date: 19 AUG 1998 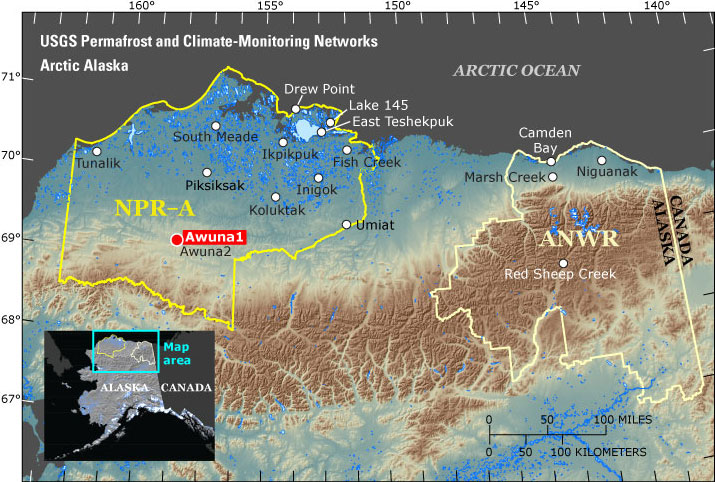
Figure 1. Location map presenting the specific location of the Awuna1 site and its spatial relation to other sites in the monitoring network. (NPR-A, National Petroleum Reserve–Alaska; ANWR, Arctic National Wildlife Refuge) 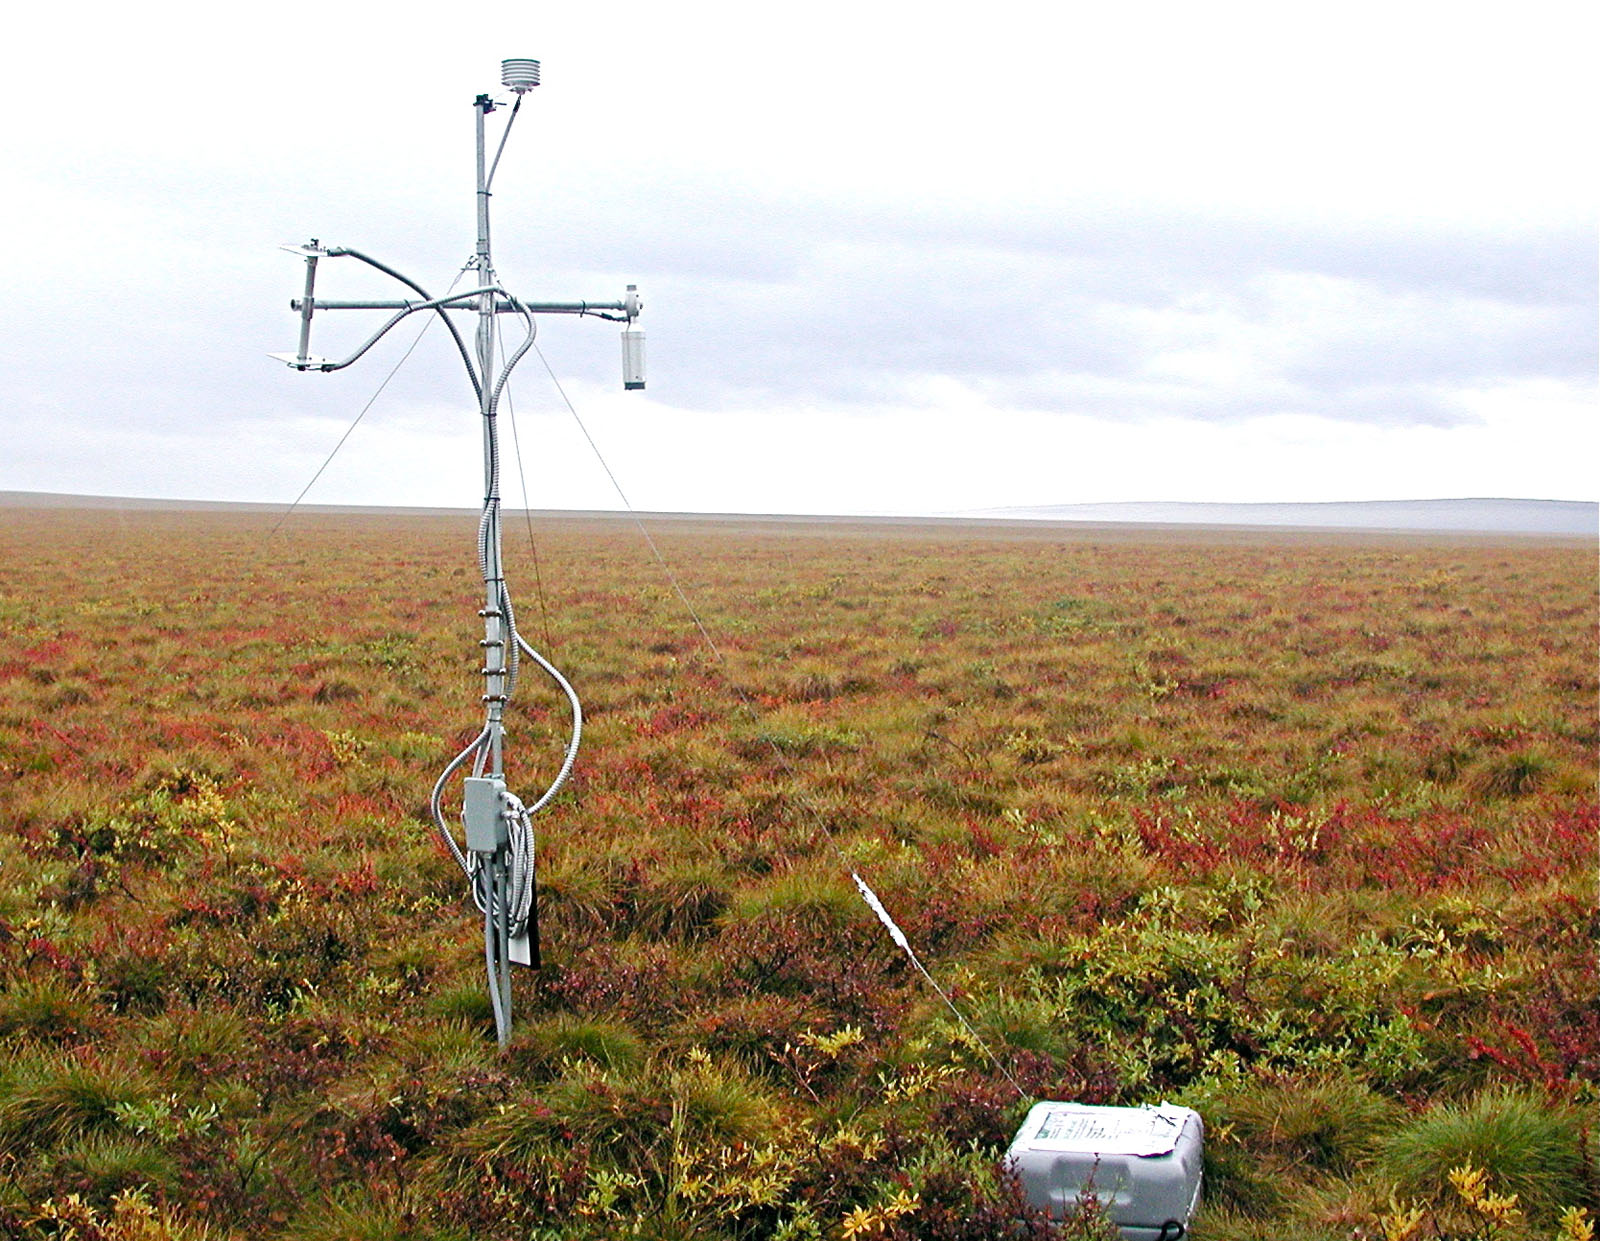
Figure 2. Awuna1 station in summer 2008. (Click image for larger version.) Data Access (Large file will open in new window)TablesTable 1a. Statistical summaries of air temperature data at monthly resolution. Average, minimum, maximum, anomaly, and percentage of data available. Anomalies are calculated relative to the entire available period of record for the given site. 95 percent of the data must be available in order to calculate statistics. Periods with less than the 95 percent requirement are represented by NaN (not a number). Site name: Awuna1 Variable: Air temperature, in degrees Celsius File name: AK103_Tair_mon_stats.txt Date of file preparation: 25 Aug 2015 Name of file preparer: Frank Urban Monthly Averages: Year JAN FEB MAR APR MAY JUN JUL AUG SEP OCT NOV DEC 1998 NaN NaN NaN NaN NaN NaN NaN NaN 1.88 -6.26 -16.70 -21.38 1999 -28.64 -26.59 -28.58 -17.86 -3.29 8.67 11.46 8.36 0.94 -13.41 -21.52 -32.26 2000 -25.39 -22.78 -26.74 -17.73 -7.62 8.68 8.56 8.32 -0.75 -10.18 -20.05 -22.09 2001 -23.90 -18.10 -27.74 NaN NaN NaN NaN NaN NaN NaN NaN NaN 2002 NaN NaN NaN NaN NaN NaN NaN NaN 2.49 -6.71 -14.90 -21.10 2003 -22.89 -26.54 -23.39 -11.01 -4.84 8.59 8.72 5.38 -1.43 -5.11 -15.83 -23.41 2004 -26.42 -33.68 -26.62 -15.48 Minimum Value Each Month: Year JAN FEB MAR APR MAY JUN JUL AUG SEP OCT NOV DEC 1998 NaN NaN NaN NaN NaN NaN NaN NaN -7.07 -20.41 -28.32 -39.76 1999 -46.16 -40.53 -39.80 -37.29 -20.91 -3.63 -1.01 -3.18 -18.16 -25.74 -33.65 -46.12 2000 -40.60 -41.65 -36.24 -32.47 -19.78 -5.54 -1.92 -3.20 -13.14 -25.30 -33.56 -40.74 2001 -39.63 -41.19 -38.94 NaN NaN NaN NaN NaN NaN NaN NaN NaN 2002 NaN NaN NaN NaN NaN NaN NaN NaN -7.51 -24.17 -30.74 -38.87 2003 -40.67 -38.84 -35.39 -27.15 -17.77 -3.42 -1.45 -1.76 -13.61 -21.84 -34.85 -35.68 2004 -43.60 -46.07 -41.40 -33.58 Maximum Value Each Month: Year JAN FEB MAR APR MAY JUN JUL AUG SEP OCT NOV DEC 1998 NaN NaN NaN NaN NaN NaN NaN NaN 13.00 1.90 1.11 -0.57 1999 -3.92 -10.13 -13.59 1.47 15.36 22.07 25.33 25.75 13.78 -3.63 -12.13 -12.94 2000 -8.34 0.48 -6.49 -2.69 6.61 19.94 19.88 26.30 10.61 -2.88 -1.58 -0.52 2001 -3.97 -2.86 -15.40 NaN NaN NaN NaN NaN NaN NaN NaN NaN 2002 NaN NaN NaN NaN NaN NaN NaN NaN 12.51 3.20 0.21 -1.41 2003 -0.45 -9.37 -2.70 2.75 6.21 20.70 22.20 21.42 10.50 8.35 3.57 -3.15 2004 -3.55 -3.43 -2.47 2.25 Anomaly Relative to the Climatological Mean: Year JAN FEB MAR APR MAY JUN JUL AUG SEP OCT NOV DEC 1998 NaN NaN NaN NaN NaN NaN NaN NaN 1.25 2.08 1.10 2.67 1999 -3.19 -1.05 -1.96 NaN NaN NaN NaN NaN 0.32 -5.08 -3.72 -8.21 2000 0.06 2.76 -0.12 NaN NaN NaN NaN NaN -1.37 -1.85 -2.25 1.96 2001 1.55 7.44 -1.13 NaN NaN NaN NaN NaN NaN NaN NaN NaN 2002 NaN NaN NaN NaN NaN NaN NaN NaN 1.87 1.62 2.90 2.95 2003 2.55 -1.00 3.22 NaN NaN NaN NaN NaN -2.06 3.22 1.96 0.63 2004 -0.97 -8.14 -0.01 NaN Percent of Data Available during Each Month: Year JAN FEB MAR APR MAY JUN JUL AUG SEP OCT NOV DEC 1998 0.00 0.00 0.00 0.00 0.00 0.00 0.00 0.00 100.00 100.00 100.00 100.00 1999 100.00 100.00 100.00 100.00 100.00 100.00 100.00 100.00 100.00 100.00 100.00 100.00 2000 100.00 100.00 100.00 100.00 100.00 100.00 100.00 99.73 100.00 100.00 100.00 100.00 2001 100.00 100.00 100.00 6.67 0.00 69.72 0.00 88.44 0.00 0.00 0.00 0.00 2002 0.00 0.00 0.00 0.00 0.00 0.00 0.00 74.73 100.00 100.00 100.00 100.00 2003 100.00 100.00 100.00 100.00 100.00 100.00 100.00 100.00 100.00 100.00 100.00 100.00 2004 100.00 100.00 100.00 100.00 Table 1b. Statistical summaries of wind speed data at monthly resolution. Average, maximum, and percentage of data available. 95 percent of the data must be available in order to calculate statistics. Periods with less than the 95 percent requirement are represented by NaN (not a number). Data for this station is not available Table 1c. Statistical summaries of ground temperature data at 10- and 120-centimeter depths at monthly resolution. Average, minimum, maximum, anomaly, and percentage of data available. Anomalies are calculated relative to the entire available period of record for the given site. 95 percent of the data must be available in order to calculate statistics. Periods with less than the 95 percent requirement are represented by NaN (not a number). Site name: Awuna1 Variable: Ground temperature, in degrees Celsius File name: AK103_Tg_mon_stats.txt Date of file preparation: 25 Aug 2015 Name of file preparer: Frank Urban Monthly Averages (10 cm depth): Year JAN FEB MAR APR MAY JUN JUL AUG SEP OCT NOV DEC 1998 NaN NaN NaN NaN NaN NaN NaN NaN 1.06 -0.07 -0.52 -2.40 1999 -7.66 -11.85 -12.95 -12.32 -6.45 NaN NaN NaN 1.34 -0.45 -3.41 -9.49 2000 -11.40 -11.16 -12.76 -12.09 -8.94 -0.01 1.98 2.10 0.63 -0.07 -1.30 -5.59 2001 -9.27 -8.75 -11.62 NaN NaN -0.64 1.53 NaN 0.83 -0.08 -0.44 -3.14 2002 -7.62 -10.66 -9.97 -9.96 NaN NaN NaN NaN 0.77 -0.06 -0.60 -3.42 2003 -7.26 -9.01 -9.55 -8.98 -6.06 -0.50 1.72 1.89 0.35 -0.07 -0.42 -5.77 2004 -9.21 -12.92 -14.21 -13.18 Minimum Value Each Month (10 cm depth): Year JAN FEB MAR APR MAY JUN JUL AUG SEP OCT NOV DEC 1998 NaN NaN NaN NaN NaN NaN NaN NaN -0.06 -0.17 -1.18 -4.37 1999 -11.94 -13.87 -14.99 -15.06 -11.07 NaN NaN NaN -0.10 -1.57 -5.04 -11.56 2000 -12.93 -12.35 -13.52 -13.14 -10.69 -3.21 0.23 0.35 -0.10 -0.21 -2.94 -8.24 2001 -10.49 -9.99 -12.75 NaN NaN -6.34 0.08 NaN -0.10 -0.15 -1.14 -5.41 2002 -9.88 -11.58 -11.02 -11.06 NaN NaN NaN NaN -0.07 -0.11 -1.43 -6.88 2003 -8.44 -9.82 -10.76 -10.31 -7.31 -4.28 0.40 0.71 -0.10 -0.12 -1.66 -8.42 2004 -11.59 -14.43 -15.14 -15.06 Maximum Value Each Month (10 cm depth): Year JAN FEB MAR APR MAY JUN JUL AUG SEP OCT NOV DEC 1998 NaN NaN NaN NaN NaN NaN NaN NaN 3.26 -0.00 -0.09 -1.10 1999 -4.42 -10.61 -11.25 -11.05 -0.34 NaN NaN NaN 3.35 0.01 -1.55 -5.11 2000 -10.84 -9.43 -11.92 -10.73 -3.51 2.15 4.31 4.55 2.83 -0.02 -0.13 -3.00 2001 -8.28 -8.19 -9.99 NaN NaN 0.81 3.57 NaN 1.97 -0.02 -0.07 -1.16 2002 -5.07 -9.87 -9.19 -8.69 NaN NaN NaN NaN 3.36 0.19 -0.06 -0.91 2003 -6.59 -8.08 -8.42 -6.59 -4.43 1.26 3.37 3.97 2.01 0.00 -0.05 -1.72 2004 -6.47 -11.33 -12.37 -10.90 Anomaly Relative to the Climatological Mean (10 cm depth): Year JAN FEB MAR APR MAY JUN JUL AUG SEP OCT NOV DEC 1998 NaN NaN NaN NaN NaN NaN NaN NaN 0.23 0.06 0.60 2.57 1999 1.08 -1.13 -1.11 -1.01 NaN NaN NaN NaN 0.51 -0.32 -2.29 -4.53 2000 -2.67 -0.44 -0.91 -0.79 NaN NaN NaN NaN -0.20 0.06 -0.19 -0.62 2001 -0.53 1.98 0.22 NaN NaN NaN NaN NaN -0.00 0.06 0.67 1.83 2002 1.11 0.06 1.87 1.34 NaN NaN NaN NaN -0.06 0.07 0.52 1.55 2003 1.48 1.72 2.30 2.33 NaN NaN NaN NaN -0.48 0.06 0.69 -0.80 2004 -0.47 -2.20 -2.36 -1.87 Percent of Data Available during Each Month (10 cm depth): Year JAN FEB MAR APR MAY JUN JUL AUG SEP OCT NOV DEC 1998 0.00 0.00 0.00 0.00 0.00 0.00 0.00 0.00 100.00 100.00 100.00 100.00 1999 100.00 100.00 100.00 100.00 100.00 31.67 0.00 13.71 100.00 100.00 100.00 100.00 2000 100.00 100.00 100.00 100.00 100.00 100.00 100.00 99.46 100.00 100.00 100.00 100.00 2001 100.00 100.00 100.00 6.39 0.00 97.22 100.00 89.25 100.00 100.00 100.00 100.00 2002 100.00 100.00 100.00 100.00 27.69 0.00 0.00 74.46 100.00 100.00 100.00 100.00 2003 100.00 100.00 100.00 100.00 100.00 100.00 100.00 99.79 100.00 100.00 100.00 100.00 2004 100.00 100.00 100.00 100.00 Monthly Averages (120 cm depth): Year JAN FEB MAR APR MAY JUN JUL AUG SEP OCT NOV DEC 1998 NaN NaN NaN NaN NaN NaN NaN NaN -1.21 -1.07 -1.00 -0.96 1999 -3.12 -7.11 -8.92 -10.12 -8.65 NaN NaN NaN -1.25 -1.09 -1.01 -3.76 2000 -7.42 -8.55 -9.63 -10.32 -9.31 -5.51 -3.01 -2.00 -1.50 -1.29 -1.18 -2.73 2001 -5.90 -6.91 -8.31 NaN NaN -5.42 -2.94 NaN -1.51 -1.32 -1.19 -1.61 2002 -4.40 -7.08 -8.05 -8.45 NaN NaN NaN NaN -1.35 -1.19 -1.09 -1.68 2003 -4.50 -6.24 -7.33 -8.01 -6.84 -4.25 -2.43 -1.65 -1.34 -1.18 -1.08 -2.38 2004 -5.62 -8.76 -10.84 -11.37 Minimum Value Each Month (120 cm depth): Year JAN FEB MAR APR MAY JUN JUL AUG SEP OCT NOV DEC 1998 NaN NaN NaN NaN NaN NaN NaN NaN -1.34 -1.17 -1.04 -1.13 1999 -5.26 -7.88 -9.89 -10.35 -9.82 NaN NaN NaN -1.45 -1.22 -1.30 -6.17 2000 -8.28 -8.92 -10.33 -10.48 -10.05 -8.53 -3.79 -2.44 -1.65 -1.38 -1.24 -4.38 2001 -6.63 -7.18 -9.37 NaN NaN -8.32 -3.79 NaN -1.74 -1.41 -1.30 -2.86 2002 -5.80 -7.96 -8.26 -8.58 NaN NaN NaN NaN -1.53 -1.27 -1.14 -3.05 2003 -5.39 -7.00 -7.98 -8.17 -7.49 -6.09 -3.09 -2.01 -1.48 -1.28 -1.17 -4.29 2004 -7.46 -10.10 -11.19 -11.71 Maximum Value Each Month (120 cm depth): Year JAN FEB MAR APR MAY JUN JUL AUG SEP OCT NOV DEC 1998 NaN NaN NaN NaN NaN NaN NaN NaN -1.08 -1.02 -0.93 -0.89 1999 -1.13 -5.26 -7.88 -9.79 -5.91 NaN NaN NaN -1.11 -1.00 -0.89 -1.30 2000 -6.17 -8.28 -8.92 -10.05 -8.53 -3.73 -2.37 -1.63 -1.34 -1.22 -1.11 -1.22 2001 -4.38 -6.62 -7.18 NaN NaN -3.77 -2.19 NaN -1.38 -1.26 -1.14 -1.13 2002 -2.86 -5.79 -7.90 -8.21 NaN NaN NaN NaN -1.19 -1.09 -1.04 -1.04 2003 -3.10 -5.39 -7.00 -7.48 -6.09 -3.02 -1.94 -1.38 -1.21 -1.11 -1.02 -1.02 2004 -4.29 -7.44 -10.10 -10.88 Anomaly Relative to the Climatological Mean (120 cm depth): Year JAN FEB MAR APR MAY JUN JUL AUG SEP OCT NOV DEC 1998 NaN NaN NaN NaN NaN NaN NaN NaN 0.15 0.12 0.09 1.23 1999 2.04 0.33 -0.07 -0.47 NaN NaN NaN NaN 0.11 0.10 0.09 -1.58 2000 -2.26 -1.11 -0.78 -0.67 NaN NaN NaN NaN -0.14 -0.10 -0.09 -0.55 2001 -0.74 0.53 0.54 NaN NaN NaN NaN NaN -0.15 -0.13 -0.10 0.58 2002 0.76 0.36 0.79 1.20 NaN NaN NaN NaN 0.01 -0.00 -0.00 0.51 2003 0.66 1.20 1.51 1.64 NaN NaN NaN NaN 0.02 0.01 0.01 -0.20 2004 -0.46 -1.32 -1.99 -1.71 Percent of Data Available during Each Month (120 cm depth): Year JAN FEB MAR APR MAY JUN JUL AUG SEP OCT NOV DEC 1998 0.00 0.00 0.00 0.00 0.00 0.00 0.00 0.00 100.00 100.00 100.00 100.00 1999 100.00 100.00 100.00 100.00 100.00 31.67 0.00 13.71 100.00 100.00 100.00 100.00 2000 100.00 100.00 100.00 100.00 100.00 100.00 100.00 99.46 100.00 100.00 100.00 100.00 2001 100.00 100.00 100.00 6.39 0.00 97.22 100.00 89.25 100.00 100.00 100.00 100.00 2002 100.00 100.00 100.00 100.00 27.69 0.00 0.00 74.46 100.00 100.00 100.00 100.00 2003 100.00 100.00 100.00 100.00 100.00 100.00 100.00 99.79 100.00 100.00 100.00 100.00 2004 100.00 100.00 100.00 100.00 Table 1d. Statistical summaries of incident solar flux data at monthly resolution. Average, anomaly, and percentage of data available. 95 percent of the data must be available in order to calculate statistics. Periods with less than the 95 percent requirement are represented by NaN (not a number). Site name: Awuna1 Variable: Incident solar flux, in watts per meter squared File name: AK103_So_d_mon_stats.txt Date of file preparation: 25 Aug 2015 Name of file preparer: Frank Urban Monthly Averages: Year JAN FEB MAR APR MAY JUN JUL AUG SEP OCT NOV DEC 1998 NaN NaN NaN NaN NaN NaN NaN NaN NaN NaN NaN NaN 1999 NaN NaN NaN NaN NaN NaN NaN NaN NaN NaN NaN NaN 2000 NaN NaN NaN NaN NaN NaN NaN NaN 65.9 23.3 2.5 0.1 2001 1.2 18.4 76.0 NaN NaN NaN NaN NaN NaN NaN NaN NaN 2002 NaN NaN NaN NaN NaN NaN NaN NaN 66.4 21.3 1.5 0.1 2003 1.3 16.7 82.9 166.4 246.2 292.3 173.4 109.9 66.9 19.8 3.2 0.1 2004 1.2 15.6 83.6 184.4 Anomaly Relative to the Climatological Mean: Year JAN FEB MAR APR MAY JUN JUL AUG SEP OCT NOV DEC 1998 NaN NaN NaN NaN NaN NaN NaN NaN NaN NaN NaN NaN 1999 NaN NaN NaN NaN NaN NaN NaN NaN NaN NaN NaN NaN 2000 NaN NaN NaN NaN NaN NaN NaN NaN NaN NaN NaN NaN 2001 NaN NaN NaN NaN NaN NaN NaN NaN NaN NaN NaN NaN 2002 NaN NaN NaN NaN NaN NaN NaN NaN NaN NaN NaN NaN 2003 NaN NaN NaN NaN NaN NaN NaN NaN NaN NaN NaN NaN 2004 NaN NaN NaN NaN Percent of Data Available during Each Month: Year JAN FEB MAR APR MAY JUN JUL AUG SEP OCT NOV DEC 1998 0.0 0.0 0.0 0.0 0.0 0.0 0.0 0.0 0.0 0.0 0.0 0.0 1999 0.0 0.0 0.0 0.0 0.0 0.0 0.0 0.0 0.0 0.0 0.0 0.0 2000 0.0 0.0 0.0 0.0 0.0 0.0 0.0 49.7 100.0 100.0 100.0 100.0 2001 100.0 99.7 99.2 6.7 0.0 69.4 0.0 88.4 0.0 0.0 0.0 0.0 2002 0.0 0.0 0.0 0.0 0.0 0.0 0.0 74.7 100.0 100.0 100.0 100.0 2003 100.0 100.0 100.0 100.0 100.0 100.0 99.7 99.8 100.0 100.0 100.0 100.0 2004 99.7 100.0 99.9 99.9 Table 1e. Statistical summaries of reflected solar flux data at monthly resolution. Average, anomaly, and percentage of data available. 95 percent of the data must be available in order to calculate statistics. Periods with less than the 95 percent requirement are represented by NaN (not a number). Site name: Awuna1 Variable: Reflected solar flux, in watts per meter squared File name: AK103_So_u_mon_stats.txt Date of file preparation: 25 Aug 2015 Name of file preparer: Frank Urban Monthly Averages: Year JAN FEB MAR APR MAY JUN JUL AUG SEP OCT NOV DEC 1998 NaN NaN NaN NaN NaN NaN NaN NaN 18.0 21.6 2.7 0.0 1999 1.2 14.1 77.5 157.3 205.0 48.8 57.2 28.9 19.3 19.0 3.1 0.1 2000 1.0 17.2 78.2 169.0 234.5 95.0 42.0 27.2 26.9 25.8 2.8 0.1 2001 1.1 18.2 76.6 NaN NaN NaN NaN NaN NaN NaN NaN NaN 2002 NaN NaN NaN NaN NaN NaN NaN NaN 19.6 15.1 2.0 0.0 2003 1.1 14.9 73.3 146.8 211.3 102.2 43.9 27.3 30.6 13.3 2.9 -0.0 2004 0.9 14.9 69.8 163.2 Anomaly Relative to the Climatological Mean: Year JAN FEB MAR APR MAY JUN JUL AUG SEP OCT NOV DEC 1998 NaN NaN NaN NaN NaN NaN NaN NaN -4.8 2.7 0.0 -0.0 1999 0.1 -1.7 2.5 NaN NaN NaN NaN NaN -3.6 0.0 0.4 0.0 2000 -0.1 1.3 3.1 NaN NaN NaN NaN NaN 4.0 6.8 0.1 0.1 2001 0.1 2.3 1.5 NaN NaN NaN NaN NaN NaN NaN NaN NaN 2002 NaN NaN NaN NaN NaN NaN NaN NaN -3.3 -3.8 -0.7 -0.0 2003 0.0 -0.9 -1.8 NaN NaN NaN NaN NaN 7.7 -5.6 0.2 -0.1 2004 -0.1 -1.0 -5.3 NaN Percent of Data Available during Each Month: Year JAN FEB MAR APR MAY JUN JUL AUG SEP OCT NOV DEC 1998 0.0 0.0 0.0 0.0 0.0 0.0 0.0 0.0 100.0 99.2 100.0 100.0 1999 100.0 100.0 100.0 99.7 100.0 100.0 100.0 100.0 100.0 100.0 100.0 100.0 2000 100.0 100.0 99.7 100.0 100.0 99.4 100.0 99.7 100.0 100.0 100.0 100.0 2001 100.0 99.7 100.0 6.7 0.0 69.4 0.0 88.4 0.0 0.0 0.0 0.0 2002 0.0 0.0 0.0 0.0 0.0 0.0 0.0 74.7 100.0 100.0 100.0 100.0 2003 100.0 100.0 100.0 100.0 100.0 100.0 100.0 100.0 100.0 100.0 100.0 100.0 2004 100.0 100.0 100.0 100.0 Table 1f. Statistical summaries of rainfall data at monthly resolution. Maximum, accumulated total, and percentage of data available. 95 percent of the data must be available in order to calculate statistics. Periods with less than the 95 percent requirement are represented by NaN (not a number). Data for this station is not available Table 1g. Statistical summaries of snow depth data at monthly resolution. Average, minimum, maximum, anomaly, and percentage of data available. Anomalies are calculated relative to the entire available period of record for the given site. 90 percent of the data must be available in order to calculate statistics. Periods with less than the 90 percent requirement are represented by NaN (not a number). Site name: Awuna1 Variable: Snow depth, in centimeters File name: AK103_snowD_mon_stats.txt Date of file preparation: 25 Aug 2015 Name of file preparer: Frank Urban Monthly Averages: Year JAN FEB MAR APR MAY JUN JUL AUG SEP OCT NOV DEC 1998 NaN NaN NaN NaN NaN NaN NaN NaN NaN NaN NaN NaN 1999 NaN NaN NaN NaN NaN NaN NaN NaN NaN NaN NaN NaN 2000 NaN NaN NaN NaN NaN NaN NaN 17.1 15.1 12.3 21.7 32.8 2001 39.8 44.0 46.8 NaN NaN NaN NaN 2.6 NaN NaN NaN NaN 2002 NaN NaN NaN NaN NaN NaN NaN 15.5 6.5 6.9 11.2 24.2 2003 33.6 50.8 61.5 59.0 57.7 17.5 12.6 11.6 3.0 11.0 31.5 41.8 2004 40.9 43.1 47.9 50.0 Minimum Value Each Month: Year JAN FEB MAR APR MAY JUN JUL AUG SEP OCT NOV DEC 1998 NaN NaN NaN NaN NaN NaN NaN NaN NaN NaN NaN NaN 1999 NaN NaN NaN NaN NaN NaN NaN NaN NaN NaN NaN NaN 2000 NaN NaN NaN NaN NaN NaN NaN 6.2 -0.8 4.8 14.2 29.1 2001 32.1 38.4 43.2 NaN NaN NaN NaN 0.2 NaN NaN NaN NaN 2002 NaN NaN NaN NaN NaN NaN NaN 8.1 -0.0 -0.5 3.6 12.8 2003 27.0 35.8 57.4 55.8 53.6 1.6 9.3 4.8 0.3 0.1 16.7 40.4 2004 39.7 40.4 43.4 46.1 Maximum Value Each Month: Year JAN FEB MAR APR MAY JUN JUL AUG SEP OCT NOV DEC 1998 NaN NaN NaN NaN NaN NaN NaN NaN NaN NaN NaN NaN 1999 NaN NaN NaN NaN NaN NaN NaN NaN NaN NaN NaN NaN 2000 NaN NaN NaN NaN NaN NaN NaN 24.8 25.4 21.1 33.3 34.0 2001 47.0 48.3 53.9 NaN NaN NaN NaN 5.4 NaN NaN NaN NaN 2002 NaN NaN NaN NaN NaN NaN NaN 19.8 12.4 14.0 20.0 28.8 2003 40.6 60.4 64.3 64.2 63.3 52.5 17.1 19.3 6.1 24.2 42.7 45.0 2004 42.1 48.6 52.7 53.3 Anomaly Relative to the Climatological Mean: Year JAN FEB MAR APR MAY JUN JUL AUG SEP OCT NOV DEC 1998 NaN NaN NaN NaN NaN NaN NaN NaN NaN NaN NaN NaN 1999 NaN NaN NaN NaN NaN NaN NaN NaN NaN NaN NaN NaN 2000 NaN NaN NaN NaN NaN NaN NaN NaN NaN NaN NaN NaN 2001 NaN NaN NaN NaN NaN NaN NaN NaN NaN NaN NaN NaN 2002 NaN NaN NaN NaN NaN NaN NaN NaN NaN NaN NaN NaN 2003 NaN NaN NaN NaN NaN NaN NaN NaN NaN NaN NaN NaN 2004 NaN NaN NaN NaN Percent of Data Available during Each Month: Year JAN FEB MAR APR MAY JUN JUL AUG SEP OCT NOV DEC 1998 0.0 0.0 0.0 0.0 0.0 0.0 0.0 0.0 0.0 0.0 0.0 0.0 1999 0.0 0.0 0.0 0.0 0.0 0.0 0.0 0.0 0.0 0.0 0.0 0.0 2000 0.0 0.0 0.0 0.0 0.0 0.0 0.0 48.4 96.7 100.0 100.0 100.0 2001 98.4 100.0 100.0 5.0 0.0 0.0 0.0 85.5 0.0 0.0 0.0 0.0 2002 0.0 0.0 0.0 0.0 0.0 0.0 0.0 53.2 98.3 98.4 100.0 100.0 2003 100.0 92.9 100.0 100.0 100.0 98.3 95.2 93.5 100.0 100.0 96.7 100.0 2004 100.0 96.6 95.2 98.3 Table 1h. Statistical summaries of soil moisture data at monthly resolution. Average, minimum, maximum, anomaly, and percentage of data available. Anomalies are calculated relative to the entire available period of record for the given site. 95 percent of the data must be available in order to calculate statistics. Periods with less than the 95 percent requirement are represented by NaN (not a number). Data for this station is not available Table 1i. Statistical summaries of surface pressure data at monthly resolution. Average, minimum, maximum, anomaly, and percentage of data available. Anomalies are calculated relative to the entire available period of record for the given site. 95 percent of the data must be available in order to calculate statistics. Periods with less than the 95 percent requirement are represented by NaN (not a number). Data for this station is not available Table 2a. Statistical summaries of air temperature data at seasonal and annual resolution. Average, minimum, maximum, anomaly, and percentage of data available. Anomalies are calculated relative to the entire available period of record for the given site. 95 percent of the data must be available in order to calculate statistics. Periods with less than the 95 percent requirement are represented by NaN (not a number). Site name: Awuna1 Variable: Air temperature, in degrees Celsius File name: AK103_Tair_sea_stats.txt Date of file preparation: 25 Aug 2015 Name of file preparer: Frank Urban Seasonal/Annual Averages: Year WINTER SPRING SUMMER AUTUMN ANNUAL 1998 NaN NaN NaN -7.02 NaN 1999 -25.50 -16.56 9.50 -11.35 -11.82 2000 -26.90 -17.36 8.52 -10.32 -10.62 2001 -21.47 NaN NaN NaN NaN 2002 NaN NaN NaN -6.38 NaN 2003 -23.41 -13.10 7.35 -7.43 -9.51 2004 -27.71 Minimum Value Each Season/Year: Year WINTER SPRING SUMMER AUTUMN ANNUAL 1998 NaN NaN NaN -28.32 NaN 1999 -46.16 -39.80 -3.63 -33.65 -46.16 2000 -46.12 -36.24 -5.54 -33.56 -41.65 2001 -41.19 NaN NaN NaN NaN 2002 NaN NaN NaN -30.74 NaN 2003 -40.67 -35.39 -3.42 -34.85 -40.67 2004 -46.07 Maximum Value Each Season/Year: Year WINTER SPRING SUMMER AUTUMN ANNUAL 1998 NaN NaN NaN 13.00 NaN 1999 -0.57 15.36 25.75 13.78 25.75 2000 0.48 6.61 26.30 10.61 26.30 2001 -0.52 NaN NaN NaN NaN 2002 NaN NaN NaN 12.51 NaN 2003 -0.45 6.21 22.20 10.50 22.20 2004 -3.15 Anomaly Relative to the Climatological Mean: Year WINTER SPRING SUMMER AUTUMN ANNUAL 1998 NaN NaN NaN 1.48 NaN 1999 -0.50 NaN NaN -2.85 NaN 2000 -1.90 NaN NaN -1.82 NaN 2001 3.53 NaN NaN NaN NaN 2002 NaN NaN NaN 2.13 NaN 2003 1.59 NaN NaN 1.07 NaN 2004 -2.71 Percent of Data Available during Each Season/Year: Year WINTER SPRING SUMMER AUTUMN ANNUAL 1998 0.00 0.00 0.00 100.00 0.00 1999 100.00 100.00 100.00 100.00 100.00 2000 100.00 100.00 99.91 100.00 99.98 2001 100.00 35.87 52.54 0.00 38.45 2002 0.00 0.00 25.18 100.00 39.77 2003 100.00 100.00 100.00 100.00 100.00 2004 100.00 Table 2b. Statistical summaries of wind speed data at seasonal and annual resolution. Average, maximum, and percentage of data available. 95 percent of the data must be available in order to calculate statistics. Periods with less than the 95 percent requirement are represented by NaN (not a number). Data for this station is not available Table 2c. Statistical summaries of ground temperature data at 10- and 120- centimeter depths at seasonal and annual resolution. Average, minimum, maximum, anomaly, and percentage of data available. Anomalies are calculated relative to the entire available period of record for the given site. 95 percent of the data must be available in order to calculate statistics. Periods with less than the 95 percent requirement are represented by NaN (not a number). Site name: Awuna1 Variable: Ground temperature, in degrees Celsius File name: AK103_Tg_sea_stats.txt Date of file preparation: 25 Aug 2015 Name of file preparer: Frank Urban Seasonal/Annual Averages (10 cm depth): Year WINTER SPRING SUMMER AUTUMN ANNUAL 1998 NaN NaN NaN 0.15 NaN 1999 -7.15 -10.55 NaN -0.83 NaN 2000 -10.68 -11.25 1.37 -0.24 -4.87 2001 -7.84 NaN 0.95 0.10 NaN 2002 -7.03 NaN NaN 0.04 NaN 2003 -6.48 -8.19 1.13 -0.05 -2.99 2004 -9.22 Minimum Value Each Season/Year (10 cm depth): Year WINTER SPRING SUMMER AUTUMN ANNUAL 1998 NaN NaN NaN -1.18 NaN 1999 -13.87 -15.06 NaN -5.04 NaN 2000 -12.93 -13.52 -3.21 -2.94 -13.52 2001 -10.49 NaN -6.34 -1.14 NaN 2002 -11.58 NaN NaN -1.43 NaN 2003 -9.82 -10.76 -4.28 -1.66 -10.76 2004 -14.43 Maximum Value Each Season/Year (10 cm depth): Year WINTER SPRING SUMMER AUTUMN ANNUAL 1998 NaN NaN NaN 3.26 NaN 1999 -1.10 -0.34 NaN 3.35 NaN 2000 -5.11 -3.51 4.55 2.83 4.55 2001 -3.00 NaN 3.57 1.97 NaN 2002 -1.16 NaN NaN 3.36 NaN 2003 -0.91 -4.43 3.97 2.01 3.97 2004 -1.72 Anomaly Relative to the Climatological Mean (10 cm depth): Year WINTER SPRING SUMMER AUTUMN ANNUAL 1998 NaN NaN NaN 0.29 NaN 1999 0.91 NaN NaN -0.70 NaN 2000 -2.61 NaN NaN -0.11 NaN 2001 0.23 NaN NaN 0.24 NaN 2002 1.04 NaN NaN 0.18 NaN 2003 1.59 NaN NaN 0.09 NaN 2004 -1.16 Percent of Data Available during Each Season/Year (10 cm depth): Year WINTER SPRING SUMMER AUTUMN ANNUAL 1998 0.00 0.00 0.00 100.00 0.00 1999 100.00 100.00 14.95 100.00 78.56 2000 100.00 100.00 99.82 100.00 99.95 2001 100.00 35.78 95.47 100.00 82.67 2002 100.00 75.63 25.09 100.00 74.98 2003 100.00 100.00 99.92 100.00 99.98 2004 100.00 Seasonal/Annual Averages (120 cm depth): Year WINTER SPRING SUMMER AUTUMN ANNUAL 1998 NaN NaN NaN -1.09 NaN 1999 -3.62 -9.22 NaN -1.11 NaN 2000 -6.54 -9.75 -3.49 -1.32 -5.19 2001 -5.13 NaN -3.44 -1.34 NaN 2002 -4.27 NaN NaN -1.21 NaN 2003 -4.07 -7.39 -2.66 -1.20 -3.28 2004 -5.52 Minimum Value Each Season/Year (120 cm depth): Year WINTER SPRING SUMMER AUTUMN ANNUAL 1998 NaN NaN NaN -1.34 NaN 1999 -7.88 -10.35 NaN -1.45 NaN 2000 -8.92 -10.48 -8.53 -1.65 -10.48 2001 -7.18 NaN -8.32 -1.74 NaN 2002 -7.96 NaN NaN -1.53 NaN 2003 -7.00 -8.17 -6.09 -1.48 -8.17 2004 -10.10 Maximum Value Each Season/Year (120 cm depth): Year WINTER SPRING SUMMER AUTUMN ANNUAL 1998 NaN NaN NaN -0.93 NaN 1999 -0.89 -5.91 NaN -0.89 NaN 2000 -1.30 -8.53 -1.63 -1.11 -1.11 2001 -1.22 NaN -1.54 -1.14 NaN 2002 -1.13 NaN NaN -1.04 NaN 2003 -1.04 -6.09 -1.38 -1.02 -1.02 2004 -1.02 Anomaly Relative to the Climatological Mean (120 cm depth): Year WINTER SPRING SUMMER AUTUMN ANNUAL 1998 NaN NaN NaN 0.12 NaN 1999 1.24 NaN NaN 0.10 NaN 2000 -1.68 NaN NaN -0.11 NaN 2001 -0.27 NaN NaN -0.13 NaN 2002 0.58 NaN NaN 0.00 NaN 2003 0.79 NaN NaN 0.01 NaN 2004 -0.66 Percent of Data Available during Each Season/Year (120 cm depth): Year WINTER SPRING SUMMER AUTUMN ANNUAL 1998 0.00 0.00 0.00 100.00 0.00 1999 100.00 100.00 14.95 100.00 78.56 2000 100.00 100.00 99.82 100.00 99.95 2001 100.00 35.78 95.47 100.00 82.67 2002 100.00 75.63 25.09 100.00 74.98 2003 100.00 100.00 99.92 100.00 99.98 2004 100.00 Table 2d. Statistical summaries of incident solar-flux data at seasonal and annual resolution. Average, anomaly, and percentage of data available. 95 percent of the data must be available in order to calculate statistics. Periods with less than the 95 percent requirement are represented by NaN (not a number). Site name: Awuna1 Variable: Incident solar flux, in watts per meter squared File name: AK103_So_d_sea_stats.txt Date of file preparation: 25 Aug 2015 Name of file preparer: Frank Urban Seasonal/Annual Averages: Year WINTER SPRING SUMMER AUTUMN ANNUAL 1998 NaN NaN NaN NaN NaN 1999 NaN NaN NaN NaN NaN 2000 NaN NaN NaN 30.5 NaN 2001 6.1 NaN NaN NaN NaN 2002 NaN NaN NaN 29.6 NaN 2003 5.7 165.1 183.4 29.9 80.0 2004 5.4 Anomaly Relative to the Climatological Mean: Year WINTER SPRING SUMMER AUTUMN ANNUAL 1998 NaN NaN NaN NaN NaN 1999 NaN NaN NaN NaN NaN 2000 NaN NaN NaN NaN NaN 2001 NaN NaN NaN NaN NaN 2002 NaN NaN NaN NaN NaN 2003 NaN NaN NaN NaN NaN 2004 NaN Percent of Data Available during Each Season/Year: Year WINTER SPRING SUMMER AUTUMN ANNUAL 1998 0.0 0.0 0.0 0.0 0.0 1999 0.0 0.0 0.0 0.0 0.0 2000 0.0 0.0 16.8 100.0 37.5 2001 99.9 35.6 52.4 0.0 38.3 2002 0.0 0.0 25.2 100.0 39.8 2003 100.0 100.0 99.8 100.0 100.0 2004 99.9 Table 2e. Statistical summaries of reflected solar-flux data at seasonal and annual resolution. Average, anomaly, and percentage of data available. 95 percent of the data must be available in order to calculate statistics. Periods with less than the 95 percent requirement are represented by NaN (not a number). Site name: Awuna1 Variable: Reflected solar flux, in watts per meter squared File name: AK103_So_u_sea_stats.txt Date of file preparation: 25 Aug 2015 Name of file preparer: Frank Urban Seasonal/Annual Averages: Year WINTER SPRING SUMMER AUTUMN ANNUAL 1998 NaN NaN NaN 14.2 NaN 1999 4.8 146.5 45.0 13.9 52.9 2000 5.9 160.5 54.2 18.6 60.0 2001 6.1 NaN NaN NaN NaN 2002 NaN NaN NaN 12.3 NaN 2003 5.0 143.8 54.5 15.6 44.4 2004 5.1 Anomaly Relative to the Climatological Mean: Year WINTER SPRING SUMMER AUTUMN ANNUAL 1998 NaN NaN NaN -0.7 NaN 1999 -0.5 NaN NaN -1.0 NaN 2000 0.5 NaN NaN 3.7 NaN 2001 0.7 NaN NaN NaN NaN 2002 NaN NaN NaN -2.6 NaN 2003 -0.3 NaN NaN 0.7 NaN 2004 -0.3 Percent of Data Available during Each Season/Year: Year WINTER SPRING SUMMER AUTUMN ANNUAL 1998 0.0 0.0 0.0 99.7 0.0 1999 100.0 99.9 100.0 100.0 100.0 2000 100.0 99.9 99.7 100.0 99.9 2001 99.9 35.9 52.4 0.0 38.4 2002 0.0 0.0 25.2 100.0 39.8 2003 100.0 100.0 100.0 100.0 100.0 2004 100.0 Table 2f. Statistical summaries of rainfall data at seasonal and annual resolution. Maximum, accumulated total, and percentage of data available. 95 percent of the data must be available in order to calculate statistics. Periods with less than the 95 percent requirement are represented by NaN (not a number). Data for this station is not available Table 2g. Statistical summaries of snow depth data at seasonal and annual resolution. Average, minimum, maximum, anomaly, and percentage of data available. Anomalies are calculated relative to the entire available period of record for the given site. 90 percent of the data must be available in order to calculate statistics. Periods with less than the 90 percent requirement are represented by NaN (not a number). Site name: Awuna1 Variable: Snow depth, in centimeters File name: AK103_snowD_sea_stats.txt Date of file preparation: 25 Aug 2015 Name of file preparer: Frank Urban Seasonal/Annual Averages: Year WINTER SPRING SUMMER AUTUMN ANNUAL 1998 NaN NaN NaN NaN NaN 1999 NaN NaN NaN NaN NaN 2000 NaN NaN 17.1 16.3 20.2 2001 38.7 46.6 2.6 NaN 34.3 2002 NaN NaN 15.5 8.2 12.7 2003 35.4 59.4 13.9 15.0 32.7 2004 41.9 Minimum Value Each Season/Year: Year WINTER SPRING SUMMER AUTUMN ANNUAL 1998 NaN NaN NaN NaN NaN 1999 NaN NaN NaN NaN NaN 2000 NaN NaN 6.2 -0.8 -0.8 2001 29.1 40.2 0.2 NaN 0.2 2002 NaN NaN 8.1 -0.5 -0.5 2003 12.8 53.6 1.6 0.1 0.1 2004 39.7 Maximum Value Each Season/Year: Year WINTER SPRING SUMMER AUTUMN ANNUAL 1998 NaN NaN NaN NaN NaN 1999 NaN NaN NaN NaN NaN 2000 NaN NaN 24.8 33.3 34.0 2001 48.3 53.9 5.4 NaN 53.9 2002 NaN NaN 19.8 20.0 28.8 2003 60.4 64.3 52.5 42.7 64.3 2004 48.6 Anomaly Relative to the Climatological Mean: Year WINTER SPRING SUMMER AUTUMN ANNUAL 1998 NaN NaN NaN NaN NaN 1999 NaN NaN NaN NaN NaN 2000 NaN NaN NaN NaN NaN 2001 NaN NaN NaN NaN NaN 2002 NaN NaN NaN NaN NaN 2003 NaN NaN NaN NaN NaN 2004 NaN Percent of Data Available during Each Season/Year: Year WINTER SPRING SUMMER AUTUMN ANNUAL 1998 0.0 0.0 0.0 0.0 0.0 1999 0.0 0.0 0.0 0.0 0.0 2000 0.0 0.0 16.3 98.9 37.2 2001 99.4 35.3 28.8 0.0 32.2 2002 0.0 0.0 17.9 98.9 37.7 2003 97.8 100.0 95.7 98.9 98.1 2004 98.9 Table 2h. Statistical summaries of soil moisture data at seasonal and annual resolution. Average, minimum, maximum, anomaly, and percentage of data available. Anomalies are calculated relative to the entire available period of record for the given site. 95 percent of the data must be available in order to calculate statistics. Periods with less than the 95 percent requirement are represented by NaN (not a number). Data for this station is not available Table 2i. Statistical summaries of surface pressure data at seasonal and annual resolution. Average, minimum, maximum, anomaly, and percentage of data available. Anomalies are calculated relative to the entire available period of record for the given site. 95 percent of the data must be available in order to calculate statistics. Periods with less than the 95 percent requirement are represented by NaN (not a number). Data for this station is not available |
First posted March 4, 2016
For additional information contact: Part or all of this report is presented in Portable Document Format (PDF). For best results viewing and printing PDF documents, it is recommended that you download the documents to your computer and open them with Adobe Reader. PDF documents opened from your browser may not display or print as intended. Download the latest version of Adobe Reader, free of charge. More information about viewing, downloading, and printing report files can be found here. |

![]() U.S. Department of the Interior |
U.S. Geological Survey
U.S. Department of the Interior |
U.S. Geological Survey
URL: http://pubsdata.usgs.gov/pubs/ds/0977/Awuna1/Awuna1.html
Page Contact Information: GS Pubs Web Contact
Page Last Modified: Monday, 28-Nov-2016 20:44:59 EST
