Data Series 980
| Data ProcessingLMG WSC ProcessingUsing attitude and trajectory information collected during the survey by the POS MV system and GPS data from a base station that was set up on a nearby benchmark, the Applanix POSPac mobile mapping suite (MMS) software uses differential correction algorithms to compute a smoothed best estimate of trajectory (SBET) file. In addition, the POSPac MMS generates a file describing the accuracy of the post-processed solution. The SBET file is then applied to the raw T-lidar data along with the boresight parameter file using Optech Parser software to produce a geo-referenced point-cloud dataset. Using Innovmetric Polyworks software, the point clouds were filtered using several methods: (1) intensity, (2) height above a digital elevation model (DEM) surface, and (3) visual inspection. A preliminary DEM surface was created using a 0.25-meter (m) grid, and points that were 0.1 m higher than the generated surface were removed. Vegetation was removed by selecting points above a DEM surface. Each point within the point cloud has an intensity value (ranges from 0 to 255) associated with it that represents the amount of near-infrared reflectance received by the T-lidar instrument. The points with relatively low intensity values were examined and removed, if necessary. Once the data were filtered, an updated DEM surface was generated and manually edited to remove any remaining outliers. Additionally, the data were edited to smooth out any differences caused by temporal data collection. The final xyz point-cloud data are then created at 1-m horizontal resolution (fig. 2). The errors associated with the collection of elevation data can be classified as systematic or random. Systematic errors are those that can be measured or modeled through calibration (Byrnes and others, 2002). Random errors are a result of the limitations of the measuring device and an inability to perfectly model the systematic errors. The POSPac MMS software also creates a positional accuracy file, which is compared to 38 control points occupied prior to the T-lidar survey using a real-time kinematic global positioning system (RTK-GPS) unit to evaluate the accuracy of the post-processed SBET solution. The horizontal accuracy of the post-processed file has a minimum and maximum root mean square error (RMSE) of 0.4 and 1.2 centimeters (cm), respectively. The RMSE of the vertical accuracy ranged from 0.7 to 1.8 cm. Stated accuracies are based on peak-to-peak errors. SPCMSC ProcessingWithin Esri’s ArcCatalog, the ASCII xyz point-cloud file was converted to an ArcGIS multipoint feature using the ASCII 3D To Feature Class tool. The Feature Class Z To ASCII tool was used to revert the point data back to ASCII xyz format for publication in a nonproprietary format and projected in Universal Transverse Mercator (UTM) Zone 18N. The ASCII xyz point-cloud file was also converted to an ArcGIS multipoint feature using the ASCII 3D To Feature Class tool. An ArcGIS Digital Terrain Model was built from the xyz feature class using the Create Terrain tool. A 1-m raster DEM was exported from the terrain surface using the Terrain to Raster tool (fig. 4). The uncertainty for the interpolated DEM was determined using a methodology established by Lentz and Hapke (2011) and Lentz and others (2013) by withholding a random distribution of 10 percent of the point data from the gridding process (Create Terrain and Build Terrain tools in ArcGIS), comparing the elevations of the withheld points to the gridded surface, and calculating a RMSE on the basis of the elevation differences. The resulting RMSE uncertainty of the interpolated surface was determined to be ±0.05 m. 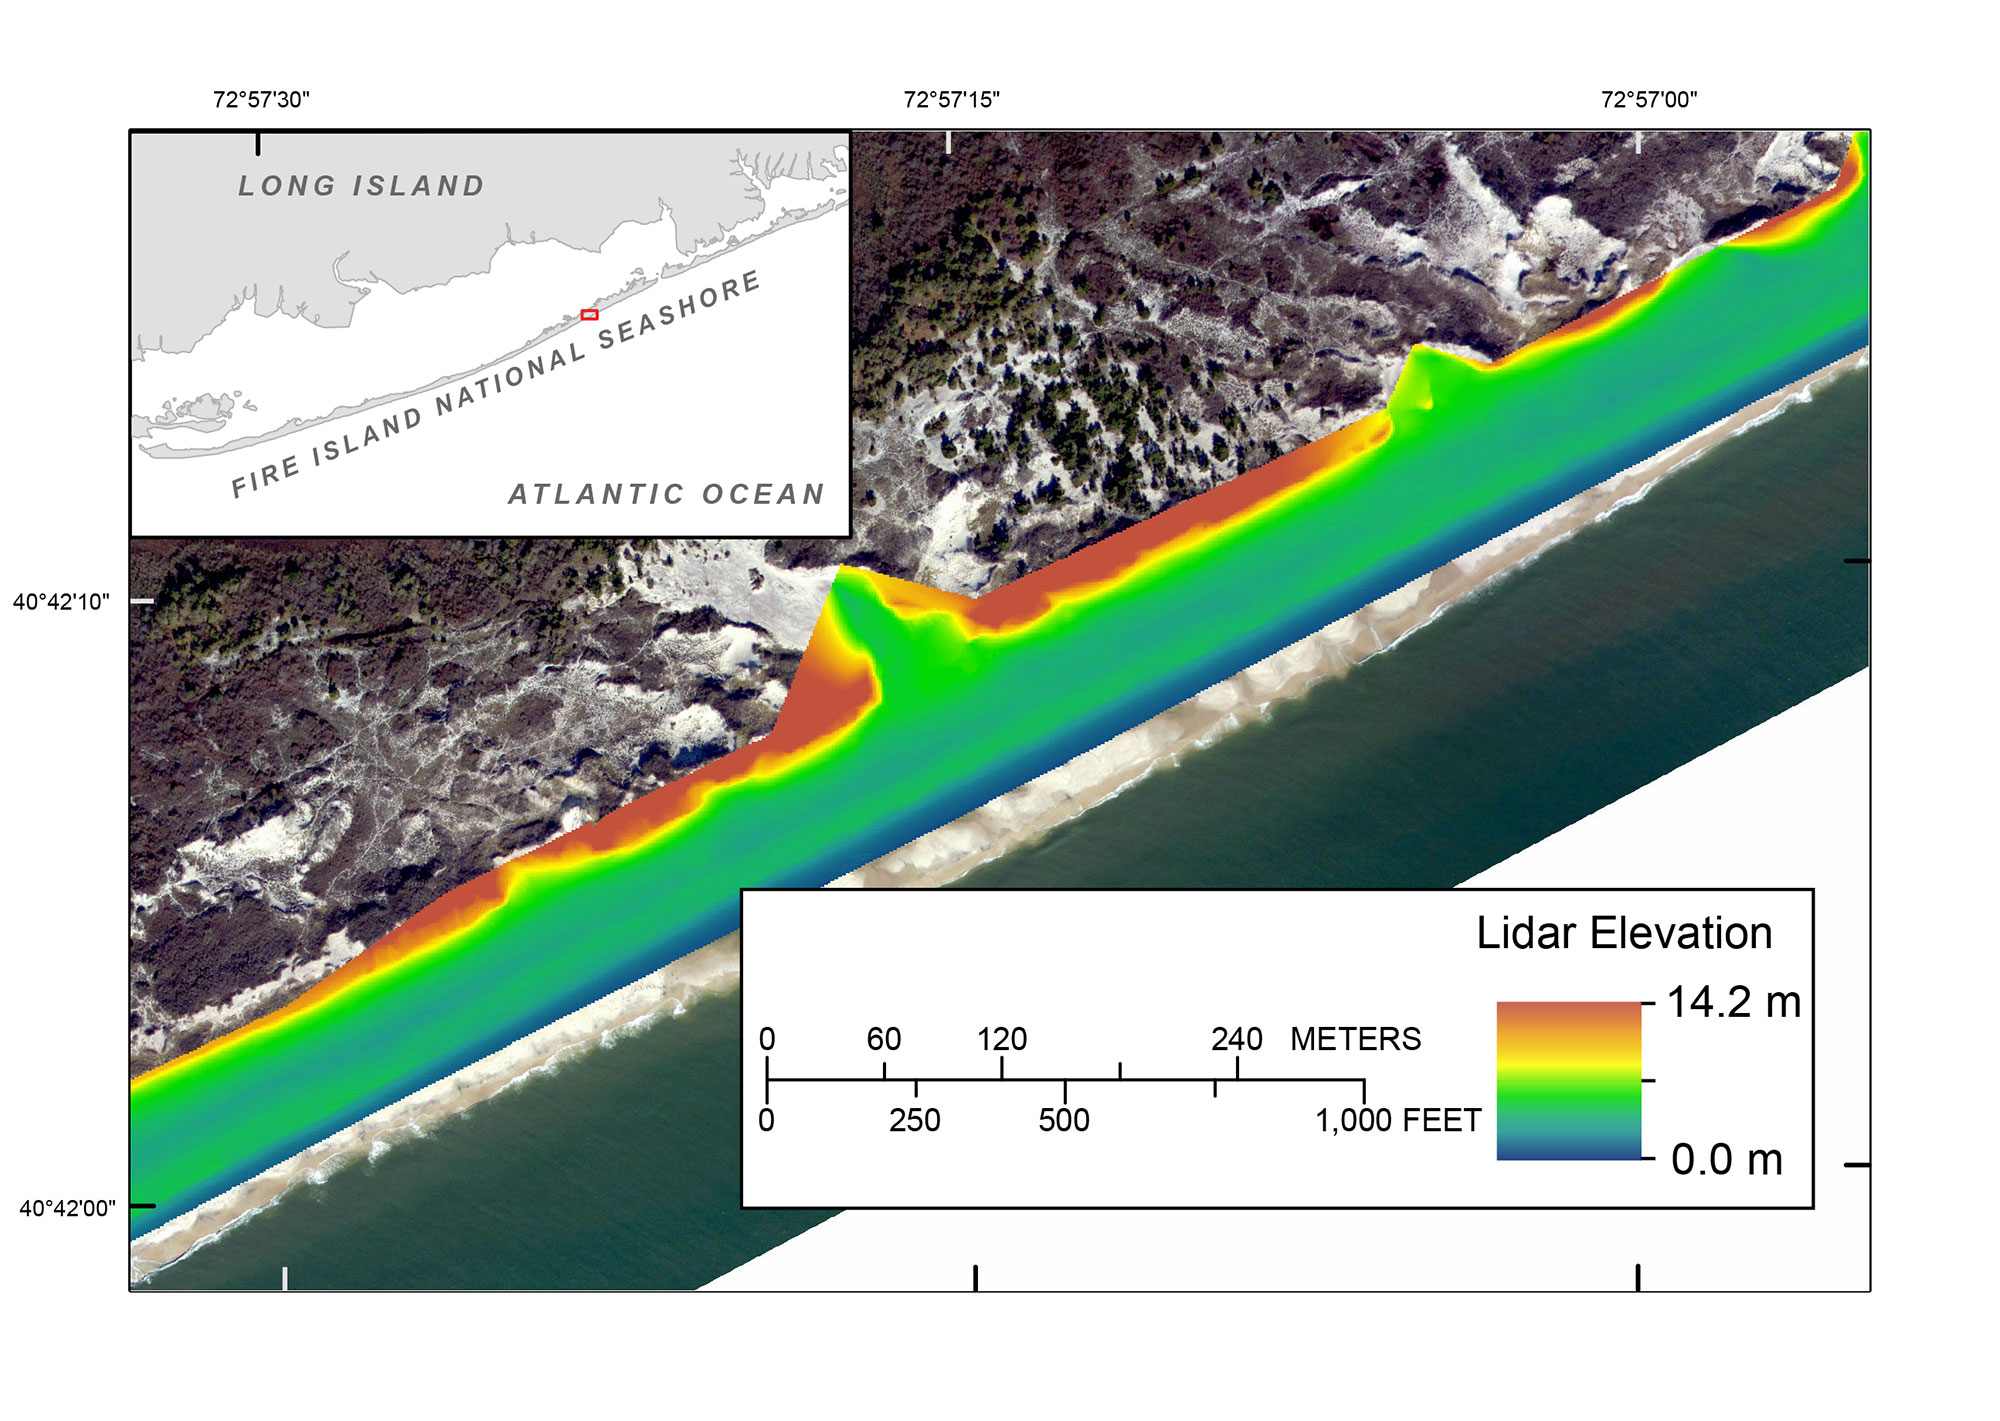 Figure 4. Processed terrestrial-based lidar digital elevation model (DEM) along central Fire Island, New York. The red box on the inset indicates the map location. [larger version] |

![]() U.S. Department of the Interior |
U.S. Geological Survey
U.S. Department of the Interior |
U.S. Geological Survey
URL: http://pubsdata.usgs.gov/pubs/ds/0980/ds980_data-processing.html
Page Contact Information: GS Pubs Web Contact
Page Last Modified: Monday, 28-Nov-2016 20:45:20 EST
