Data Series 989
|
IntroductionHurricane Sandy was the largest Atlantic tropical cyclone in the National Hurricane Center’s extensive track record. The storm passed offshore of the Maryland-Virginia coastline before making landfall near Brigantine, New Jersey, on October 29, 2012 (Blake and others, 2013). Hurricane Sandy created washover deposits and changed the shoreline of Assateague Island off the coast of Virginia and Maryland (Bernier and others, 2016). Assateague Island (fig. 1) is a wave-dominated island that remains undeveloped; consequently, it is an excellent area to study coastal change as a result of storm impacts. The barrier island system is bordered by Chincoteague and Sinepuxent Bay to the west, the Atlantic Ocean to the east, Ocean City Inlet to the north, and Chincoteague Inlet to the south. Assateague Island has a north-northeast–south-southwest trend, and the longshore current flows predominantly to the south (Seminack and McBride, 2015). As part of the U.S. Geological Survey (USGS) response to Hurricane Sandy (Buxton and others, 2013), USGS scientists collected and analyzed imagery, elevation, sediment, and geophysical data to evaluate and update coastal change models and predictive capabilities (for example, see Stockdon and others, 2013; Sopkin and others, 2014; Ellis and others, 2015; Guy, 2015; Smith and others, 2015; Bernier and others, 2016). The GPR data presented in this report were collected as part of the Barrier Island Wetland Change Assessment (BIWC) (http://coastal.er.usgs.gov/sandy-wetland-assessment/). The primary goal of the BIWC project is to quantify the physical changes that storm processes have on barrier-island wetlands and marsh ecosystems. Storm processes can impact marsh and wetland environments in varying and sometimes compounded ways: (1) storms can erode and therefore decrease the area of a marsh environment, (2) deposition of inorganic sediments from overwash processes can result in accretion or expansion of the marsh—possibly reducing the stress caused by sea level rise on marsh flora and fauna—(3) storm deposition can completely bury the marsh (causing loss of marsh) with inorganic sediment (Morton and Barras, 2011; Smith and others, 2013). Studying a coastal area recently impacted by storm processes provides valuable information about the spatial distribution of coastal change (as type of change and magnitude) caused by a storm. This information, combined with pre-storm and storm-forcing data (for example, storm surge, wind velocity, and wave height), can provide insight into why and how a specific portion of a barrier island was impacted. When the data are compiled, they can be integrated into a coastal vulnerability model, and the scenarios produced can be assessed using the observed data (Plant and Stockdon, 2012; Stockdon and others, 2013). Once validated, the coastal vulnerability model can then be applied to other coastal settings to try and predict an area’s risk to severe coastal change as a result of storms.
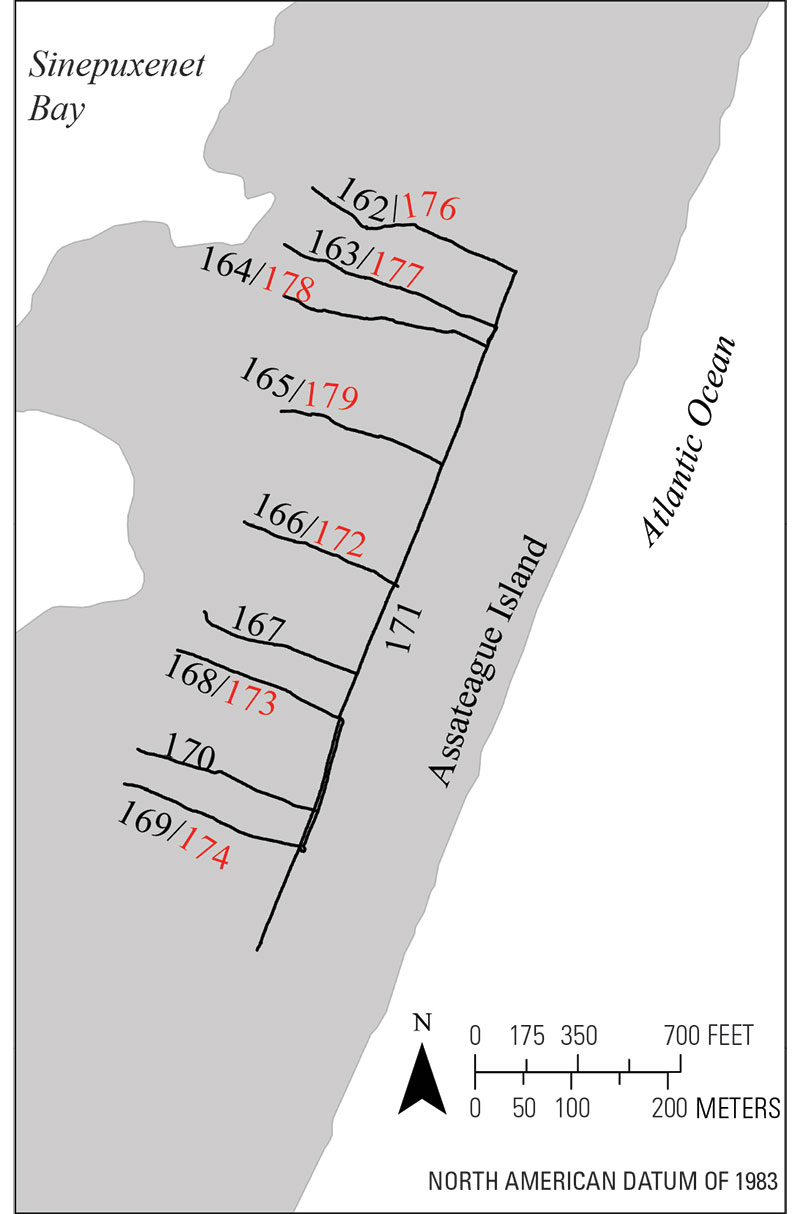
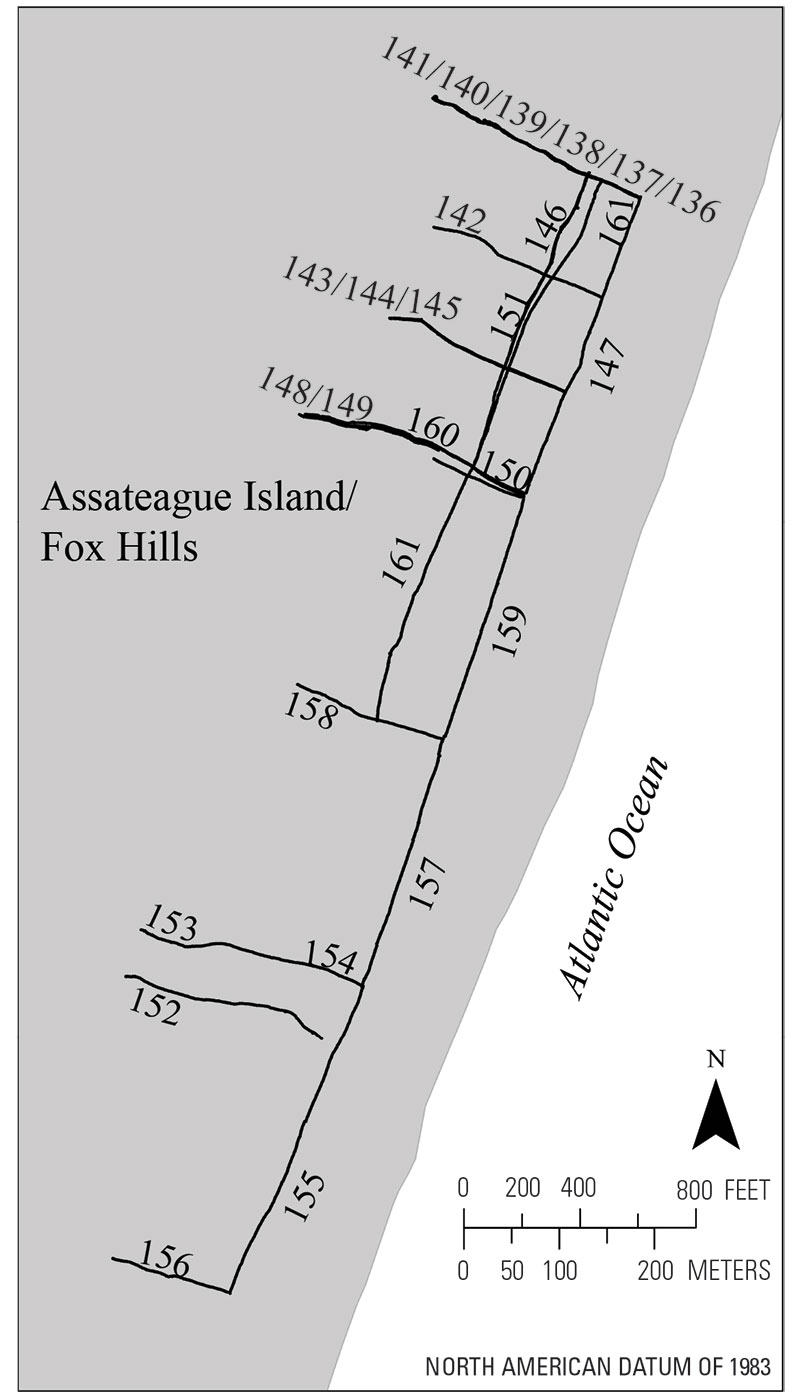
Study sites were determined based on pre- and post-storm aerial photography. The GPR data presented in this data series are used in conjunction with core data presented in separate reports (Bernier and others, 2016) to quantify washover thickness and extent. Furthermore, the report’s GPR data can be used to image deeper stratigraphic features that may aid in explaining controls on washover deposition. Stratigraphic features such as infilled inlets affect the modern geomorphology of the barrier island by providing topographic lows susceptible to overwash and erosion from storm events. Conversely, the continuous overwash and subsequent infilling of a topographic low by washover deposits can, in turn, increase island elevations and make the island more resilient to breaching by future storm events (Culver and others, 2004; Smith and others, 2009; Seminack and Buynevich, 2013). Paleo-inlets can thereby make a portion of the barrier island susceptible or resilient to overwash events, depending on the degree to which the paleo-inlet has been infilled. This report serves as an archive of GPR and GPS data collected from two locations on Assateague Island (fig. 2) in October 2014 (USGS FAN 2014-322-FA). The study area consists of a northern study site located just north of the Md. Route 611–Verrazano Bridge (fig. 3) and a southern site approximately 14 kilometers (km) to the south, near Fox Hills (fig. 4). GPR data were collected along shore parallel and shore perpendicular lines based on the location of coring transects, and core data will be published in separate manuscripts (Bernier and others, 2016). Data products, including raw GPR and processed GPS data, elevation corrected GPR profiles, and accompanying Federal Geographic Data Committee (FGDC) metadata, can be downloaded from the Data Downloads page.
|

![]() U.S. Department of the Interior |
U.S. Geological Survey
U.S. Department of the Interior |
U.S. Geological Survey
URL: http://pubsdata.usgs.gov/pubs/ds/0989/ds989_intro.html
Page Contact Information: GS Pubs Web Contact
Page Last Modified: Monday, 28-Nov-2016 20:50:05 EST