Data Series 1060
| Field and Laboratory MethodsField Methods
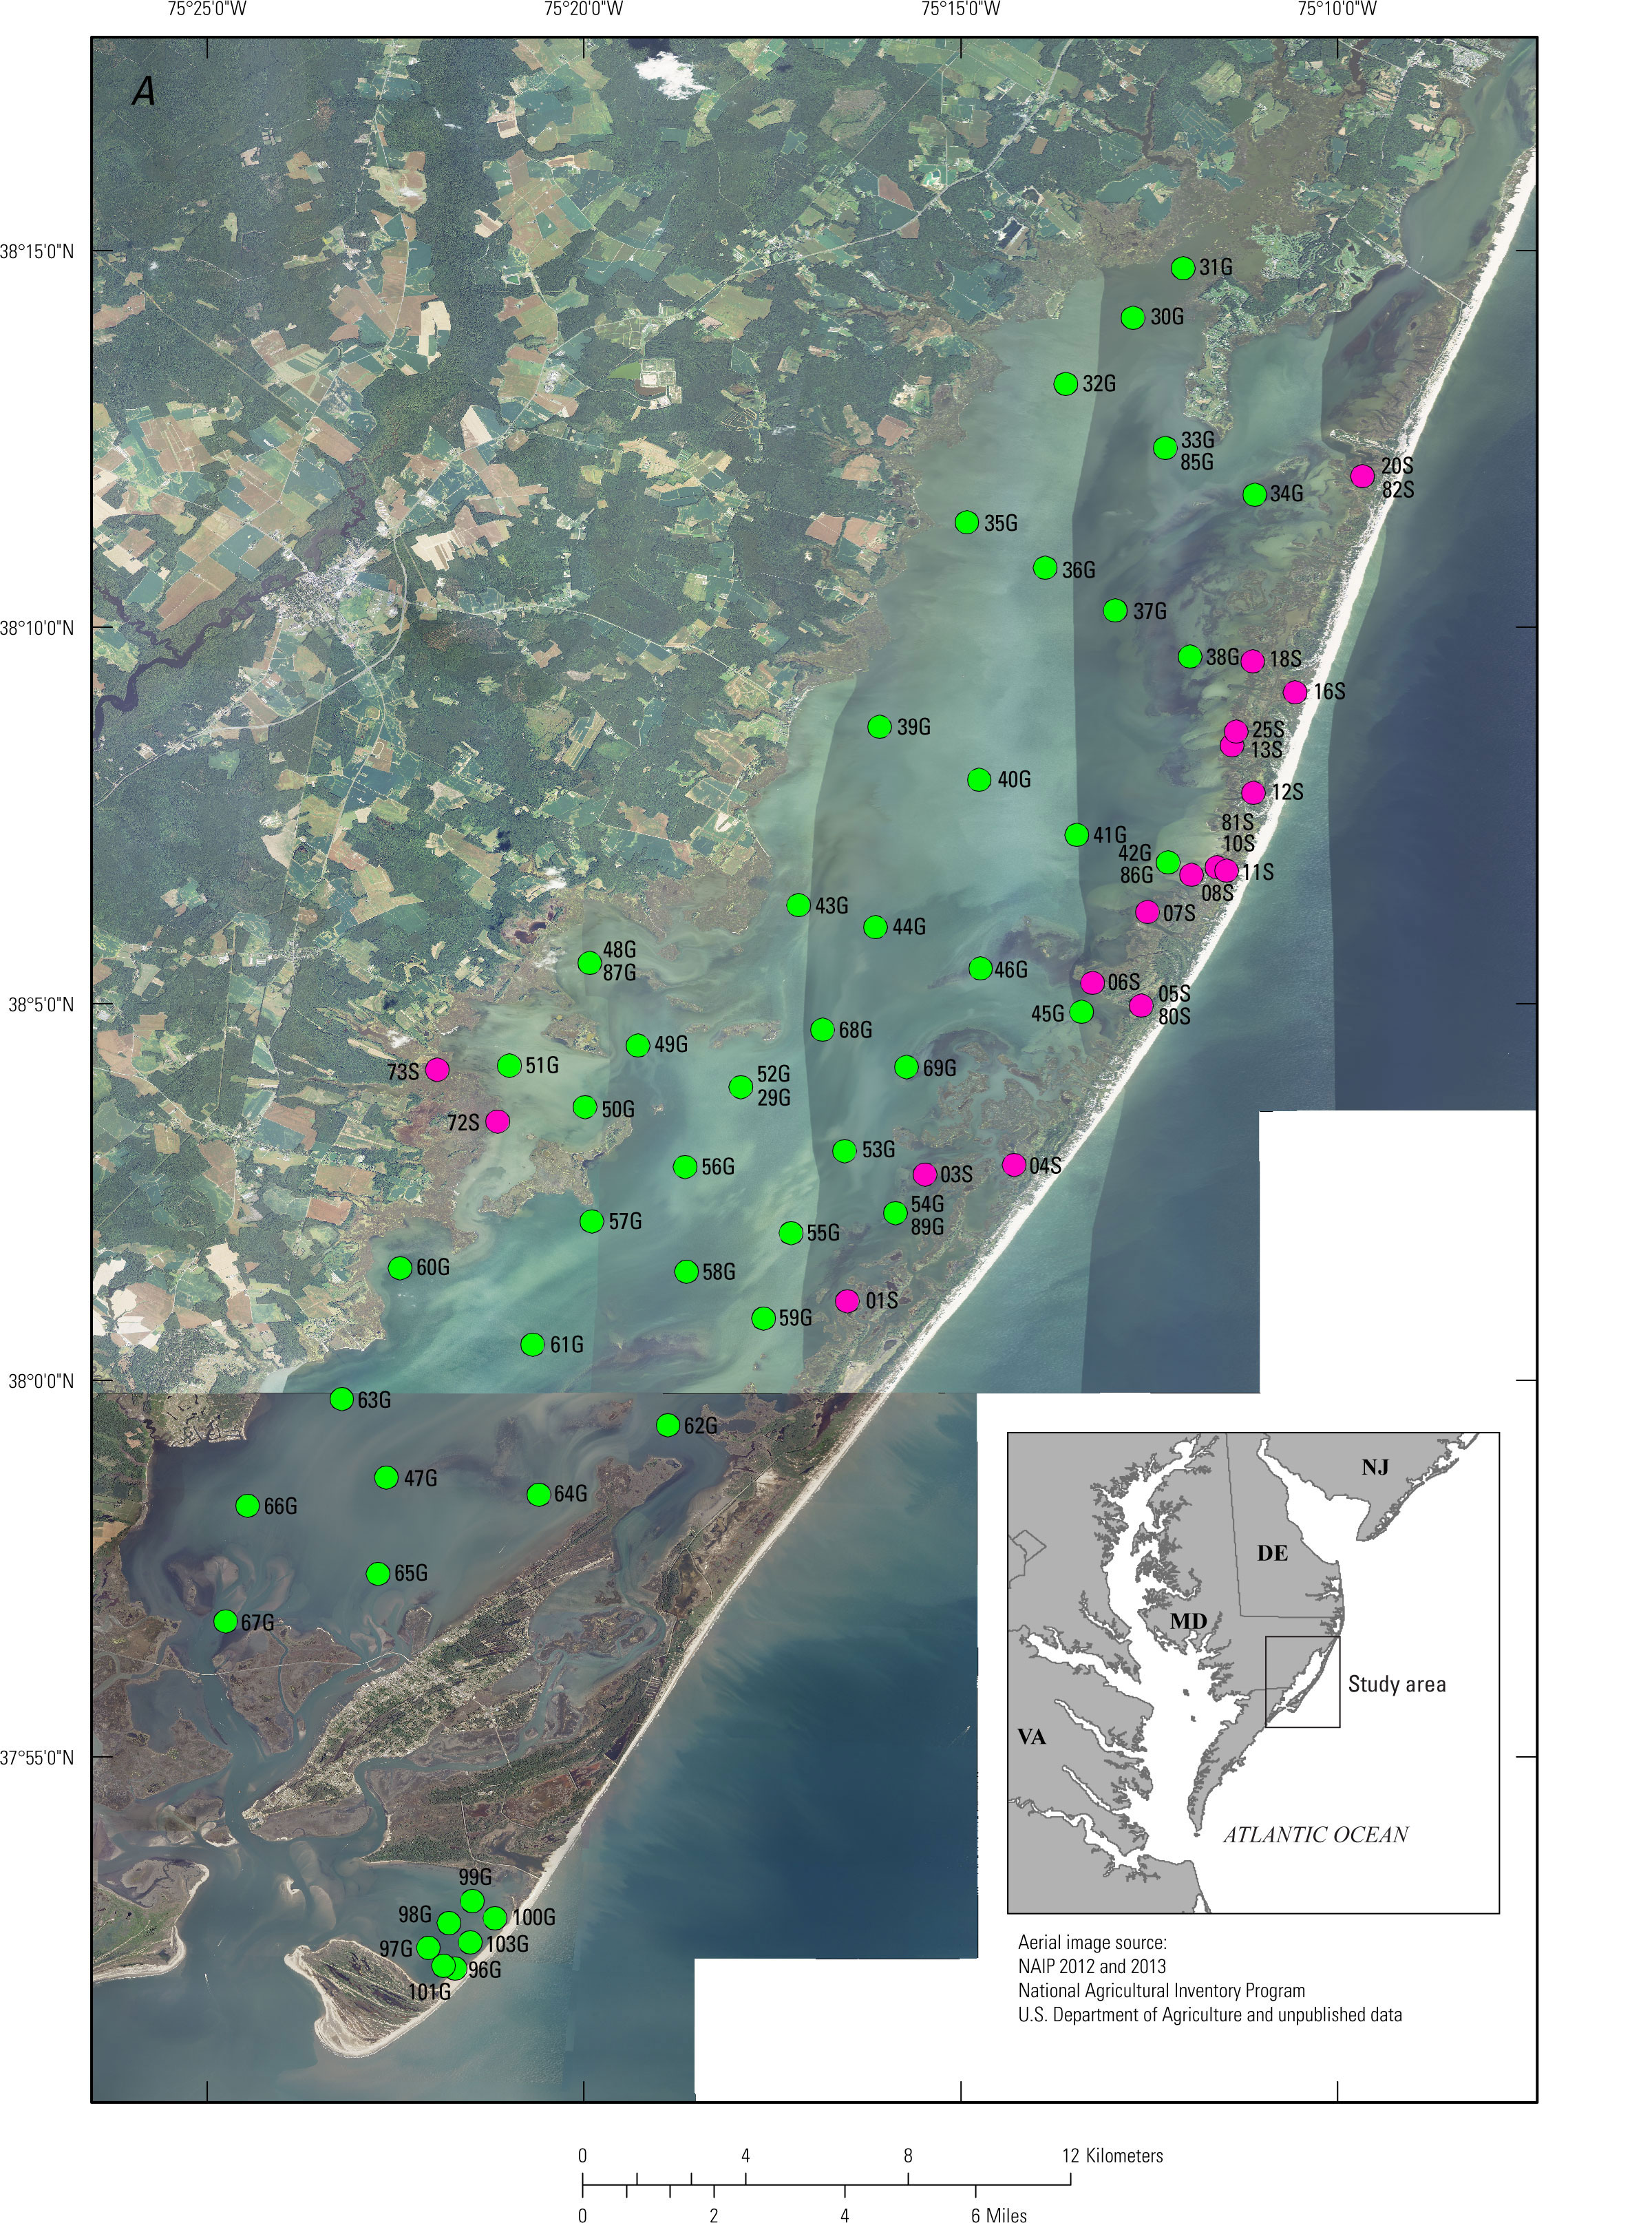
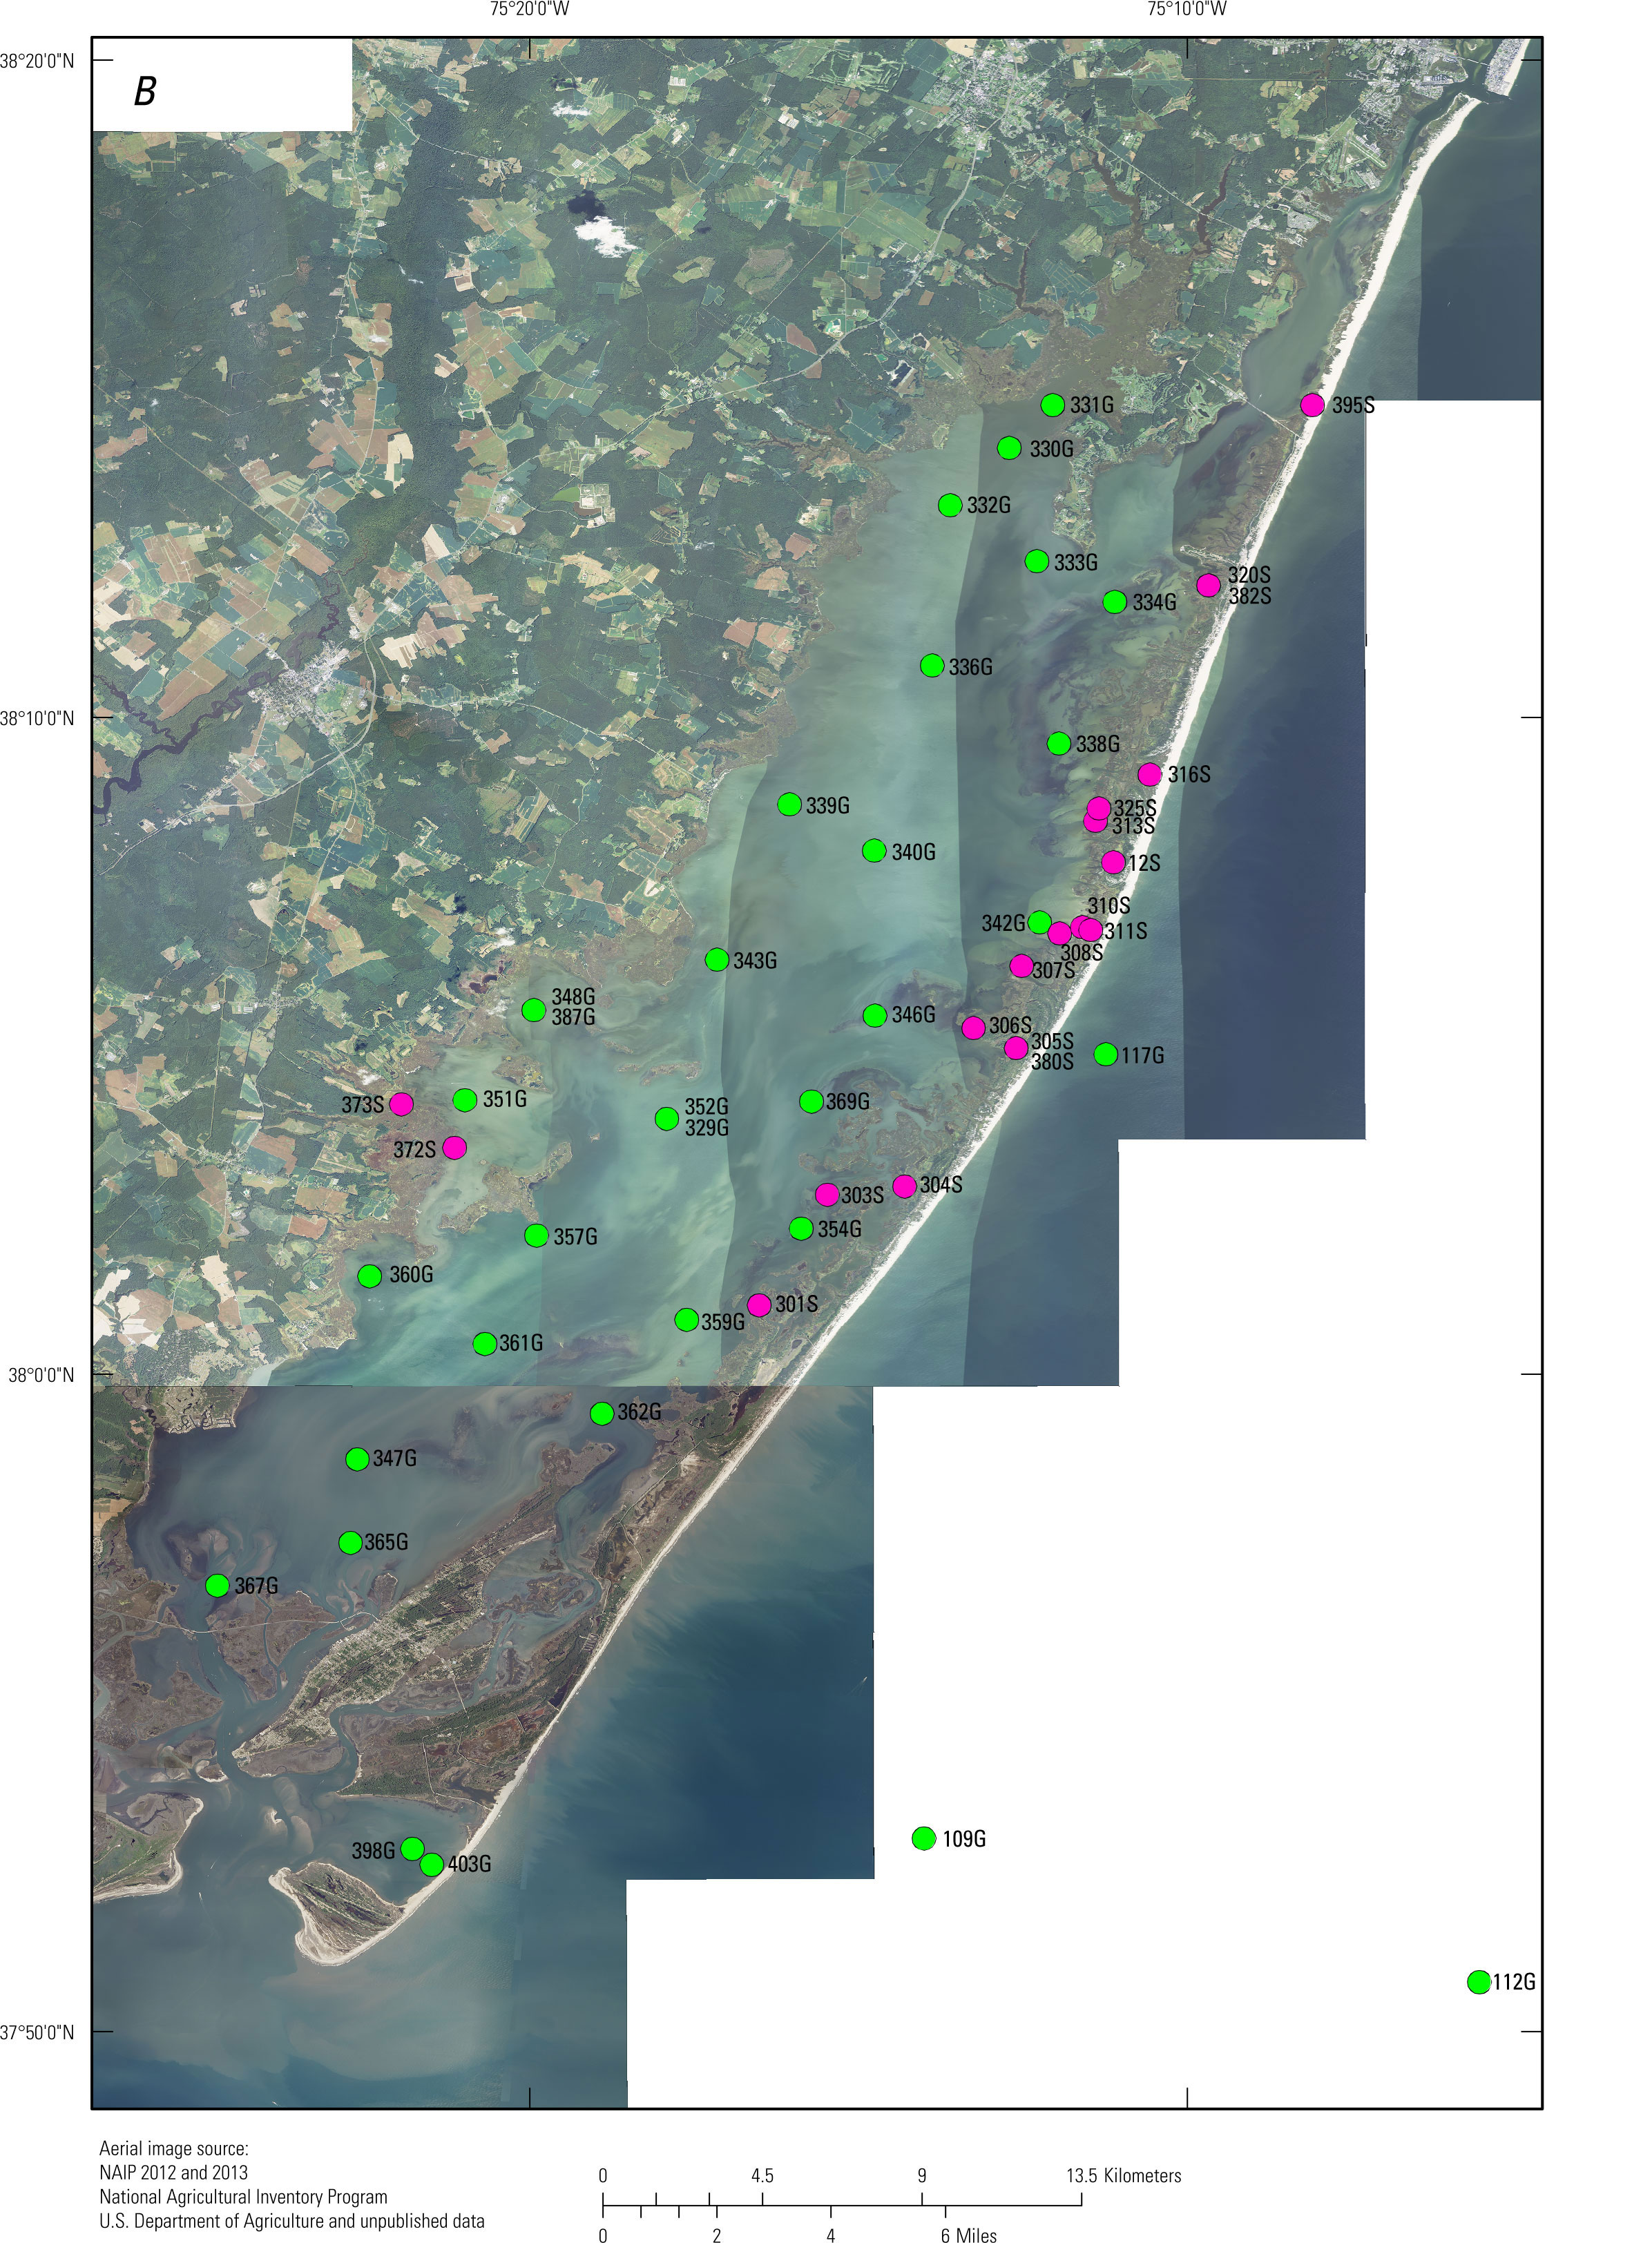
Estuarine grab samples (denoted with a “G”) were collected in the field using a petite Ponar in the spring (March 26–April 4) and fall (October 21–30) of 2014. During the same time periods, surface samples were collected on land from marsh and sandy overwash environments (denoted with an “S”). At each sample location, the top 1 centimeter (cm) of undisturbed surface material was subsampled for two (replicate) foraminiferal samples of approximately 25 milliliters (mL) using either a spatula or scoopula and placed inside two graduated centrifuge tubes (denoted “A” and “B”). All surface samples were preserved in the field using 90 percent ethanol mixed with Rose Bengal stain within hours of collection to distinguish between live (and recently live) and dead foraminifera (modified from Walton, 1952). Each centrifuge tube was shaken twice daily for at least 2 weeks before lab processing. At each site, coordinates were recorded on a Garmin GPSmap 76S, and sediment was collected for sediment characterization (20–30 mL) that included grain-size, bulk density, water content, LOI, δ13C and δ15N, and metals, and archive (10 mL) for future use. At all estuarine grab sites, water quality parameters were collected 1 meter (m) below the water surface with a YSI Professional Plus multiparamter meter. Parameters collected by the YSI include salinity, pH, temperature, dissolved oxygen (DO), specific conductance, and oxidation-reduction potential (ORP). Water depth was also recorded at each sample site by a Garmin depth sounder or direct measurement at the time of collection. No changes were made to compensate for varying tidal stages. Sediment samples from offshore of the Delmarva Peninsula, on the inner continental shelf, were collected using a Van Veen grab sampler. The top 1 cm of recovered, undisturbed sediment was scraped from the Van Veen sample for further analysis. Samples were stored chilled on ice from the time of collection (July 22–July 25, 2014) until their arrival at the SPCMSC on August 7, 2015. Upon arrival, the samples were preserved and stained using 90 percent ethanol mixed with Rose Bengal. The delay in the application of these products may result in a decrease in the accuracy of this method (Bernhard, 1988; Bernhard, 2000; Murray & Bowser, 2000). Lab MethodsLaboratory methods for grain-size analyses, bulk density, water content, LOI, stable isotopes, and metals can be found in separate publications (Ellis and others, 2015; Smith and others, 2015; Ellis and Smith, 2017). ForaminiferaFollowing a 2-week staining period, foraminiferal sample volumes were recorded from the centrifuge tube in which they were stored. Once recorded, samples were washed over a 63 and 850 micrometer (µm) sieve to remove ethanol, clay material, and to extract large organics (Schönfeld and others, 2012). In some cases, multiple washes were necessary to remove all clay aggregates. Once dry, some of the samples with a high sand content were processed using sodium polytungstate to concentrate foraminifera (Munsterman & Kerstholt, 1996). Before to picking, samples were dry-sieved over 125- and 250-µm sieves to create four splits; 63–125, 125–250, 250–850, and >850 μm and vialed separately. For picking, the 125–250 and 250–850 size fractions for each sample were split into equal parts using a microsplitter and spread evenly over a hole-punched, gridded picking tray. Entire splits were picked until approximately 200 foraminiferal specimens were acquired to enable the calculation of foraminiferal densities. At least one sample was picked from each spring site, whereas only a select few samples collected in the fall and from the offshore sites were picked for contrast, while attempting to choose sites that varied geographically. Foraminiferal identifications were made by making comparisons with published literature (Buzas and others, 1985; Culver and others, 1996; Edwards and others, 2004; Horton and Edwards, 2006; Vance and others, 2006; Kemp and others, 2009, 2012; Edwards and Wright, 2015). The foraminiferal data presented in this publication include raw and volumetrically normalized (25 mL) specimen counts. |
||||||||||||||

![]() U.S. Department of the Interior |
U.S. Geological Survey
U.S. Department of the Interior |
U.S. Geological Survey
URL: http://pubsdata.usgs.gov/pubs/ds/1060/ds1060_methods.html
Page Contact Information: GS Pubs Web Contact
Page Last Modified: Tuesday, 31-Oct-2017 11:33:21 EDT