 |
|
|
||||
| National Minerals Information Center |
One of the responsibilities of the U.S. Geological Survey (USGS) is to collect, analyze, and disseminate minerals information on nonfuel mineral commodities. This data series reflects an ongoing activity by the USGS to monitor and analyze international mineral exploration activities. Understanding mineral exploration activities helps government policy makers, the minerals industry, and the USGS to understand where future mineral resources are being developed or are likely to be developed. These data also provide background information for quantifying possible world mineral supply and integrating economic, societal, and technological mineral exploration trends with other components of materials flow.
The USGS mineral exploration data compilation and dissemination effort originated in 1976 at the request of the U.S. Senate Appropriations Committee to provide articles on the effects of government policies in Canada and the United States on mineral exploration. A grant from the U.S. Bureau of Mines and the USGS provided support for early compilation efforts. Early publication efforts included contributions to Economic Geology (in 1984 and 1992) and Mining Engineering (beginning in 1984). Comprehensive site data by country or mineral commodity were not published by the USGS until 1996. Summaries of 1995 through 2004 mineral exploration site data have been reported annually in the May issue of Mining Engineering.
This report contains exploration data listed by region and country; data are provided in Microsoft Excel and Adobe portable document format (pdf) files Much of the data were compiled from public sources, including but not limited to company press releases and reports, foreign and U.S. Government publications, and industry reports and trade journals. Data were supplemented with information supplied by USGS scientists, contacts in the minerals industry, and other sources. This report includes data on commodities being sought, companies involved, cost of activity, development stage, location of activity, resource quantity and associated commodity grades, site names, sources of information, and types of exploration activity.
Based on these data, a table of the 100 most noteworthy sites was developed for inclusion in each annual Mining Engineering review. Selection criteria were based on the following parameters:
Regional site counts reported in the annual summaries were derived from these data. The change in the number of sites among regions or among countries within a region served as one indicator of the relative intensity of minerals exploration among and within countries or regions over time. Although the number of sites serves as an indicator of the intensity of exploration activity, this does not imply that significant ore will be located or that there will be production in the future.
Site information is reported as published by the source cited. Blank fields indicate that data for that field were not available. Quantified information reported in the “Notes” column are reported in units specified in the source of information but have been converted to metric units in the “Reported resource” and “Activity type” columns. Reported budgets or expenditures are expressed in currencies as reported by the source of information. Costs are assumed to reflect the year of reported activity unless otherwise noted. No attempt was made to validate reported information.
For purposes of brevity, abbreviations have been used in field text. The definitions of all abbreviations and descriptions of category labels are appended to each year’s file.
Based on mineral exploration activity data from 1995 through 2004, an analysis of significant exploration trends has been conducted. Discussions of selected mineral commodity targets, regional exploration activity, and current and future implications toward materials flow are presented.
Exploration site data can be a useful tool in the evaluation of general mineral exploration trends, but to make data more useful, they should be used in conjunction with other factors, such as the amount of money invested or the number of tons identified per unit spent. The annual exploration summaries (Located in the data folder for each year of this study) incorporate both exploration budget and site data. Because the number of exploration sites reported annually is influenced by external forces (industry conditions) and internal factors (sources of data), care should be taken when extrapolating trends from the data. Likewise, year-to-year changes must be viewed with caution, as they are influenced by many factors, discussion of which is beyond the scope of this compilation study.
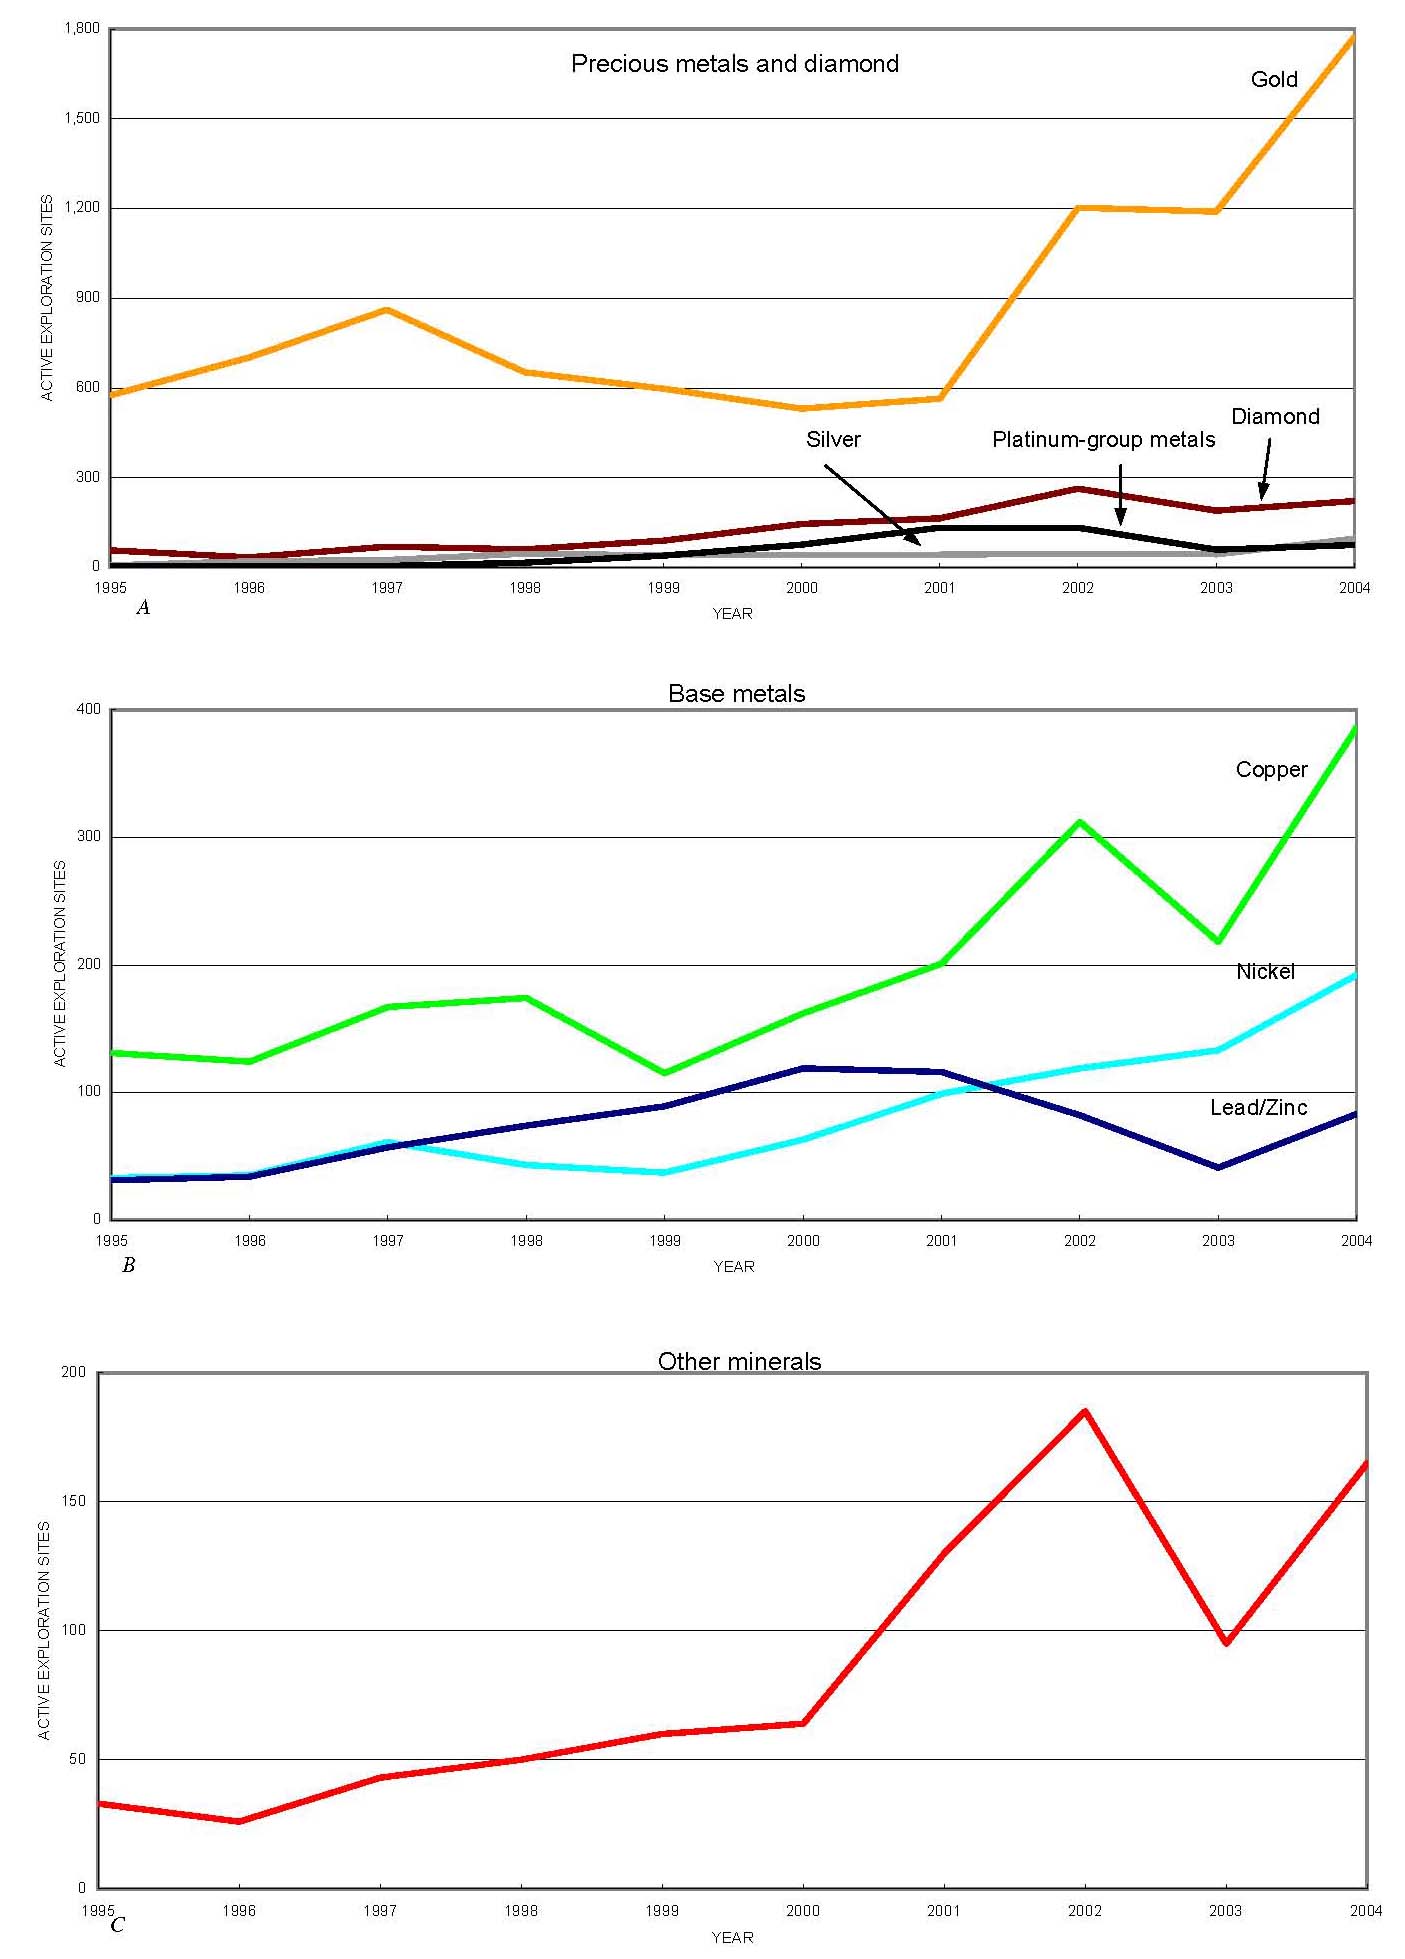
Figure 1 shows the principal mineral commodity targets for worldwide exploration based on the number of reported active sites for the period 1995 through 2004. Gold is by far the most explored mineral commodity target among those analyzed and the principal target for about 580 sites in 1995 and 1,800 sites in 2004. Gold’s popularity can be attributed to its demand in aesthetic and technological applications, its profitability (in terms of revenue minus costs), its widespread geological occurrence in relatively small deposits, some of which can deliver a high rate of economic return on investment, and its high price per unit weight. Copper is the second most explored mineral target, a function of both of its perceived mineral value and its common association with gold in some geologic environments. Diamond is the third most explored mineral target during the study period, followed by nickel. Diamond accounted for about 60 sites in 1995 and about 220 sites in 2004. There was also an increase in the number of exploration sites targeted for nickel during the 10-year period. There were about 30 sites in 1995, but by 2004, nickel was the principal target at about 190 sites. Platinum-group metal (PGM) targets increased in number between 1998 and 2002, primarily a result of the uncertainty of Russian supply and high prices during this period.
|
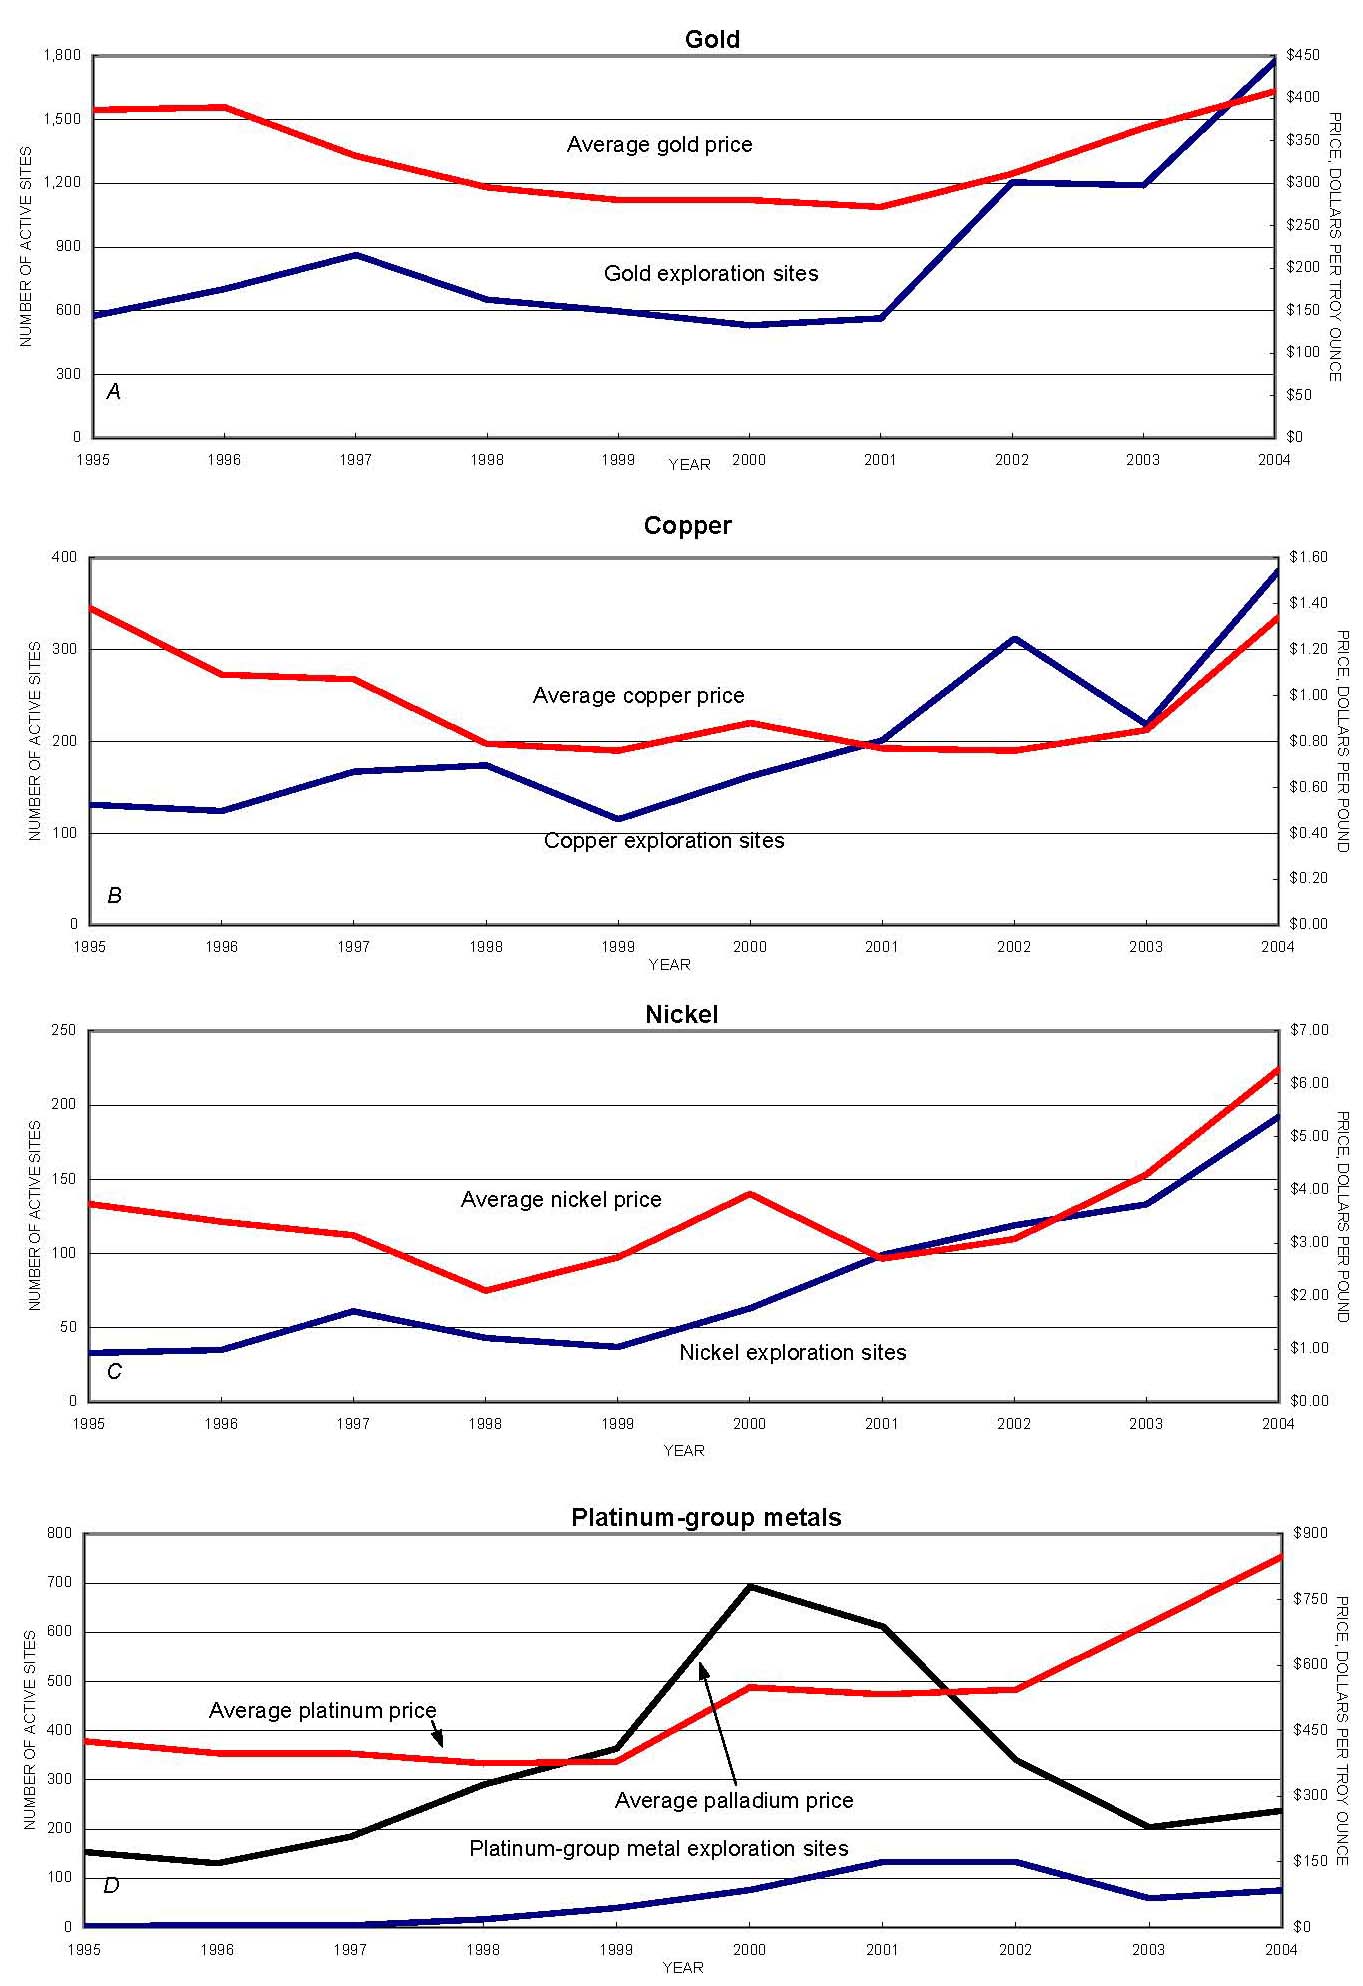
Figure 2 shows commodity price and exploration activity (in terms of number of active sites) for gold, copper, nickel, and PGMs for the 10-year period covered in this analysis. Although mineral price is only one factor influencing the intensity of exploration activity for a particular mineral commodity, it often significantly influences the level of exploration activity for that particular commodity. In general, the level of exploration activity tends to lag commodity prices by about a year so that, when commodity prices increase, exploration in the following year tends to increase.
|
As shown in figure 2A, gold price was relatively high during 1995 and 1996 and 2002 through 2004. In general, gold exploration in terms of number of sites increased during these periods to 860 sites in 1995-6 from about 580 in 1995 and to nearly 1,800 sites in 2004 from about 560 sites in 2001. For 1998 through 2001, the gold price remained relatively low (less than $300 per troy ounce) and the number of active gold exploration sites dropped to a relatively low level at about 600 sites per year from 1998 through 2001.
Figure 2B shows copper price and exploration activity curves for the period from 1995 through 2004. Even though the price of copper dropped to $0.79 per pound in 1998 from $1.38 per pound in 1995, the number of copper exploration sites remained relatively stable during the period. Copper and gold are often found in close association in many mineral deposit types (for example, porphyry copper-gold). In the search for deposit types containing more than one mineral, mineral prices can greatly influence site economics and target selection. In the case of porphyry copper-gold deposits, for example, gold was generally the primary target mineral between 1998 and 2003 (when copper price was low). With the increase in the copper price after 2003, however, copper became the primary mineral target at some deposits.
Figure 2C shows nickel price and exploration activity for 1995 through 2004. The nickel price decreased from 1995 to 1998, then rebounded between 1998 to 2000. The price increased to $6.27 per pound in 2004 from $2.70 per pound in 2001, primarily owing to increased nickel demand from China. Exploration for nickel followed a similar pattern. Exploration activity as reflected in the number of sites generally remained stable between 1995 and 2000, then activity doubled as the nickel price increased during the period from 2001 through 2004.
Figure 2D shows platinum and palladium prices and PGM exploration activity during 1995 through 2004. Exploration activity for primary PGMs remained relatively low while prices remained low. In 2000, the average prices of ruthenium, rhodium, palladium, and platinum increased by 219 percent, 120 percent, 90 percent, and 45 percent, respectively, as a result of increased demand in the automotive sector (platinum, rhodium), unstable Russian supply (palladium), and increased use in the aerospace and electronics sectors (ruthenium). Higher PGM prices were followed by an increase in the pace of exploration for PGM. Decreasing prices in 2001 and 2002 did little to dampen exploration because of expected increases in demand for PGMs in automotive, jewelry, and other industrial applications. By 2003, however, new PGM supply in South Africa was beginning to come online, and enthusiasm for PGM exploration appears to have decreased, even though the price of platinum has remained at a very high level. Increased platinum supply from South Africa since 2002 appears to have reduced the incentive for platinum exploration, while lower palladium prices since 2001 have tempered the search for new sources of palladium.
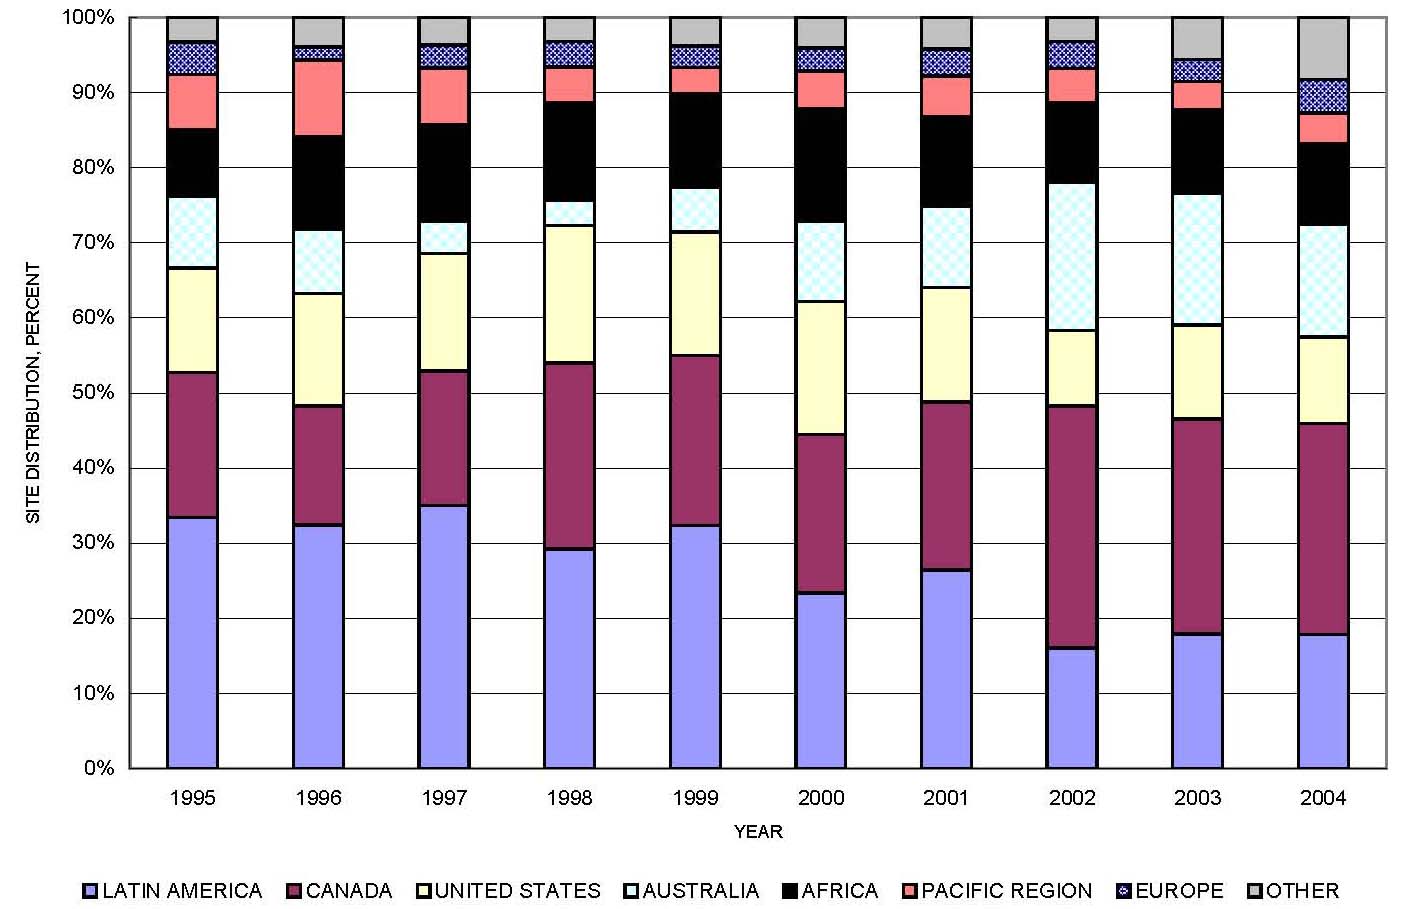
Figures 3 through 9 show where exploration for gold, copper, nickel, diamond, lead-zinc, silver, and PGMs took place for each year of the 10-year study period, based on the percentage of total activity as determined by the number of sites for which data were collected. Although annual site totals are affected by variation in data collection methods and sources, the percentage distribution is less affected by such changes and better reflects overall data trends. The figures illustrate overall changes in regional activity by commodity.
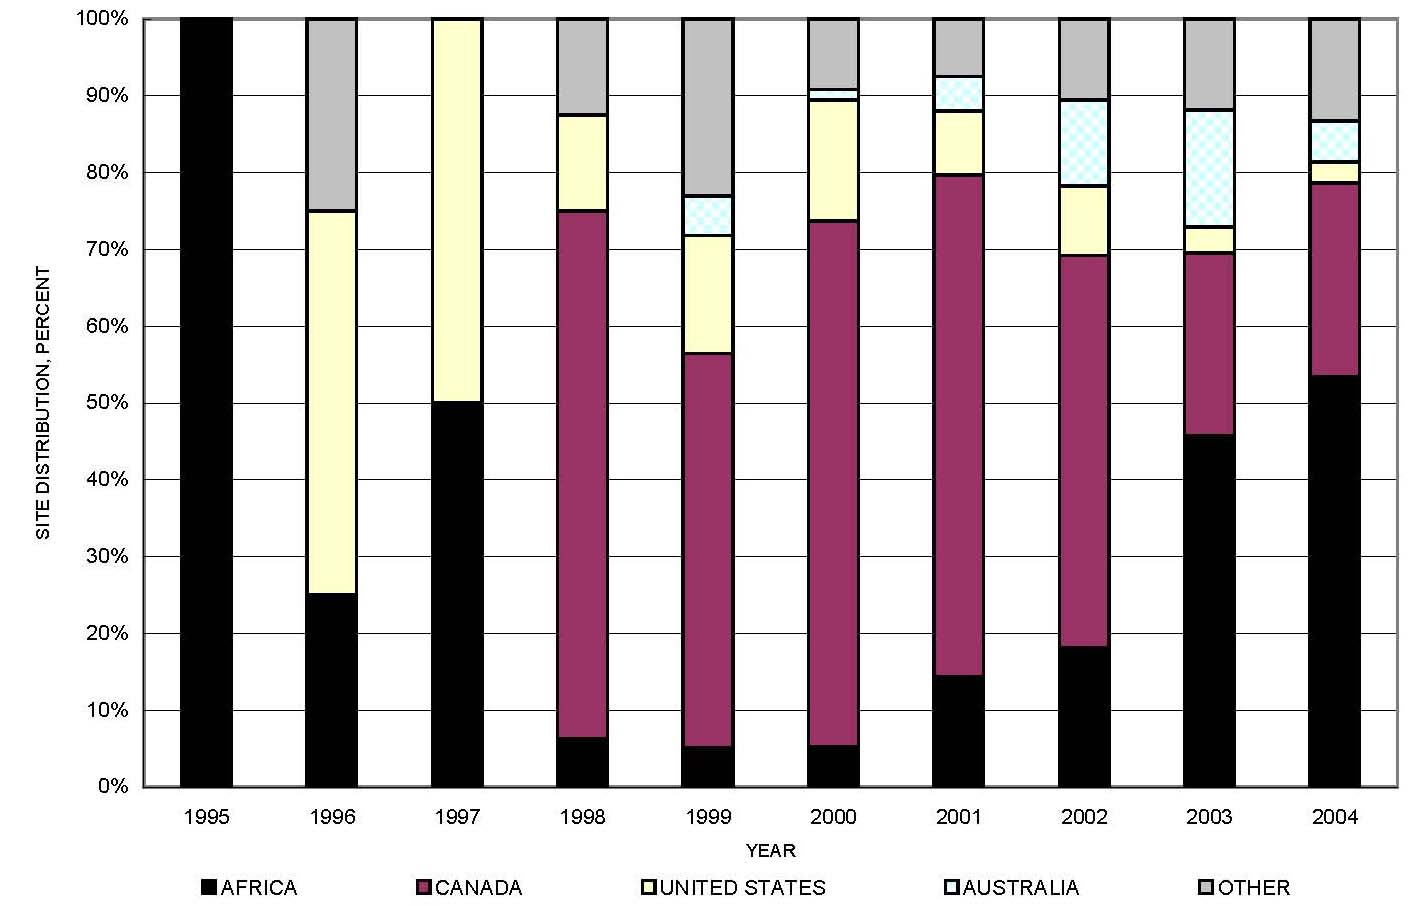
Figure 3 shows gold exploration activity for this period. This figure shows that the top three regions for gold exploration for 1995 through 2004 were Latin America, Canada, and the United States. While Latin America maintained its lead as the top region for gold exploration in terms of number of sites, the percentage share attributed to Latin America declined during the period. While more than 30 percent of the world’s gold exploration sites included in this study were found in Latin America during the 1995-99 period, this percentage fell to about 25 percent in 2000 and 2001, and less than 20 percent for 2002 through 2004. Possible reasons for the apparent percentage decline in Latin American exploration activity include affects of regulatory and tax legislation and a greater focus on the development of later stage projects. On the other hand, interest in Canadian gold exploration grew during the period, driven by new discoveries and regional incentives. Between 1995 and 1997, Canadian exploration accounted for about 18 percent of the total number of active exploration sites; from 1998 through 2001, Canadian exploration accounted for about 23 percent of the sites, and from 2002 through 2004, it accounted for 30 percent of the sites. Unlike Latin America, many of the gold prospects are early-stage sites receiving a lower level of exploration intensity. Exploration activity for the United States based on the number of exploration sites remained relatively stable, accounting for between 10 to 18 percent of the total number of exploration sites for gold.
|
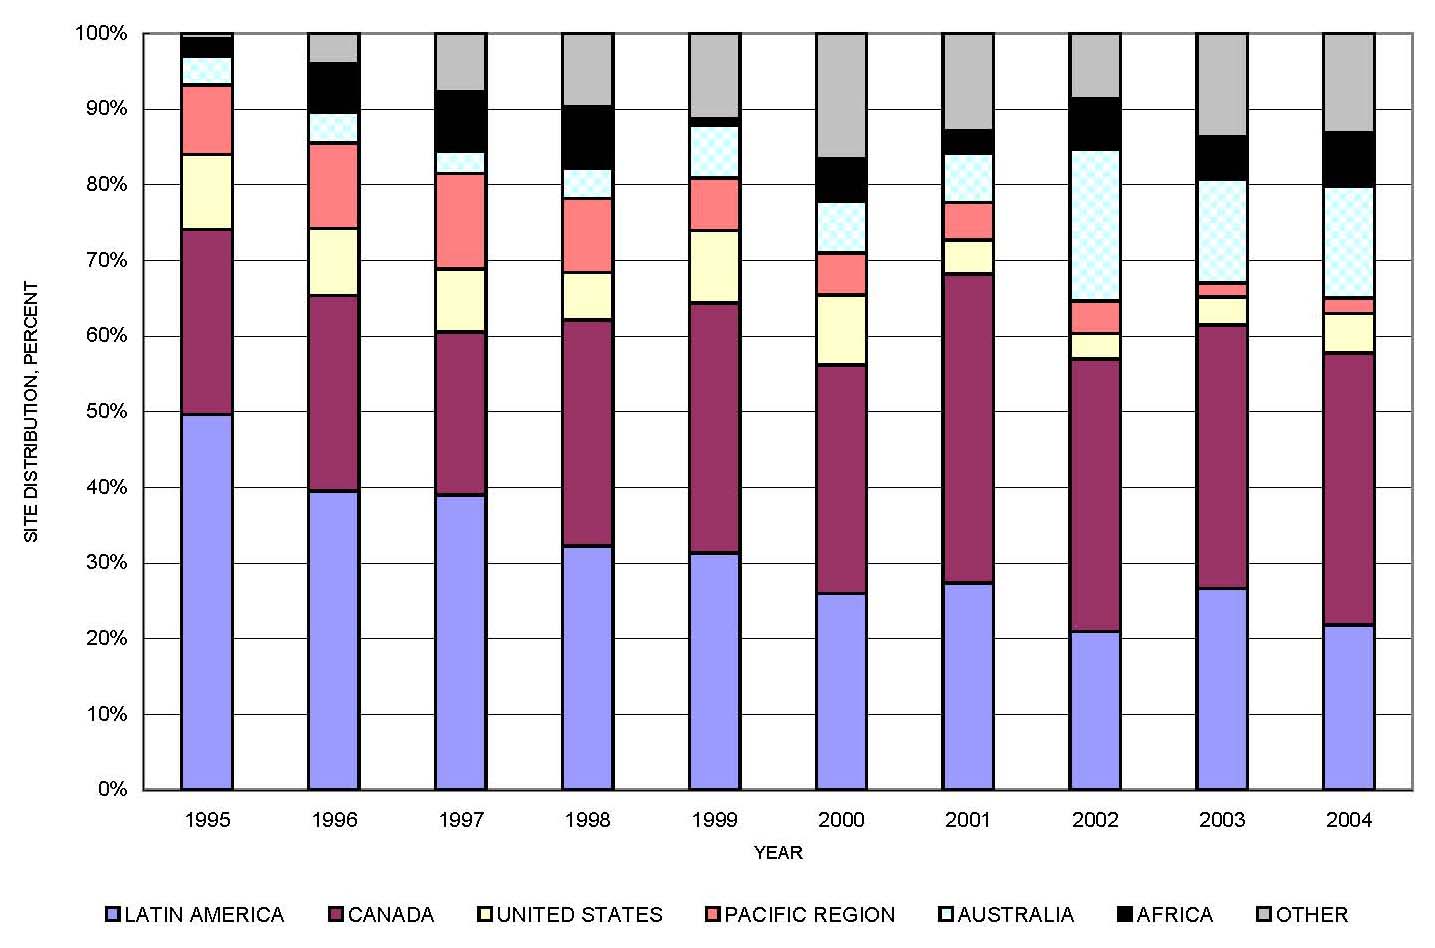
Figure 4 shows copper exploration activity by region for 1995 through 2004. As with gold, Latin America, Canada, and the United States maintained the greatest exploration activity in terms of number of active sites for the period. Copper exploration activity in Latin America decreased to about 22 percent in 2004 from about 50 percent of the total sites in 1995, for the reasons previously stated in the discussion of gold exploration activity. Canada, which accounted for about 22 percent of total sites in 1995, accounted for about 36 percent of the copper targets in 2004. As with gold, most of these sites were in the early stages of exploration. In terms of the number of sites, exploration activity increased during the period in Australia, Canada, China, Mongolia, and Turkey, while copper exploration activity decreased in Latin America, the Pacific region, and the United States. Copper exploration activity in Africa varied from country to country, primarily because of regional unrest and growing uncertainty of ownership rights in some countries.
|
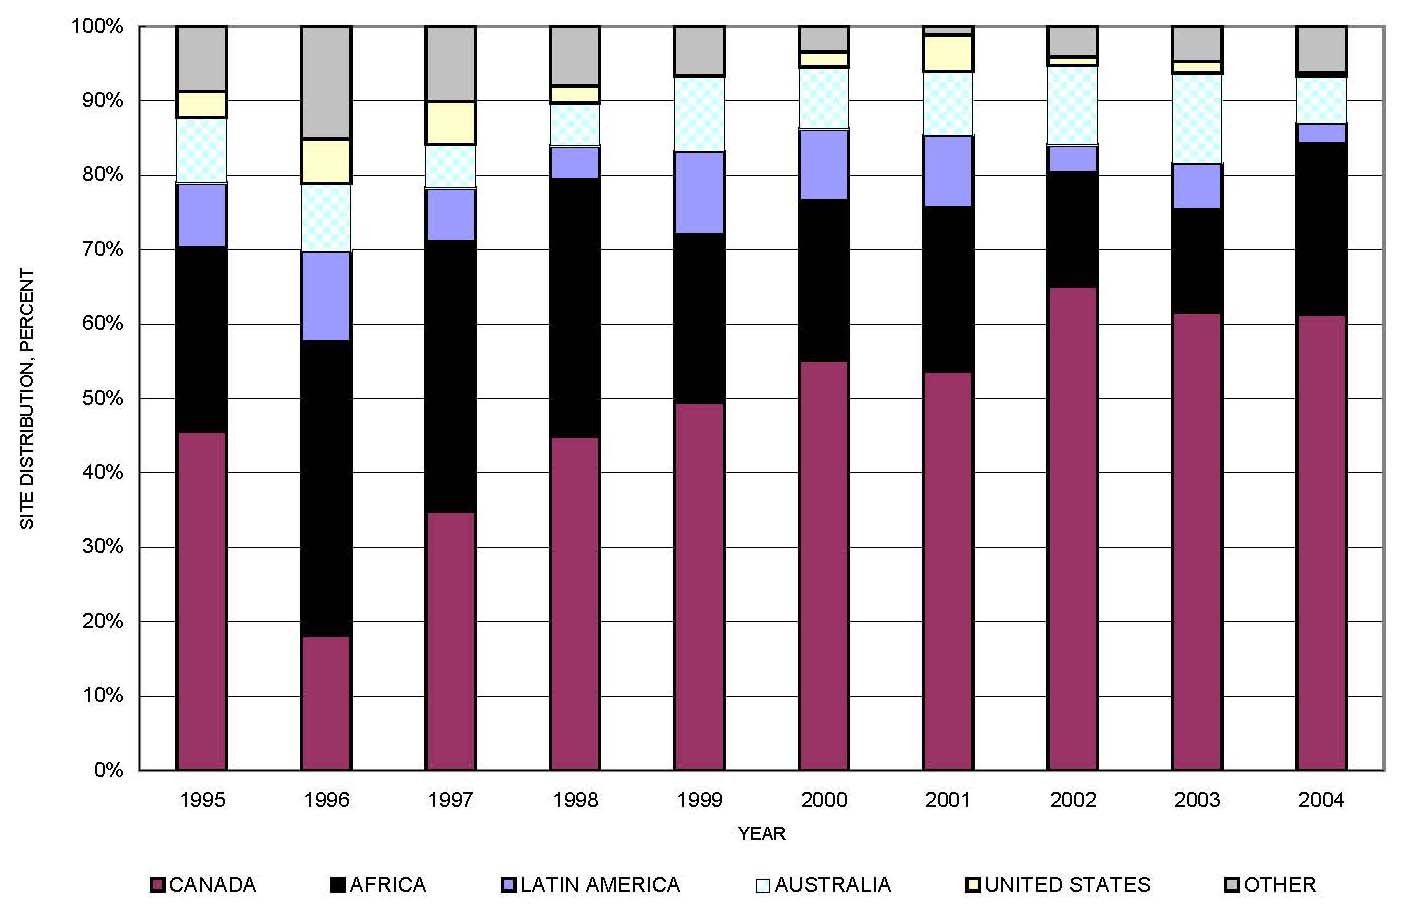
Figure 5 shows diamond exploration activity for 1995 through 2004. Canada appeared to be the area receiving the greatest exploration activity, growing to 63 percent of the total sites for 2002 through 2004 from an average of 33 percent for 1995 through 1997. Interest was stimulated by major discoveries and the ongoing exploration, development, and initial production from several promising districts in the Ontario, Quebec, Northwest Territories, and Nunavut. In terms of regional percent share, diamond exploration activity in Africa and Australia was about the same in 2004 as it was in 1995, and diamond exploration activity in Latin America and the United States was lower in 2004 than it was in 1995 as interest shifted to these other areas.
|
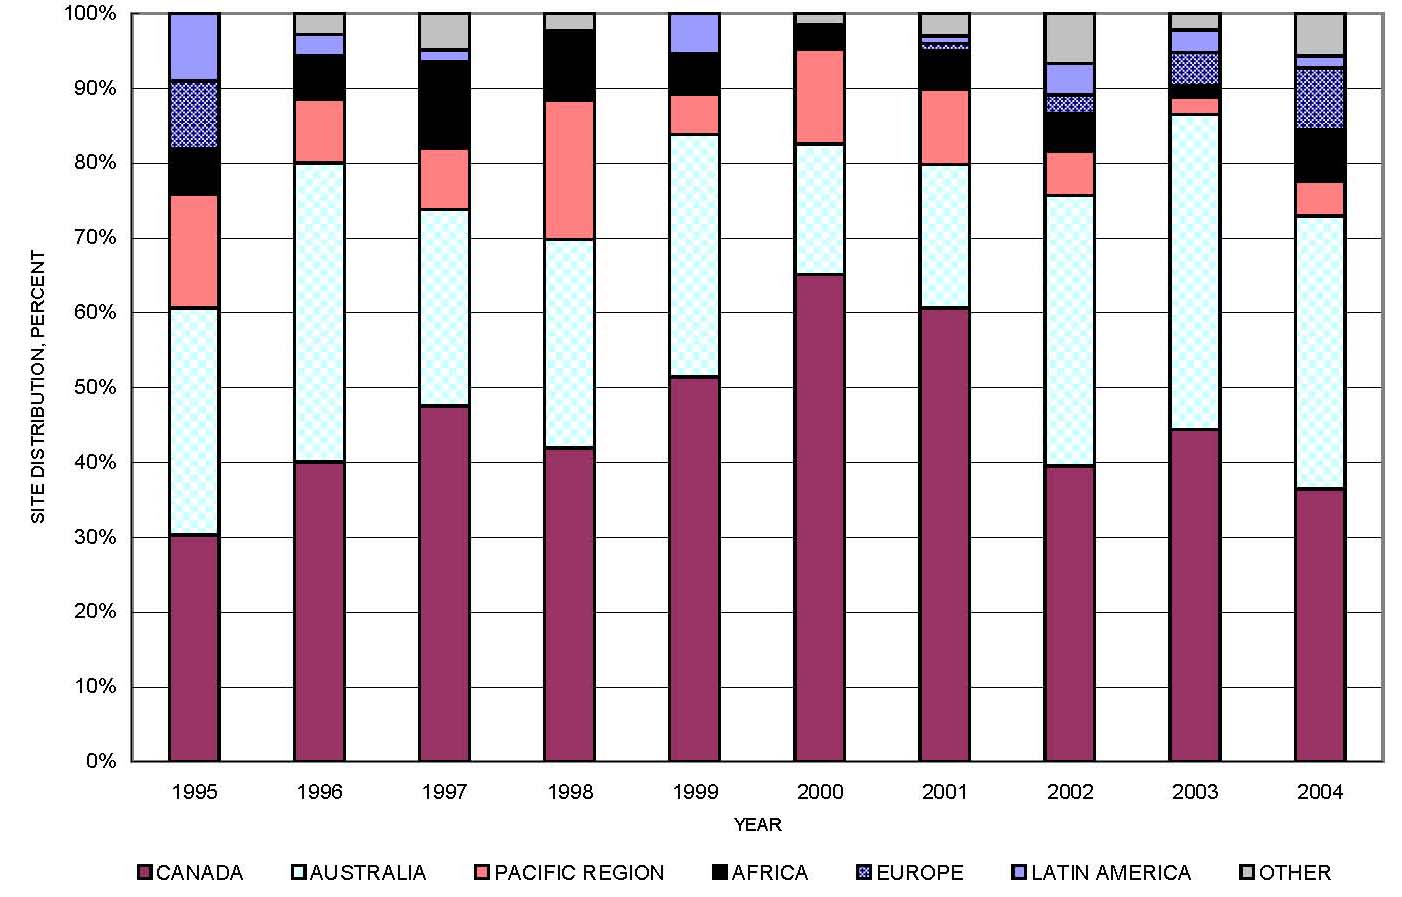
Figure 6 shows nickel exploration activity for the 1995-2004 period. Canada was the principal region for nickel exploration during the study period. Canada’s share of nickel exploration increased to about 65 percent of the total world nickel sites in 2000 from about 30 percent in 1995, primarily responding to the discovery and subsequent ongoing development of Inco Limited’s Voisey’s Bay project in Newfoundland, permissive geology for new discoveries, and the increase in nickel price in 2000. Exploration activity for nickel peaked in 2000, and subsequent interest in Canadian nickel exploration has lessened, although Canada continued to receive 37 percent of the total exploration activity in terms of active sites in 2004. There was a re-emergence of interest in nickel exploration in Europe in 2001 after a period of little interest.
|
Figure 7 shows exploration activity for lead and zinc from 1995 through 2004. In general, the level of exploration activity for base metals during this period has remained relatively constant, with Canada, Latin America, and Australia being the three principal regions of focus. The search for lead and zinc in the United States has decreased somewhat since 1995, primarily a result of greater concern for the environment and lower commodity prices.
|
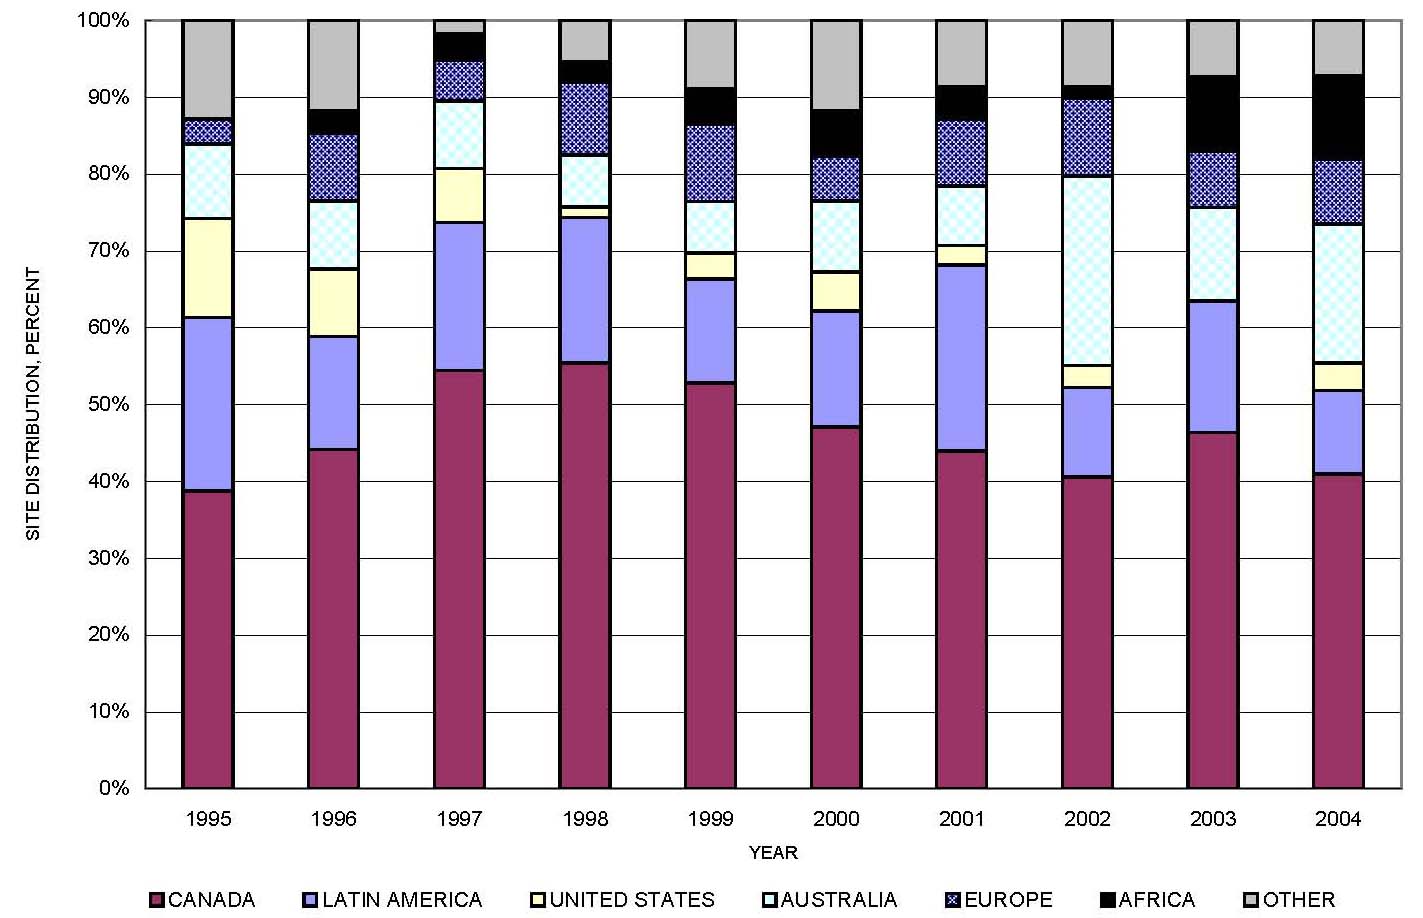
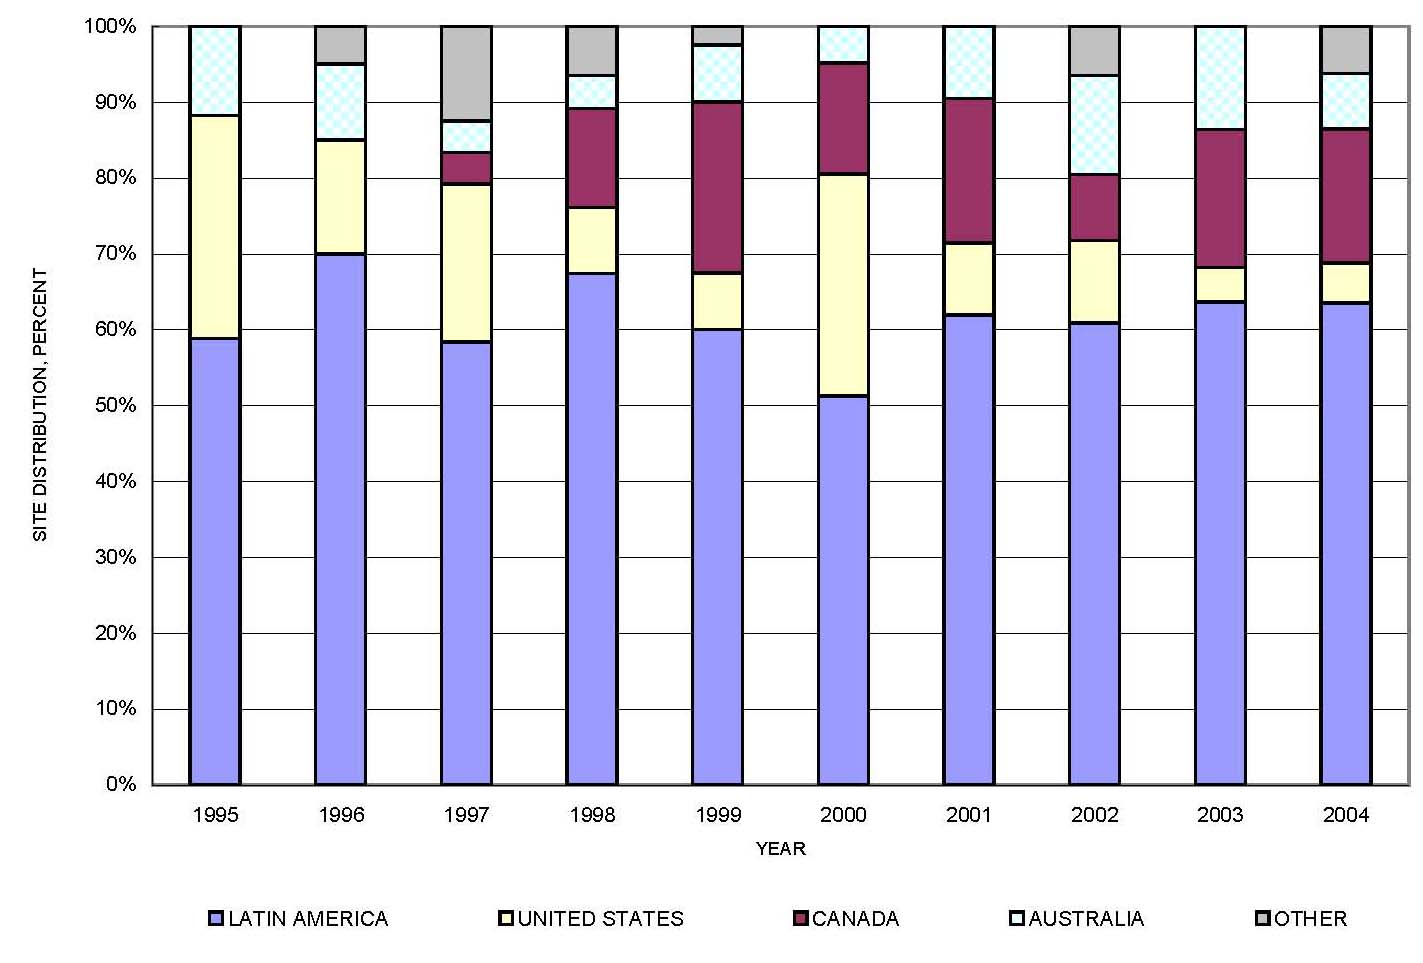
Figure 8 shows exploration activity for silver by region from 1995 through 2004. Based on the percentage share of exploration sites included in this study, Latin America exploration accounted for more than 50 percent of all silver exploration activity. The United States, which accounted for 30 percent of silver sites in 1995, accounted for 4 percent of the sites in 2003, primarily owing to the lower silver price and the low grades reported for new discoveries. In 2004, Canada and Latin America together accounted for more than 80 percent of silver exploration.
|
PGM exploration activity by region, shown in figure 9, changed dramatically during the study period. Until 1998, little exploration for primary PGM deposits took place, although there was some activity in South Africa, the United States (primarily in Minnesota and Montana), and Zimbabwe. As Russian palladium supply concerns arose and the price of palladium increased, interest in exploration also increased, with a focus on Canada and the United States, which are areas with identified palladium resource potential. In 2001, more than 130 sites were actively being explored for PGM worldwide. The high price of palladium between 1998 and 2002 led to increased exploration in Canada and Russia, areas with palladium-rich PGM potential. The 2003 palladium price was one-third what it was in 2001 (fig. 2D); consequently, exploration activity for palladium in these regions decreased after 2001. The price for platinum continued to remain high, however, so PGM exploration activity shifted to focus on areas in Australia, Finland, Russia, South Africa, and Zimbabwe with identified platinum resource potential.
|
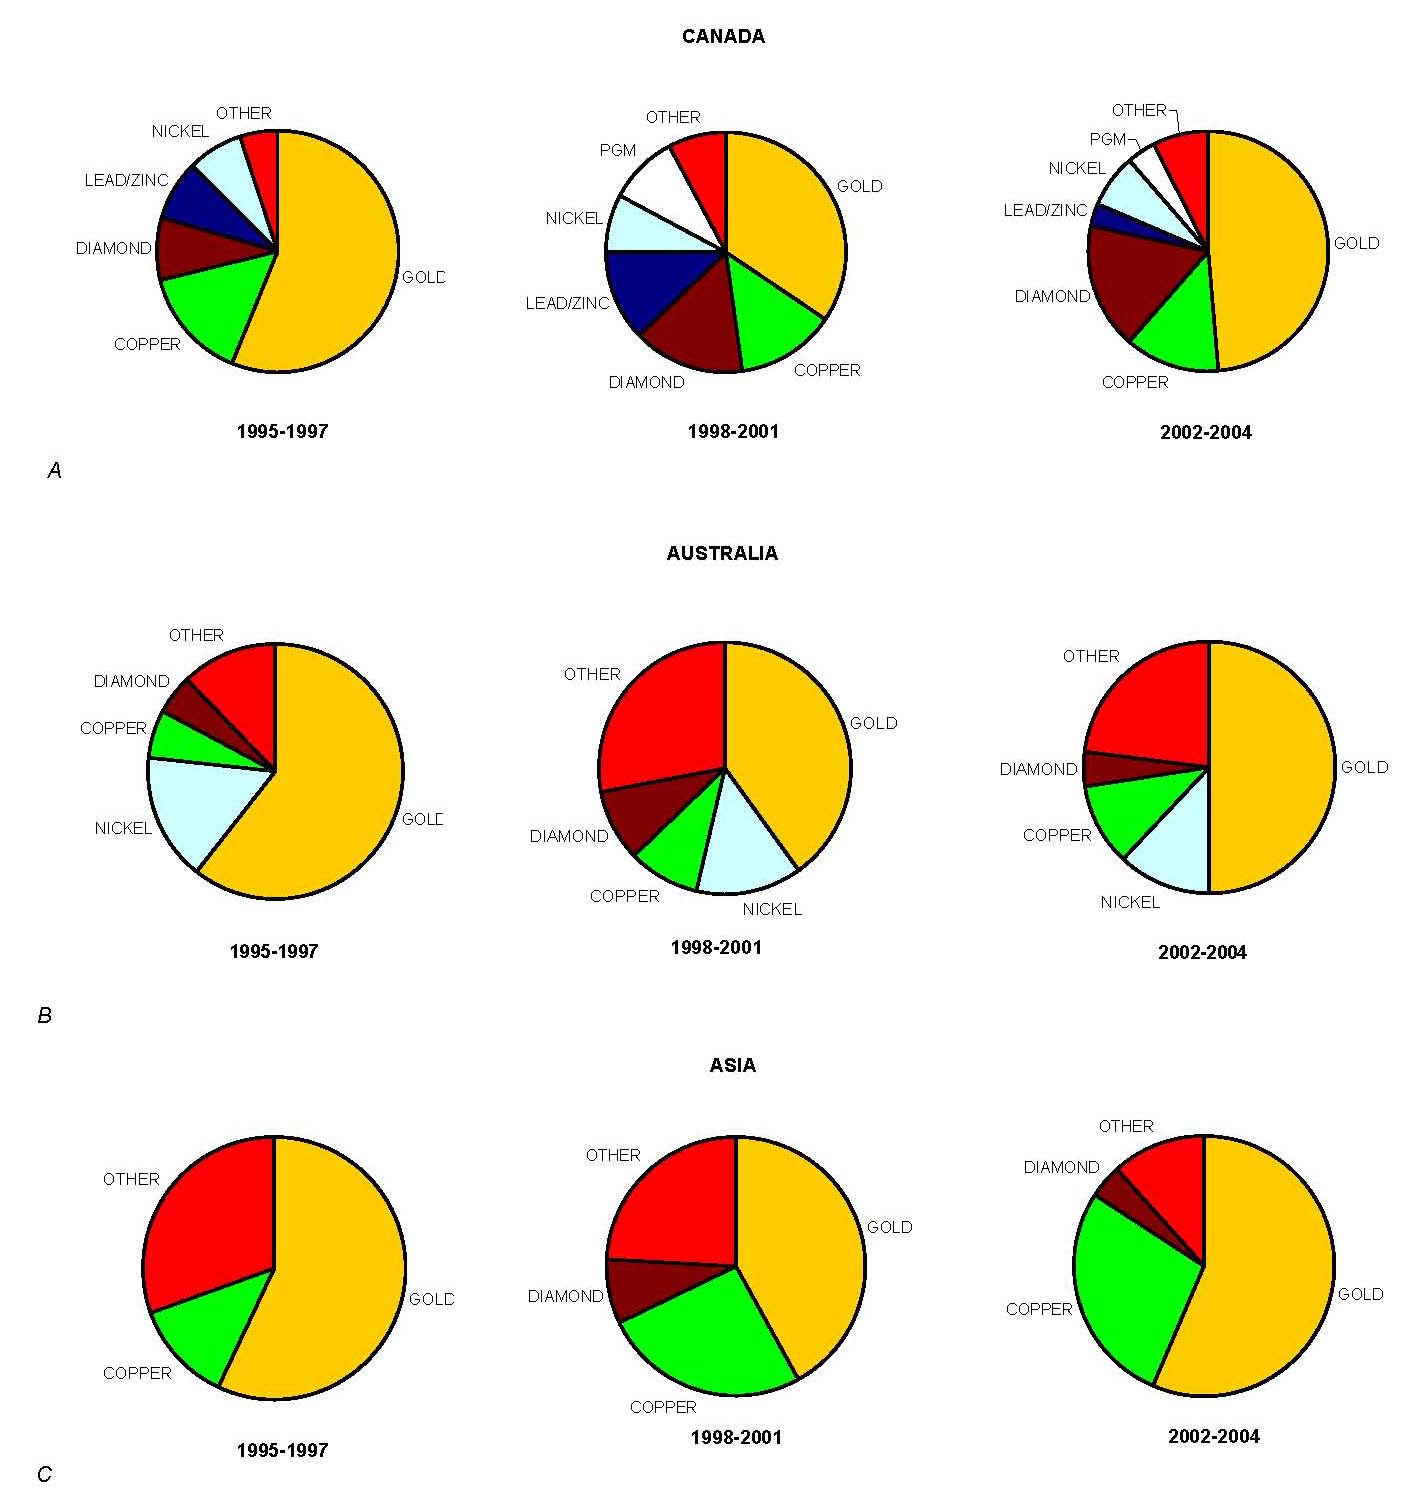
Figures 10 through 12 show mineral exploration by region, expressed in terms of the number of mineral commodity targets averaged for the time periods 1995-97, 1998-2001, and 2002-04. These time periods were selected based on review of the data and observed trends as well as price trends for selected mineral commodity targets. Figure 10 reflects the regions where exploration activity generally appears to have increased for the study period. Figure 11 reflects regions where exploration activity remained relatively constant for the study period. Figure 12 reflects regions where exploration activity generally appears to have decreased for the study period.
|
Based on exploration data collected for this study, Canada (fig. 10A) showed the greatest change in focus of exploration activity. Site data suggest that gold was the most sought after mineral commodity in Canada during the 1995-2004 study period, although its relative percentage of active exploration sites varies widely during the study period. Gold exploration accounted for an average of 56 percent of all Canadian sites from 1995 through 1997, 34 percent from 1998 through 2001, and 49 percent from 2002 through 2004. For the study period, exploration held constant at 13 to 15 percent of the total number of Canadian sites for copper and 7 to 8 percent for nickel. Diamond exploration, which accounted for an average of 8 percent of Canadian exploration sites from 1995 through 1997, grew to account for an average of 17 percent of Canadian exploration sites from 2002 through 2004. Base-metal exploration assumed a greater level of importance in Canada with the drop in the price of gold from 1998 through 2001.
Figure 10B shows the change in the distribution of mineral exploration targets for the 1995-2004 study period in Australia. As in Canada, gold represented the greatest number of sites, and gold exploration activity fluctuated in line with the change in gold price. Gold accounted for an average of 61 percent of Australian exploration activity in terms of number of sites from 1995 through 1997, a average of 40 percent of the sites from 1998 through 2001, and 54 percent of the sites from 2002 through 2004. Copper increased to 11 percent of Australian sites for the period 2002-04 from 6 percent of Australian sites for the period 1995-97, while nickel decreased to 13 percent of the Australian exploration sites for the 2002-04 period from 16 percent of Australian sites for the period 1995-97. The search for ferrous and industrial minerals (included in “other” in figure 10B) in Australia increased significantly during the study period, contributing to the percentage increase in the “Other” category after 1998.
Figure 10C shows the change in the distribution of mineral exploration targets in Asia from 1995 to 2004. Much of the growth in exploration in Asia was in China and Mongolia. Only five mineral exploration sites were reported for Asia in 1995; by 2004, however, more than 140 sites were being actively explored. Of these, 57 percent was being explored for gold, and 28 percent, for copper.
|
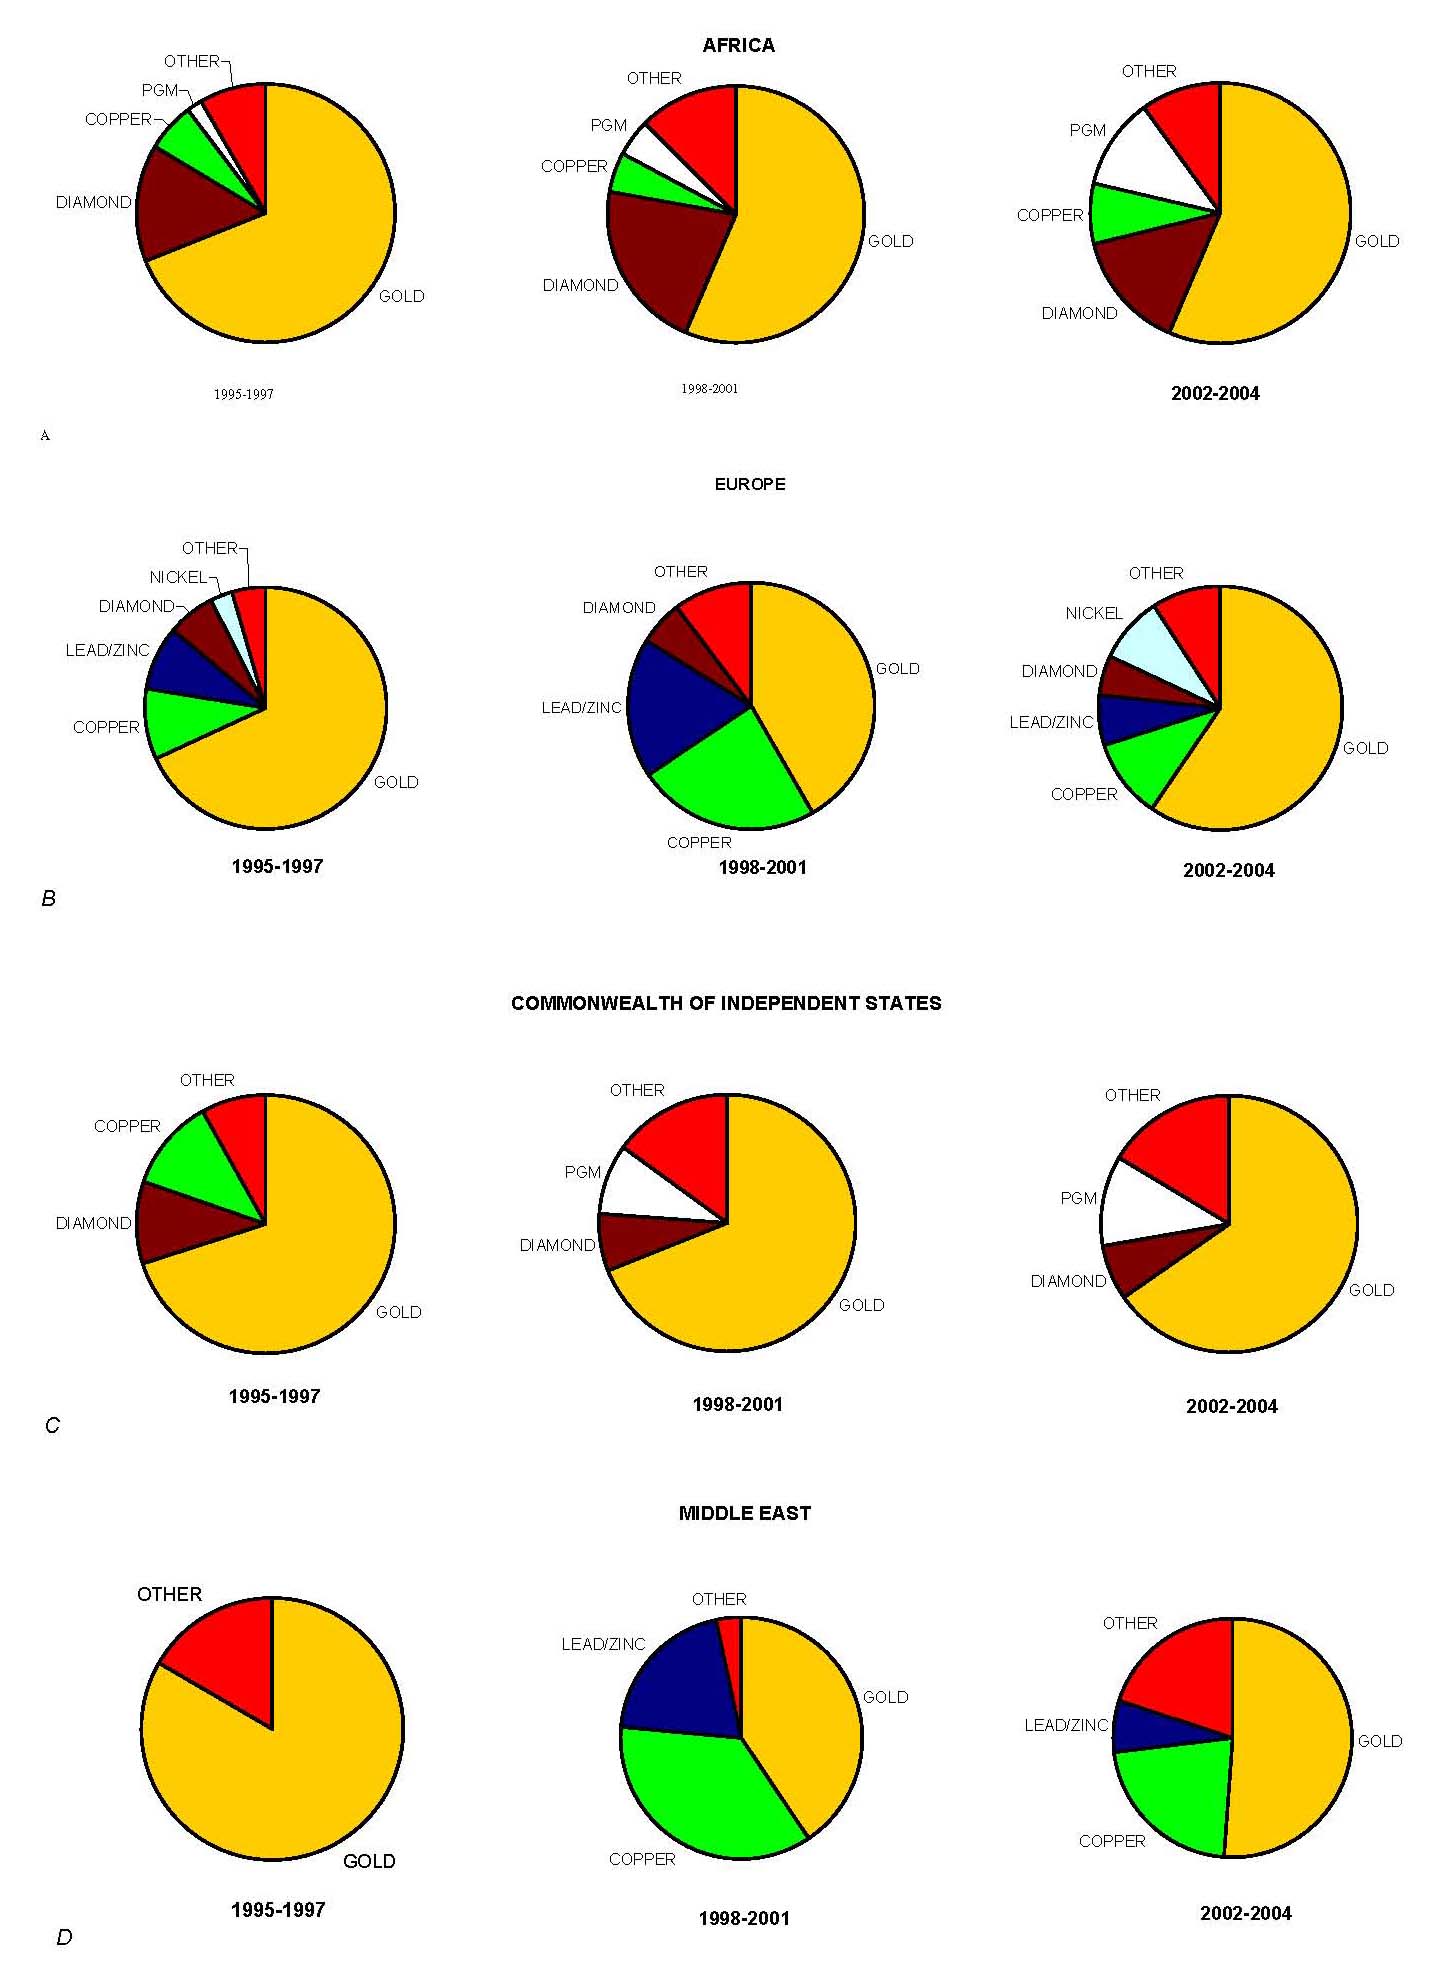
Figure 11A shows exploration target distribution for selected mineral commodities in Africa from 1995 through 2004. Gold and diamond exploration together represent more than 70 percent of African exploration activity, but PGM exploration activity appears to be increasing (to 40 sites in 2004 from 3 sites in 1995). Copper is also a principal target in Africa.
Figure 11B shows exploration target distribution for selected mineral commodities in Europe from 1995 through 2004. While gold and base-metals exploration together contributed more than 75 percent of exploration activity in Europe, PGM and diamond have also been important mineral targets.
Figure 11C shows exploration target distribution for selected mineral commodities for the same time period in the Commonwealth of Independent States (primarily Russia). Principal exploration targets in 2004 were gold (65 percent), PGM (11 percent), and diamond (7 percent).
Figure 11D shows exploration target distribution for selected mineral commodities for the same time period in the Middle East. Exploration activity in the Middle East for the mineral commodities studied generally increased since 1999. Mineral deposits with significant resources are being explored or developed in Iran, Saudi Arabia, Turkey, and Yemen. Gold and base metals are the principal targets.
|
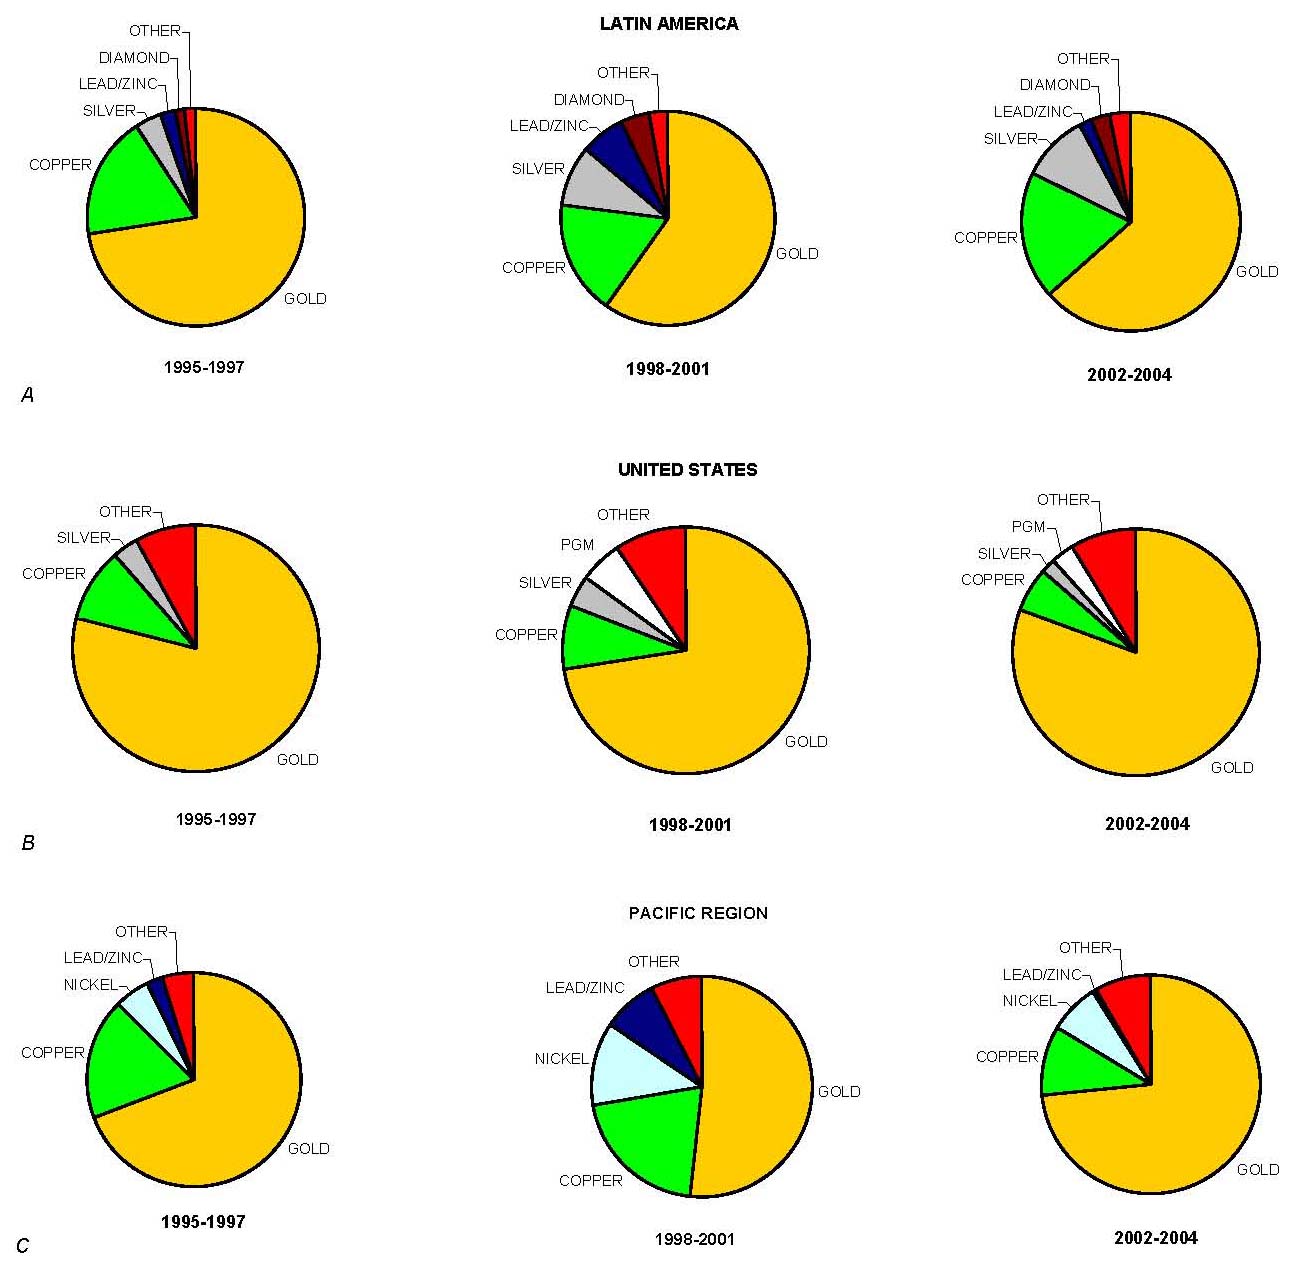
Figure 12A shows exploration target distribution for selected mineral commodities from 1995 through 2004 in Latin America. For the entire 10-year study period, gold attracted at least 60 percent of exploration activity in terms of sites, and copper exploration averaged 18 percent of the Latin American sites considered in this study. From 2002 through 2004, other principal targets were silver (10 percent), diamond (3 percent), and lead and zinc (2 percent combined).
Figure 12B shows exploration target distribution for selected mineral commodities from 1995 through 2004 in the United States. For the 10-year study period, gold exploration ranged from 70 to 80 percent of all exploration sites (primarily in Alaska and Nevada) considered in this study. Copper exploration ranged from 5 to 10 percent of U.S. minerals exploration site activity, PGMs ranged from 3 to 8 percent, and silver ranged from 2 to 4 percent.
Figure 12C shows exploration target distribution for selected mineral commodities from 1995 through 2004 in the Pacific region. Principal mineral targets were gold and the base metals copper, lead, nickel, and zinc. For the 10-year study period, gold exploration ranged from 50 to 75 percent of all exploration sites considered in this study, and base-metal exploration ranged from 19 to 41 percent of the exploration sites. Allegations of mineral resource falsification at the Busang property in Indonesia in 1997, financial instability, and regional unrest all influenced the focus of exploration activity during the study period.
|
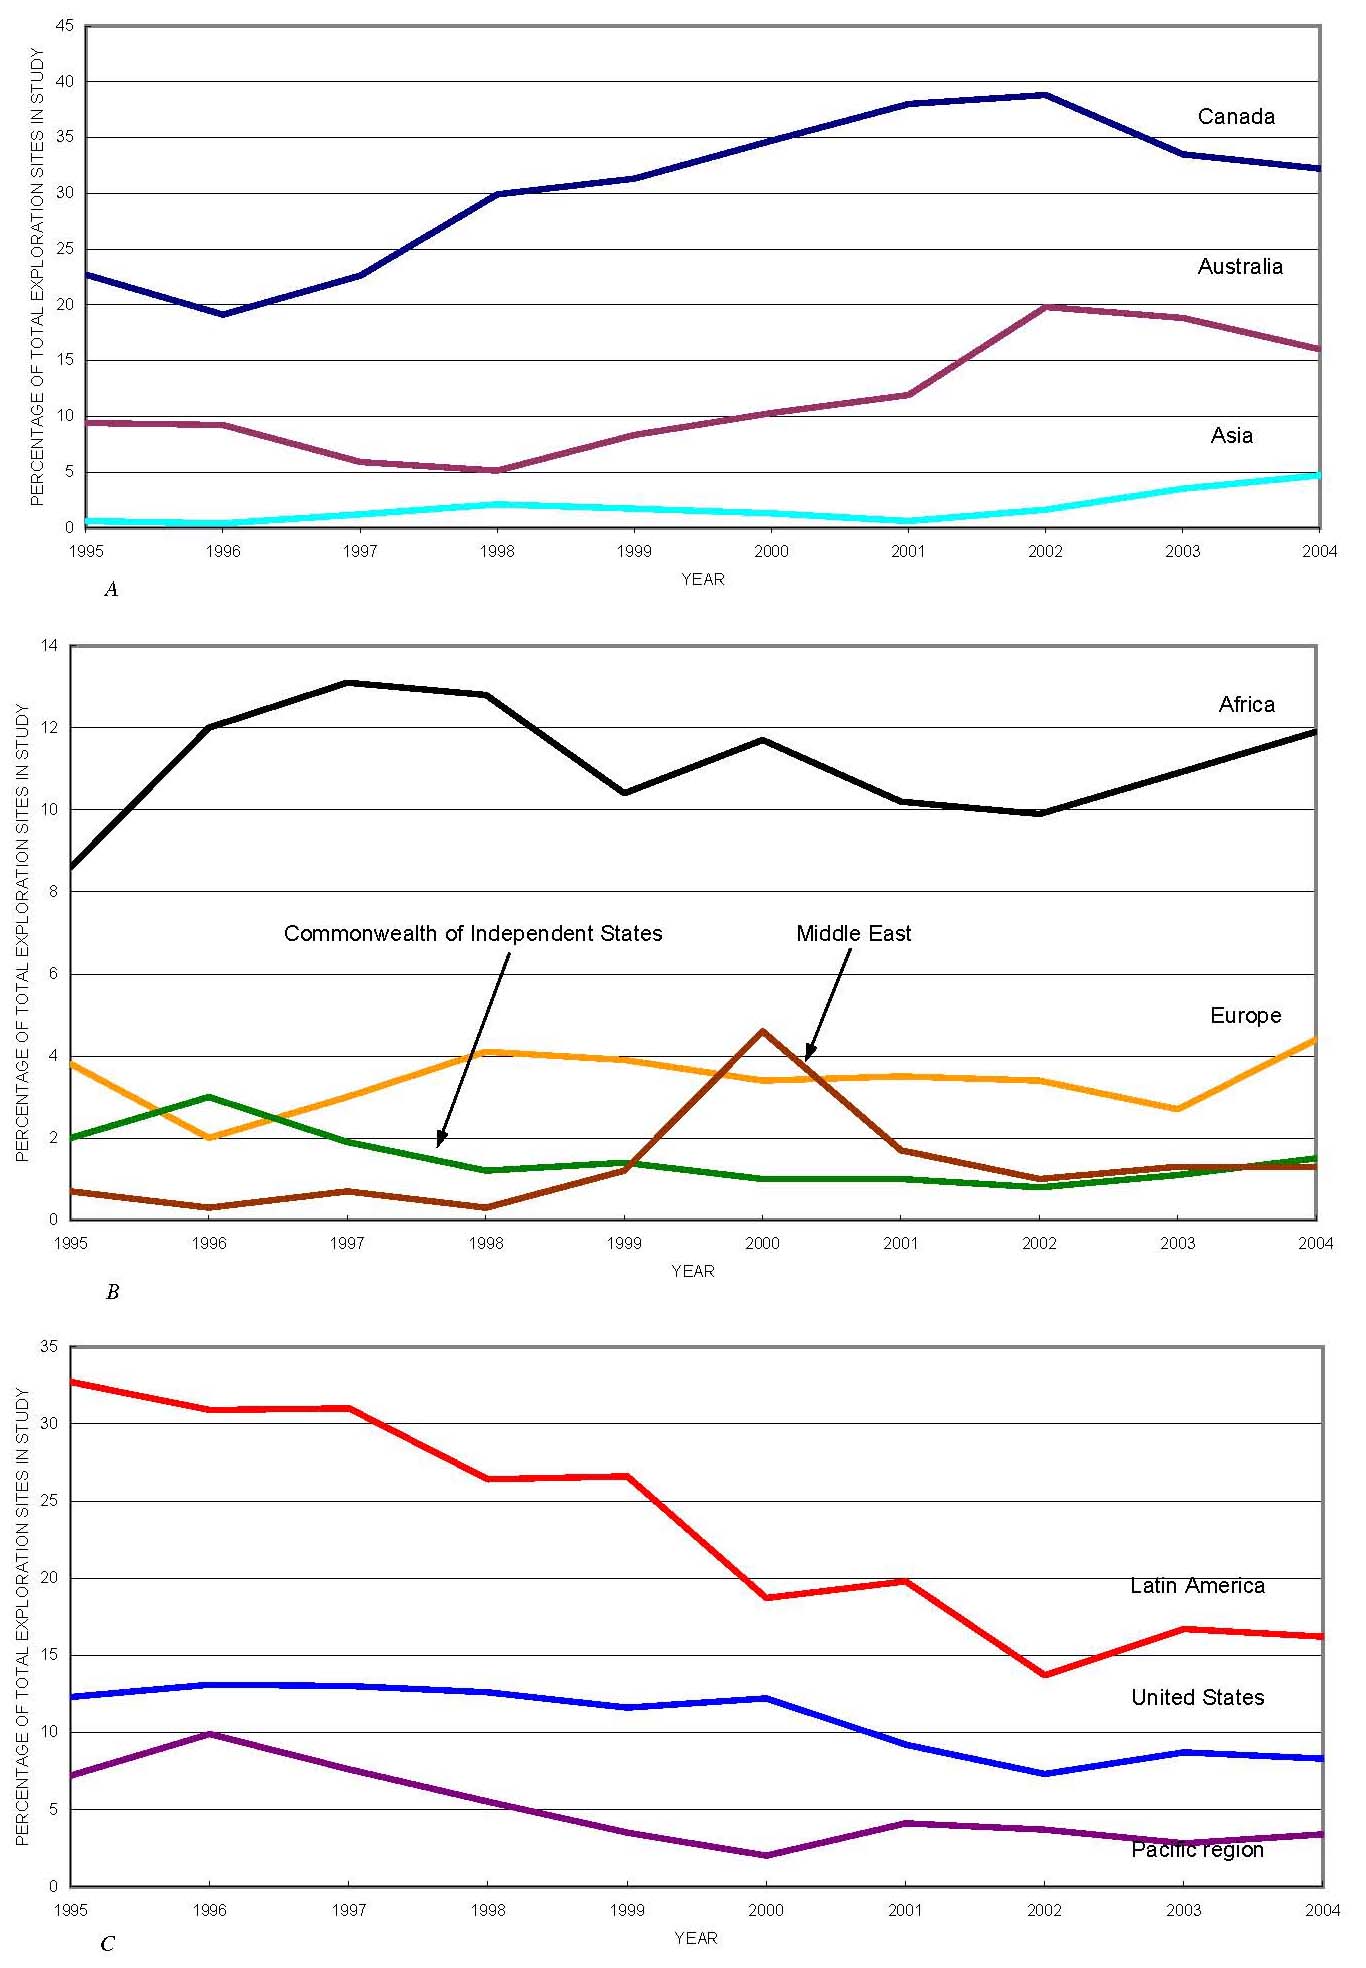
Figure 13 summarizes regional exploration activity for 1995 through 2004. Figure 13A shows regions with a general trend of increasing activity; figure 13B shows regions where exploration activity has remained relatively constant; and figure 13C shows regions with a general trend of decreasing exploration activity for the 10-year study period. The general trends are expressed in terms of a region’s percentage share of exploration sites as compiled for this study.
Although figure 13C shows that the Latin American share of exploration activity as a percentage of all exploration sites included in this study dropped to 16 percent in 2004 from 33 percent in 1995, the significance of this trend requires further discussion. Latin America still represents the region with the largest amount of exploration activity in 2004. In spite of the drop on a percentage basis, the actual number of active sites increased to about 490 in 2004 from about 290 in 1995. Data suggest that the drop in the exploration share in Latin America was more a result of corporate consolidation and restructuring, new discoveries in other areas (diamond in Canada and PGMs in Russia and South Africa), and a tight money supply, rather than a loss of interest in Latin American exploration.
Conversely, figure 13A shows what appear to be significant increases in Canadian and to a lesser extent Australian exploration activity expressed as a percentage share of the total number of exploration sites studied. While exploration activity in terms of number of sites in Canada did increase to about 900 sites in 2002 from about 190 sites in 1996 (owing to recent base-metal, diamond, and gold discoveries and the re-evaluation of established mining areas with newer technology), further explanation is warranted. With the industry consolidation and tight exploration budgets between 1997 and 2002, most early-stage exploration activities were relegated to junior companies. The majority of junior mineral exploration companies are Canadian or Australian. Because junior companies often do not have the capital to support extensive exploration, they are dependent on investors or bank financing for operations. All things being equal, investors are more likely to provide funding for projects that present the greatest expected return on investment, a function of both payoff and risk. One result was that junior companies found it was easier to finance an Australian or Canadian project than a project in another country with greater perceived risk. Consequently, there was more exploration in Australia and Canada. As the economy improved after 2002, exploration again focused on foreign investment in areas with higher perceived risk. Higher mineral prices also contributed to the increase of exploration activity in Africa, Asia, and to some extent, Europe and the United States after 2002.
Because the level of mineral exploration activity is linked to multiple factors designed to maximize corporate profit margins, and each factor is tied to current and anticipated mineral commodity prices, existing infrastructure, investment climate, regional and local geology, and social and political factors, the future direction of the minerals exploration industry is difficult to predict. However, a number of observations can be made from existing data.
For the near term, it is likely that—
Of the 15,300 sites listed during the 10-year period between 1995 and 2004, 588 sites were considered to be noteworthy in terms of exploration activities. Of these 588 sites, 84 (14 percent) achieved production by 2005, 46 (8 percent) were under active development in 2005, 59 sites (10 percent) were being considered for development in 2005, and feasibility studies were ongoing at 28 sites (5 percent) in 2005. In addition, 52 sites (9 percent) continued to produce throughout the 10-year study period, while 28 sites (5 percent) ceased production during the period. It is significant to note that approximately one-half of these sites remain at the exploration stage, even with extensive drilling or the expenditure of considerable capital.
Annual summaries of mineral exploration activities for 1995 to 2004 were published by the USGS in the May issue of Mining Engineering in the year following data collection. Electronic links to summary texts, tables, and figures are provided in the following table.
| Summary text (RTF) | Selected noteworthy site table (PDF) | Figure 1 (PDF) | Figure 2 (PDF) | Figure 3 (PDF) | Figure 4 (PDF) | Figure 5 (PDF) | Figure 6 (PDF) |
|---|---|---|---|---|---|---|---|
| 1995 | Table 1 | Figure 1 | Figure 2 | Figure 3 | NA | NA | NA |
| 1996 | Table 1 | Figure 1 | Figure 2 | Figure 3 | Figure 4 | NA | NA |
| 1997 | Table 1 | Figure 1 | Figure 2 | Figure 3 | Figure 4 | Figure 5 | NA |
| 1998 | Table 1 | Figure 1 | Figure 2 | Figure 3 | Figure 4 | Figure 5 | NA |
| 1999 | Table 1 | Figure 1 | Figure 2 | Figure 3 | Figure 4 | Figure 5 | NA |
| 2000 | Table 1 | Figure 1 | Figure 2 | Figure 3 | Figure 4 | Figure 5 | NA |
| 2001 | Table 1 | Figure 1 | Figure 2 | Figure 3 | Figure 4 | Figure 5 | NA |
| 2002 | Table 1 | Figure 1 | Figure 2 | Figure 3 | Figure 4 | Figure 5 | Figure 6 |
| 2003 | Table 1 | Figure 1 | Figure 2 | Figure 3 | Figure 4 | Figure 5 | Figure 6 |
| 2004 | Table 1 | Figure 1 | Figure 2 | Figure 3 | Figure 4 | Figure 5 | Figure 6 |
| RTF, Microsoft© rich text format; PDF, Adobe© portable document format; NA, not available. |
References for the published summaries are cited below.
The following is a detailed annual compilation of historical international exploration site data for the years 1995 to 2004. Data were compiled by the USGS as reported from public sources and have not been verified by the USGS.
The following is a detailed annual compilation of historical international exploration site data for the years 1995 to 2004. Data were compiled by the USGS as reported from public sources and have not been verified by the USGS.
| Year of data coverage | Format | Date last modified | |
|---|---|---|---|
| 1995 | XLS | September 6, 2005 | |
| 1996 | XLS | September 6, 2005 | |
| 1997 | XLS | September 6, 2005 | |
| 1998 | XLS | September 6, 2005 | |
| 1999 | XLS | September 6, 2005 | |
| 2000 | XLS | September 6, 2005 | |
| 2001 | XLS | September 6, 2005 | |
| 2002 | XLS | September 6, 2005 | |
| 2003 | XLS | September 6, 2005 | |
| 2004 | XLS | September 6, 2005 | |
Although each compilation includes an abbreviated explanation of terms and abbreviations used in that particular compilation, a complete explanation of category definitions and notes is also included (open the RTF file).
Each annual summary includes a table of the most noteworthy sites for that year based on the specified selection criteria. The development status of these sites has been updated to reflect mid-year 2005 information. Sites are listed alphabetically by region (open the XLS spreadsheet).
For questions concerning scientific content of this report, please contact David R. Wilburn.
| Accessibility | FOIA | Privacy | Policies and Notices | |
 |
|