
U.S. Geological Survey Data Series 182, usSEABED: Pacific Coast Offshore Surficial-Sediment Data Release, version 1.0
Home | Contents | Site Map | Introduction | usSEABED | dbSEABED | Data Catalog | References | Contacts | Acknowledgments | Frequently Asked Questions | Disclaimer | Accessibility
Calibration
dbSEABED is an information-processing system that can perform statistical and individual tests of accuracy across the range of output parameters.
Issues of accuracy and reliability become apparent as soon as data are integrated. Tools for monitoring the integration process are required, with feedback to the input data, so that improvements can be made in the system.
Basic uncertainties exist in all the incoming data that cannot be reduced and integrative systems cannot proceed past that uncertainty. Parallel studies in dbSEABED have determined on the basis of replicate analyses that analytical data, such as grain size analyses (Syvitski and others, 1991), has 1-sigma uncertainties on the order of 4 percent of the total parameter range, or 0.8 phi. With good maintenance of the data, the outputs from dbSEABED approach those levels of reliability.
Statistical Tests
In the case of the thousands of samples where both analytical and descriptive data exists, a statistical comparison can be made between the EXT and PRS data outputs. The results of this calibration are an overall guide to the accuracy of the regional mappings, and a highlighting of areas and issues in the data where improvements can be made. Those improvements involve both the analytical and descriptive raw input data. For example, grain-size analyses that appear to be the whole sediment but are really only of the sand fraction or analyses where gravel/shell has been omitted from an analysis.
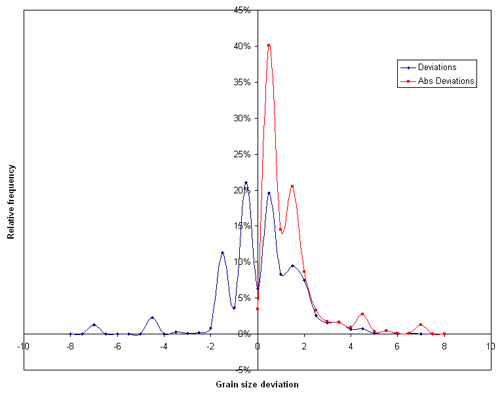
The EXT and PRS outputs are imported into Microsoft Access® and links are created between the two files (based usually on the SampleKey). Entries with null values (-99) in either EXT or PRS are eliminated through a query. This query is brought into MS Excel and used to calculate the frequency distribution of deviations ( + and absolute) and plotted for inspection. Percentile statistics are calculated using the absolute deviation at the 50 (Median Absolute Deviation (MAD)), 68, and 95 percentiles (1s, 2s). Examples of the outputs are shown in the description of usSEABED. For most datasets the percentile statistics are 0.4, 0.8, and 4 phi for the 50, 68, and 95 percent levels, which may be acceptable over such a diverse set of input datasets but can be improved. An example of this analysis is shown in the figure below, for a dataset that is under improvement.
 |
|---|
| Figure 3. Statistical calibration of outputs for grain sizes, shown using a frequency plot of the deviations between PRS and EXT data, using an improving Atlantic Coast dataset. Deviations are the result of inaccuracies in EXT and PRS input data, as well as to identifiable issues in the data as highlighted below in fig. 4. The 50, 68, and 95 percent confidences are 0.8, 1.3, 4.3 phi, respectively. Click on figure for larger image. |
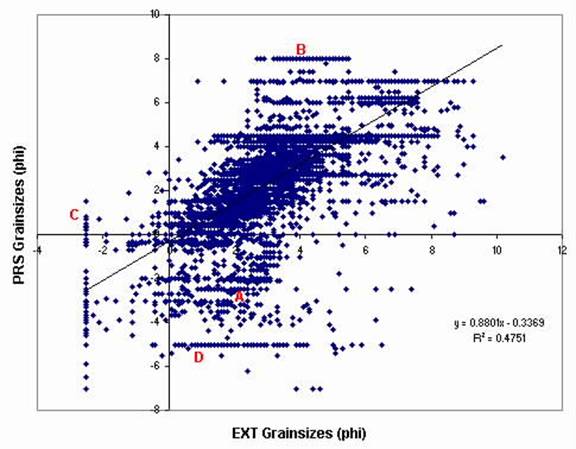
A second way of statistically evaluating the results uses a cross-plot between the EXT and PRS output data in the figure below. This type of plot serves to highlight some of the issues that may reduce the accuracy of dbSEABED with incoming datasets. At the locations A-D these common issues are identified in populations of points:
- PRS coarser than GRZ, apparently due to outsized shells / clasts being omitted from lab grain size analyses;
- Sediment described as very fine in PRS, but only the sand fraction is represented by the EXT analysis data;
- Detailed analyses of grain sizes does not go beyond coarsest class of about -2.5 phi; and
- Descriptive PRS data does not distinguish grades of sand, and is apparently dominated by reports of very large clasts, such as cobbles or shell, that were not analyzed.
 |
|---|
| Figure 4. Crossplot of the EXT and PRS output data for a region, not in U.S. waters. A-D represent populations of data that have commonly encountered problems. With the detection and fixing of these problems the accuracy of outputs is substantially improved over that shown here. Notice that overall PRS data extend further in coarse grades and that EXT data extend further in fine grades, reflecting their common observational biases. |
Individual Tests
The programs of dbSEABED have been equipped to detect problematic data, whether by values falling outside plausible limits or by mismatches between EXT and PRS results. These tools normally do not prevent the problem values being output, but they do report detections to a diagnostics file that is particularly useful in the preparation and cleaning of incoming datasets. The statistical data shown in figure 3 is employed to set the filters, usually at the 68 percent (1s) level. The original data can then be revisited, checked for issues such as those shown in Figure 4, and can be corrected, deactivated, or left alone as appropriate.
Any use of trade names is for descriptive purposes only and does not imply endorsement by the U.S. Government.
Home | Contents | Site Map | Introduction | usSEABED | dbSEABED | Data Catalog | References | Contacts | Acknowledgments | Frequently Asked Questions | Disclaimer | Accessibility
Accessibility | FOIA | Privacy | Policies and Notices
U.S. Department of the Interior U.S. Geological Survey
URL: https://pubs.usgs.gov/ds/2006/182/calibration.html
maintained by Mike Diggles
last modified 25 May 2006 (jar)