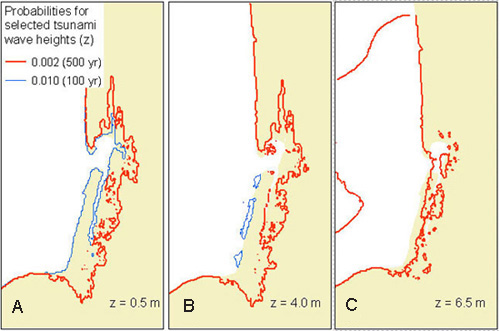
iy01_005 - PTHA probabilities determined by input from all far- and near-field sources
iy01_005aa - probabilities determined using only source 1 of the Alaska-Aleutian segmentation
iy01_005td480 - PTHA wave heights determined using a mean inter-event time of 480 years (mean value from records)
iy01_005td560 - PTHA wave heights determined using a mean inter-event time of 560 years (value from model)
The data are provided as grids in xyz and as Arcinfo ASCIIGRID format files (.asc). Grid cell spacing is 0.000558-degree (~60 meters) with probability values for each of the 21 wave height intervals 0.5 to 10.5 meters at 0.5-meter intervals.
Example of .xyz format:
 -123.969688 46.059677 0.038109
 -123.969131 46.059677 0.038109
 -123.968575 46.059677 0.038109
 -123.968010 46.059677 0.038109
The .asc file consists of header information containing a set of keywords, followed by cell values in row-major order. The file format is
 ncols         133
 nrows         183
 xllcorner     -123.969967
 yllcorner     45.957843
 cellsize      0.000558
 NODATA_value  -9999
 row 1
 row 2
 .  .  .
 row n
Files included in each set
 iy01_005.xyz   iy01_005.asc
 iy02_010.xyz   iy02_010.asc
 iy03_015.xyz   iy03_015.asc
 iy04_020.xyz   iy04_020.asc
 iy05_025.xyz   iy05_025.asc
 iy06_030.xyz   iy06_030.asc
 iy07_035.xyz   iy07_035.asc
 iy08_040.xyz   iy08_040.asc
 iy09_045.xyz   iy09_045.asc
 iy10_050.xyz   iy10_050.asc
 iy11_055.xyz   iy11_055.asc
 iy12_060.xyz   iy12_060.asc
 iy13_065.xyz   iy13_065.asc
 iy14_070.xyz   iy14_070.asc
 iy15_075.xyz   iy15_075.asc
 iy16_080.xyz   iy16_080.asc
 iy17_085.xyz   iy17_085.asc
 iy18_090.xyz   iy18_090.asc
 iy19_095.xyz   iy19_095.asc
 iy20_100.xyz   iy20_100.asc
 iy21_105.xyz   iy21_105.asc
Geist, Eric L. , and Wong, Florence L. , 2006, Annual probabilities of exceedance for tsunami wave heights from 0.5 to 10.5 meters, Seaside, Oregon :.This is part of the following larger work.Online Links:
Wong, Florence L. , Venturato, Angie J. , and Geist, Eric L. , 2006, Seaside, Oregon Tsunami Pilot Study - Modernization of FEMA Flood Hazard Maps: GIS Data: U.S. Geological Survey Data Series 236, U.S. Geological Survey, Menlo Park, California.Online Links:
This is a Raster data set. It contains the following raster data types:
Horizontal positions are specified in geographic coordinates, that is, latitude and longitude. Latitudes are given to the nearest 0.000558. Longitudes are given to the nearest 0.000558. Latitude and longitude values are specified in Decimal degrees.
The horizontal datum used is North American Datum of 1983.
The ellipsoid used is Geodetic Reference System 80.
The semi-major axis of the ellipsoid used is 6378137.000000.
The flattening of the ellipsoid used is 1/298.257222.
650-329-5327 (voice)
650-329-5190 (FAX)
fwong@usgs.gov
This data set is one of a collection of digital files of a geographic information system of spatially referenced data related to the Seaside, Oregon, Tsunami Pilot Study.Federal Emergency Management Agency (FEMA) Federal Insurance Rate Map (FIRM) guidelines do not currently exist for conducting and incorporating tsunami hazard assessments that reflect the substantial advances in tsunami research achieved in the last two decades (Tsunami Pilot Study Working Group, 2006). Therefore, as part of FEMAs Modernization Program, a Tsunami Pilot Study was carried out in the Seaside/Gearhart, Oregon, area to provide information from which tsunami mapping guidelines could be developed. This area was chosen because it is typical of coastal communities in the section of the Pacific Coast from Cape Mendocino to the Strait of Juan de Fuca. There was also considerable interest shown by state agencies and local stakeholders in mapping the tsunami threat to this area. The study was an interagency effort by scientists from the U.S. Geological Survey, the National Oceanic and Atmospheric Administration, the University of Southern California, and the Middle East Technical University. We present the GIS data from that report in this publication.
These data are intended for science researchers, students, policy makers, and the general public. The data can be used with geographic information systems (GIS) software to display geologic and oceanographic information.
Tsunami Pilot Study Working Group, 2006, Seaside, Oregon Tsunami Pilot Study - Modernization of FEMA Flood Hazard Maps: U.S. Geological Survey Open-File Report 2006-1234, U.S. Geological Survey, Menlo Park, California.Online Links:
Geist, Eric L. , and Parsons, Tom, 2006, Probabilistic analysis of tsunami hazards: Natural Hazards v. 37, n. 3, p. 277-314.
Mofjeld, H.O., Venturato, A.J., González, F.I., 2004, Background tides and sea level variations at Seaside, Oregon: NOAA, Technical Memorandum OAR PMEL-126, p. 15. OAR PMEL-126.Online Links:
The maximum wave heights presented here were modeled by probabilistic tsunami hazard assessment techniques and approximate the magnitudes of a 0.2% annual probability flood. Accuracy with these estimates can be associated with uncertainty in the model results. Sources of aleatory uncertainty from fault rupture complexity and tidal stage at tsunami arrival time. For the former, the coefficient of variation is typically 20% (Geist, 2005). For the latter, the coefficient of variation is typically 7% (Mofjeld and others, 2004). A comprehensive analysis for other sources of aleatory and epistemic uncertainty has not been conducted for this pilot study.
Complete.
No tests of logical consistency were conducted.
Are there legal restrictions on access or use of the data?
- Access_Constraints: None.
- Use_Constraints:
- The data, digital results, GIS layers, and map products in this database have been created specifically as part of a pilot study for FEMA's modernization of Flood Insurance Rate Maps (FIRMs) project. The results of the pilot study are intended to help FEMA draft new guidelines related to tsunami flooding for Coastal Flood Hazard Analysis and Mapping for the Pacific Coast of the United States. The results are intrinsically probabilistic and designed according to FEMA flood zone specifications: annual probabilities of exceedance of 1% and 0.2%. The data, digital results, GIS layers, and map products are not intended for other uses. In particular, the 1% and 0.2% annual exceedance probability tsunami flood maps are not to be used for emergency planning, evacuation, or other insurance purposes. Please refer to the National Tsunami Hazard Mitigation Program tsunami inundation maps for use in emergency planning.
Please recognize the U.S. Geological Survey (USGS) as the source of this information.
Although these data have been used by the U.S. Geological Survey, U.S. Department of the Interior, no warranty expressed or implied is made by the U.S. Geological Survey as to the accuracy of the data.
The act of distribution shall not constitute any such warranty, and no responsibility is assumed by the U.S. Geological Survey in the use of this data, software, or related materials.
This information is not intended for navigational purposes.
Any use of trade, firm, or product names is for descriptive purposes only and does not imply endorsement by the U.S. Government.
1-888-275-8747 (voice)
infoservices@usgs.gov
U.S. Geological Survey Data Series 236
This information is not intended for navigational purposes.Any use of trade, firm, or product names is for descriptive purposes only and does not imply endorsement by the U.S. Government.
| Data format: | ARCE (version 9.1) ArcGIS gridascii export Size: 0.230 |
|---|---|
| Network links: |
<https://pubs.usgs.gov/ds/2006/236/> |
.xyz files may be viewed by any software that will read text fields. .asc files are best converted with the Arcinfo ASCIIGRID tool.
650-329-5327 (voice)
650-329-5190 (FAX)
fwong@usgs.gov