U.S. Geological Survey Data Series 291
Side Scan Sonar MethodologyAcquisition System: |
||||||
 |
||||||
|
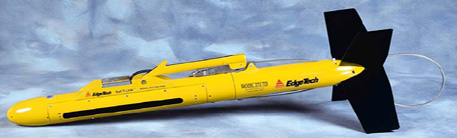
A side scan sonar system uses acoustic energy to image the seafloor. The system consists of a self-contained sound source and receiver, housed in a submersible body that is towed from a surface vessel. The subsurface unit, or "towfish", transmits and receives acoustic energy in a wide band across the track of the towfish, and transmits the signal to a topside processor. The towfish is equipped with a linear array of transducers that emit and receive an acoustic energy pulse in a specific frequency range. The strength of the acoustic return varies with changes in the characteristics of the seafloor. In general, a seafloor with rough texture, such as gravel or boulders, will produce more backscatter in the return signal, resulting in higher amplitude. This pattern results in lighter shades of gray on the resulting side scan image. Smoother texture, such as a sand or mud-dominated seafloor, returns a darker image. As the towfish transverses the survey area, a strip image is produced by the processor. These strip images are then georeferenced and spatially integrated into a mosaic that represents the acoustic character of the seafloor. Processing
All side scan raw data files were processed with CARIS Sonar Information Processing System (SIPS) version 6.0 with the following workflow: 1) Create vessel configuration file for the R/V G. K. Gilbert. Initial roll, yaw, pitch, and x,y,z axis parameters are set to zero. This information is incorporated into the data at the time of collection as the installation parameters. 2) Create a new project directory for the SIPS data. 3) Use the CARIS software to convert the raw sonar files from eXtended Triton Format (XTF) to SIPS format. The new SIPS files are saved to a project specific directory. 4) Evaluate each line with the Navigation Editor to "clean" the vessel's navigation data. Identify excessive changes in speed, reject the position fixes along with the fixes before and after the changes, and replace with interpolated values. The lines are also evaluated with the Attitude Editor to view and "clean" the motion sensor data for heave, pitch, and roll when necessary. 5) Evaluate each line and correct slant range in the Side Scan Editor. Use a sound velocity of 1,538 m/s for the slant range correction. Collect sound velocity data by manually lowering a sound velocity probe over the side of the ship during data collection. 6) Create a field sheet for the study area and add all lines to a new mosaic at a resolution of 1 m. 7) Export the mosaic to a tiff image with the associated world file. The side scan mosaic can be viewed on the Images page. Also, the tiff image with its associated world file can be found in the Data Products folder. |
||||||
Swath Bathymetry MethodologyAcquisition System: |
|||||
|
Bathymetry was collected using an interferometric swath sonar system accompanied with a motion sensor that recorded vessel motion in real time. A swath-sounding sonar system is used to measure the depth in a line extending outward from the sonar transducer. As the survey vessel with mounted transducer moves forward, scanning the seabed to each side, it sweeps out an area of depth measurements. This area is called a swath, and the technique is know as swath bathymetry. Depth measurements from interferometric systems are obtained by measuring the angle of the incoming sound signal in addition to the range. Interferometric sonar systems require three or more linear arrays of transducer elements, one to transmit acoustic energy and at least two to receive the returning signal (Submetrix Training Manual, 2000). The interferometric sonar system measures depth using both the travel time of the emitted pulse and the angle the returning sound energy makes with each linear array. The times it takes for the returning wavefront to reach each array are acquired simultaneously by the topside electronics which, if the speed of sound in water is known, can be used to determine a range to the seafloor at a given instance in time. Knowing the time lag of the returning signal relative to each array, and by comparing the phase content of the incoming signal at each array relative to the others, one can then use this information to calculate the angle between the direction of the acoustic signal and the transducer head. The angle and range pairs of data make it possible to determine the exact location from which the scattered returning energy originated. Swath System Calibration The USGS FISC SWATHplus H system uses a Coda Octopus F190 inertial attitude and positioning system. This system supplies real time corrections and data on vessel heave, pitch, roll, heading, and positioning (USGS/DGPS) information for data acquisition and postprocessing. Calibration is a two-part procedure. First the F190 must be calibrated, and then the SWATHplus H system is calibrated. The F190 calibration involves setting the configuration parameters (sensor positions, antenna positions) then restarting of the system. The vessel then executes sequences of dynamic maneuvers (circles, figure eights, starts, stops) for anywhere between 15 to 120 minutes. This step insures that accurate gyro parameters including heading, attitude, position, and velocity data will be available in real time for swath data collection. SWATHplus H calibration typically involves entering system configuration data (electronic and physical parameters of system components) and collecting roll, pitch, and heading data from the execution of calibration survey lines – a patch test. Roll patch tests consist of five parallel lines over a flat bottom. The lines are 500 m long with 100 percent overlap. Pitch patch tests consist of four lines over a slope (for example, channel, dredge scour) run over the same track. Two lines are run slowly (~3 knots.), 180 degrees out from each other. The other two lines are run fast (~8 knots.), 180 degrees out from each other. Heading patch tests consist of four lines run past an object (jetty, pier). Two lines are run close to the object (for example, 10 meters), and the other two are run farther out (for example, 40 meters). Each set of two is run over the same track, 180 degrees out. These patch test lines, as well as the actual survey lines, were collected with acquisition software, Swath Processor, version 2.07.1.The calibration lines were processed with Grid Processor, version 2.05, in order to determine the system offsets or corrections. These corrections were then entered into the configuration files of the Swath Processor data acquisition package for use during the survey. Processing All swath raw data files were processed with CARIS Hydrographic Information Processing System (HIPS) version 6.0 with the following workflow: 1) Create vessel configuration file for each cruise. Set initial roll, yaw, pitch, and x,y,z axis parameters to zero. Incorporate this information into the data at the time of collection as the installation parameters. 2) Create a new project directory for the HIPS data. Organize this data set by day. 3) Import raw line files in the SXP format into CARIS Conversion Wizard. The Conversion Wizard converts raw data files to HIPS format and saves the files to a project directory. The SXP files are output from the Submetrix software with the offset and gyro data incorporated. 4) Evaluate each line with the Navigation Editor to "clean" the vessel's navigation data. Locate excesive jumps in naviagtion positioning, reject the position fixes along with the fixes before and after the jumps, and replace them with interpolated values. The lines are also evaluated with the Attitude Editor to view and interpolate large spikes in the motion sensor data for heave, pitch, and roll when necessary. 5) Create a tide file using the data from the NOAA tide station at 6) Merge all lines to create the position and depth data for each sounding. 7) Create filters for the survey and set to: minimum depth 6 m, maximum depth 14 m (as requested by researchers). 8) Open all lines using CARIS Swath Editor to remove outliers, bad pings, and erroneous outter beams when necessary. 9) After merging and cleaning, create a bathymetry based on statistical error (BASE) surface at 1-m, 5-m and 10-m resolution. 10) Export these BASE surfaces as geoTIFF images. Export the processed soundings as ASCII files in x,y,z format using the UTM coordinate system. Create an interpolated bathymetry surface from the x,y,z data in ESRI ArcMap version 9.1 software. The swath surfaces can be viewed on the Images page. Also, the x,y,z files can be found in the Data Products folder. |
|||||
Singlebeam Bathymetry MethodologyAcquisition System: |
|||||
|
A single-beam seafloor-elevation survey was conducted using the System for Accurate Nearshore Depth Surveying (SANDS) system. As a result of Hurricane Andrew in 1992, SANDS was developed and tested by the USGS Florida Integrated Science Center (FISC) - St. Petersburg, FL. SANDS, a single-beam acoustic (sounding) (fig. 1) GPS-based hydrographic system, has two components, data acquisition and data processing. Differential boat position was recorded using GPS referenced to a land-based benchmark. To increase positional accuracy, base stations are positioned over geographic benchmarks located within 10 km of the survey area and are occupied throughout the survey. Boat position, motion (heave, pitch, and roll) and depth readings collected during the survey are stored on a laptop computer. These boat components are merged into a single data set using time correlations.
Figure 1. Diagram of SANDS data acquisition method.
A 22-foot Boston Whaler (R/V Streeterville) with outboard motors was fitted with the acquisition hardware and software. The vessel is capable of operating in 46 cm of water and provides a stable platform for daylight, nearshore operations. The acquisition hardware is composed of four separate units: a GPS system on land (base), a GPS system on the boat (rover), a motion sensor (vessel heave, pitch, and roll), and an echosounder. The hardware units on the vessel are mounted in line on a rigid pole with the echosounder transducers just below the waterline, the motion sensor is housed in a watertight steel container mounted above the transducers, and the GPS choke ring antenna is mounted at the top of the pole approximately 3 m above the transducers (fig. 2).
Figure 2. Hardware components used on the survey vessel (rover) (A), and at the benchmark (base) (B). The antennas receive the positioning signal from the NAVSTAR GPS satellite constellations\ (fig. 1). Two Ashtech Z-Xtreme GPS receivers with internal data card storage simultaneously record 12-channel full-carrier phase positioning signals (L1/L2) from the satellites. The base receiver and the rover receiver record their positions concurrently at 1-s recording intervals throughout the survey period. Boat motion (heave, pitch, and roll) is recorded at 50-ms intervals using a TSS-DMS-05 Motion Sensor. Boat pitch and roll measurements from the sensor are utilized by SANDS in postprocessing of the data. Heave motion is a major depth error component. Although motion sensors can reasonably compensate for vessel motion, they are still subject to constant drifts and require visual monitoring (via readout) during survey and in post-processing. In SANDS, the heave motion from the TSS is not used is more accurately represented by using the GPS component. Depth soundings are recorded at 50 ms intervals using a Marimatech E-Sea-103 echosounder system, with dual 208-kHz transducers. Designed for shallow-water work, one transducer generates a sound pulse while the other one receives the bottom returned signal. The transducer generates a narrow 4-degree “beam” sound pulse which produces a small sonar footprint for higher resolution and accuracy. The data strings from the GPS receiver, motion sensor, and fathometer are streamed in real time to a laptop computer running a Windows operating system. The acquisition software used was HYPACK MAX version 4.3A (HYPACK, Inc.), a marine surveying, positioning, and navigation software package. The acquisition software combines the data streams from the various components into a single raw data file, with each device string referenced by a device identification code and timestamp to the nearest millisecond. The software also manages the planned-transect information, providing real-time navigation, steering, correction, data quality, and instrumentation-status information to the boat operator. Quality control Vertical and horizontal positioning and resolution SANDS can function in water depths between 0.25 and 100 m and resolve bottom features ranging from 0.02 m to 0.03 m in height. The E-Sea-103 fathometer uses a filtering algorithm that compares successive bottom echoes to maintain accurate track of the seafloor, reducing interference from artifacts in the water column. Depth measurements from SANDS are relative to an Earth-centered ellipsoid, eliminating errors associated with water surface elevation or tidally based bathymetric systems. The final water depth values are in elevations relative to the North American Vertical Datum of 1988 (NAVD 88) so as to provide elevations relative to a known datum. Planned crossing lines are surveyed as a quality control measure and serve as a check in the postprocessing steps of SANDS. Similar (within 10 cm) position measurements where survey lines cross are useful indications of measurement accuracy (assuming no change in seafloor depth), since lines surveyed at different times of the day are supported by GPS information from different satellites within the NAVSTAR constellation. In theory, the values at a crossing point should be exact; any deviation helps isolate incorrect values. Several external factors including GPS cycle slips, weather, and extreme surface conditions can contribute to incorrect values. All horizontal positioning is referenced to Universal Transverse Mercator (UTM) Zone 17, North American Datum of 1983 (NAD 83). The horizontal accuracy of the postprocessed GPS signal from these benchmarks ranges from 0.01 m to 0.03 m. SANDS uses the National Oceanic and Atmospheric Association / National Geodetic Survey (NOAA/NGS) GEOID03 software to reference the data to NAD 83. Sound velocity For shallow water surveys, the high sound velocity to depth ratio, coupled with the high likelihood of water mixing, tends to decrease the significance of sound velocity variations caused by salinity and temperature gradients in the water column. For these reasons, the use of an average sound velocity is suitable within the depth range of the survey. A fixed “bar check” is an accepted method used to correct for sound velocity variations and index errors in the fathometer. An aluminum pipe with a top plate is suspended 1.0 m below the transducer. This known distance is compared to the distance determined by the sounding system, using an assumed average sound velocity of 1,500 m/s. This check is conducted on a daily basis, and any deviation between the depth of the reference bar and the measured depths is used to correct subsequent recorded soundings for that day during postprocessing. In shallow water operations, depth deviations are usually minimal in proportion to sound velocity and the short distance of signal travel. GPS The GPS antenna receives position information from the NAVSTAR satellite constellation, which includes the Percent Dilution of Position (PDOP). PDOP is a measurement of the relative signal strength of the GPS satellite configuration, measured internally by the GPS system and displayed as a value typically between 1 and 4. The PDOP is a proxy for position error, the lower the value the higher the accuracy. When PDOP readings exceed a value of 3, operations are halted, or data were removed from the data set during post processing. |
|||||

![]() U.S. Department of the Interior |
U.S. Geological Survey
U.S. Department of the Interior |
U.S. Geological Survey
URL: pubsdata.usgs.gov/pubs/ds/291/html/equipment_processing.html
Page Contact Information: Publishing Services
Page Last Modified: Monday, 28-Nov-2016 12:47:44 EST