Data Series 566
![]()
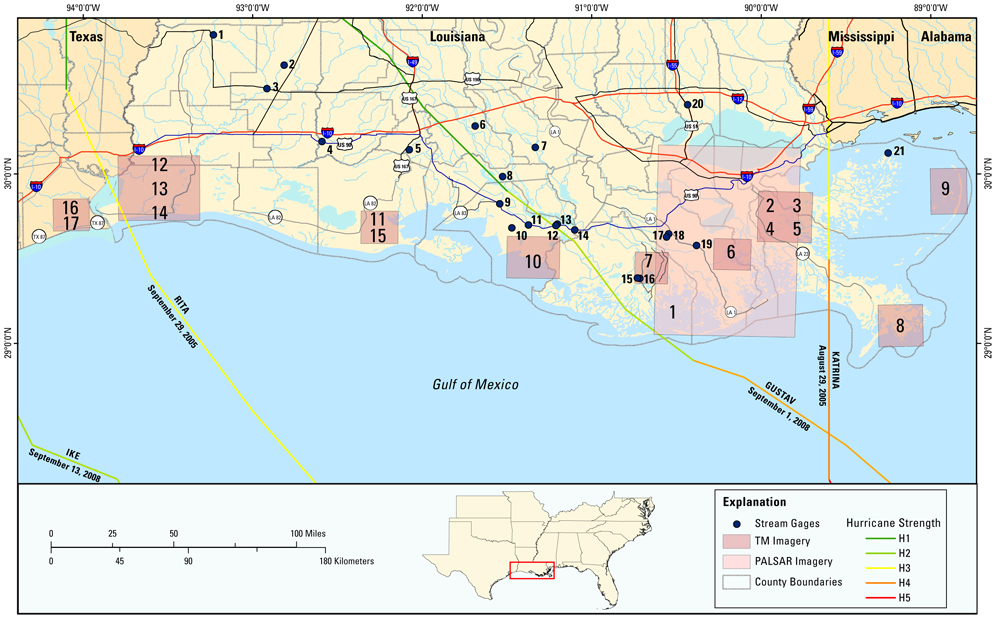
| Before and after imagery | List of streamgages by name and USGS number | |
|---|---|---|
| 1. Southeastern Lousiana-PALSAR (750 KB jpeg) PDF (20 MB) |
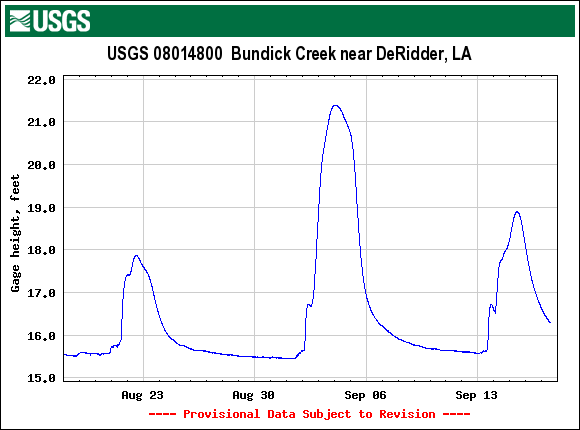
1. Bundick Creek-DeRidder USGS_08014800 |
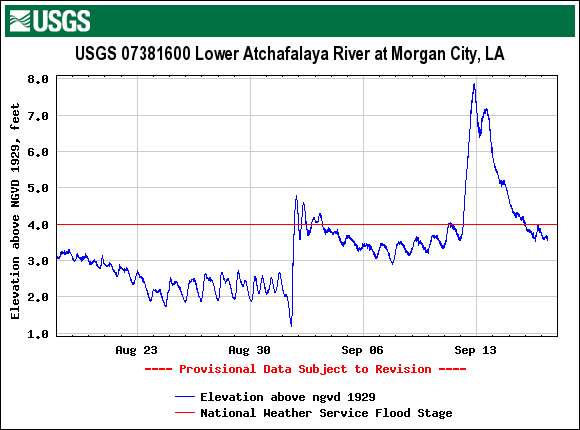
12. Lower Atchafalaya-Morgan City USGS_07381600 |
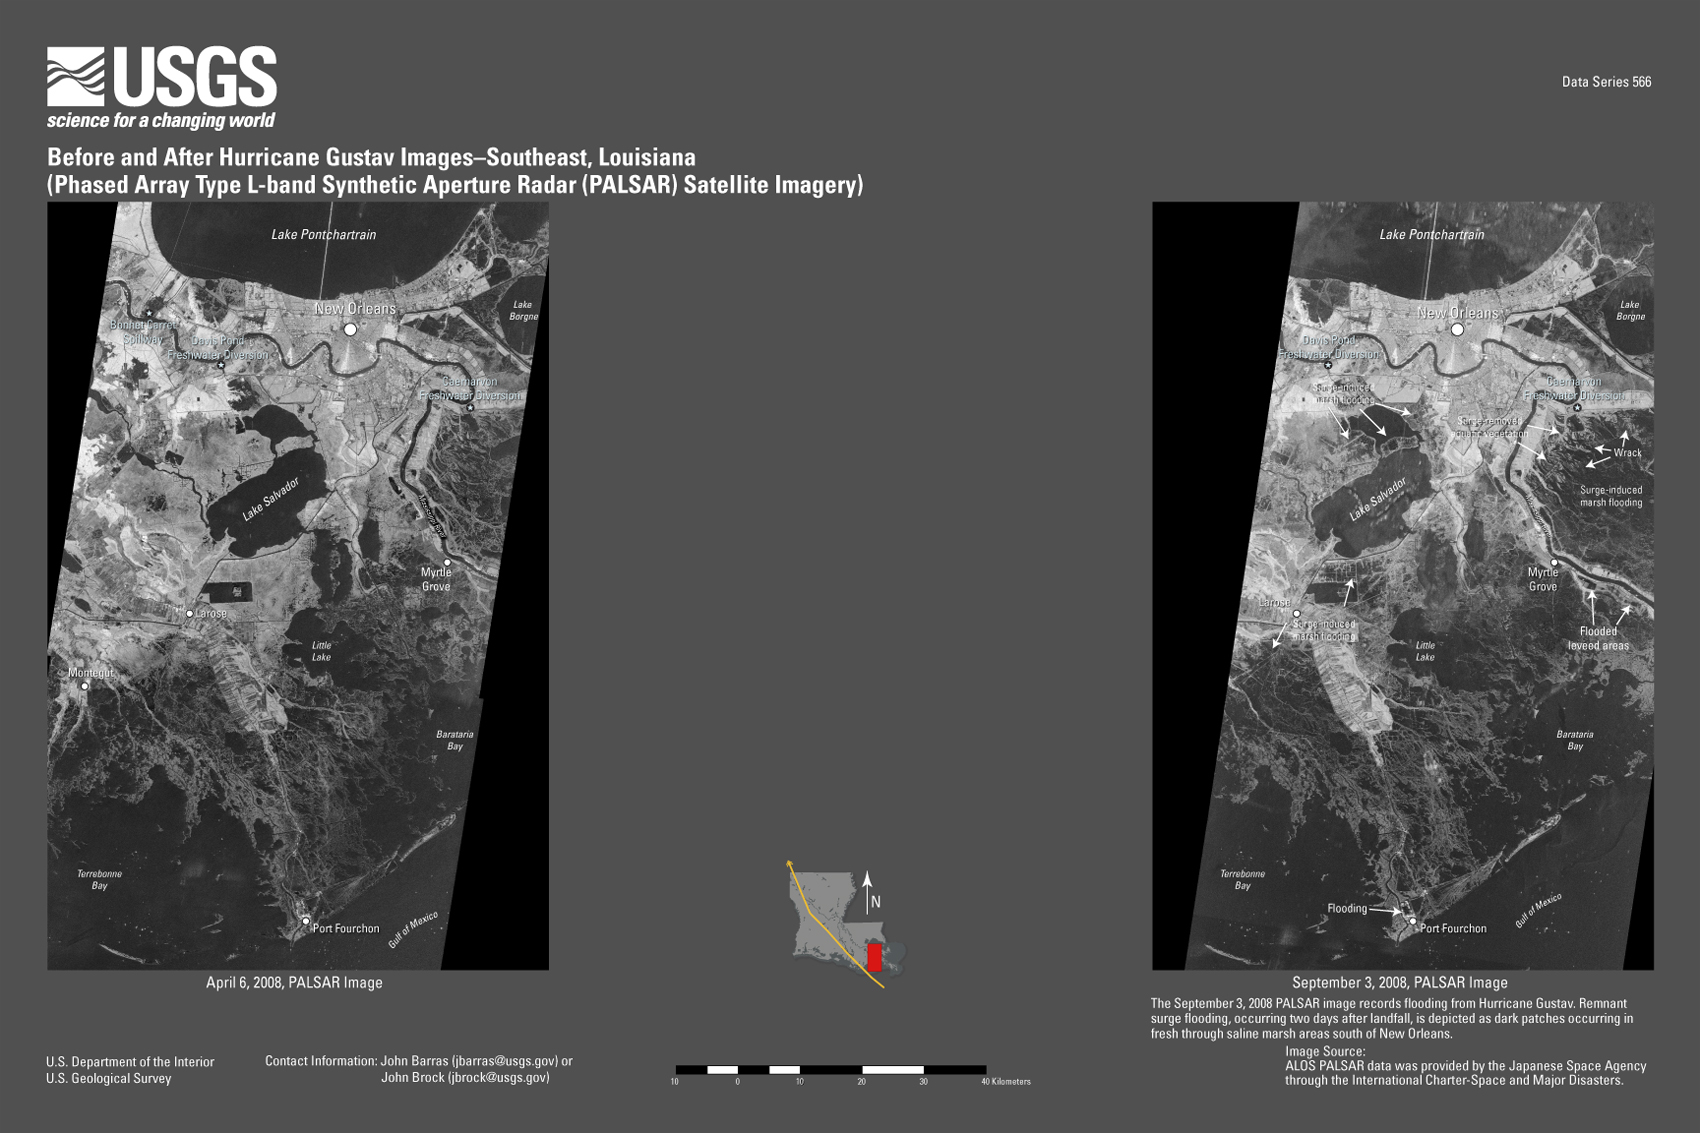
| 2. Delacroix-Gustav (450 KB jpeg) PDF (2.9 MB) |
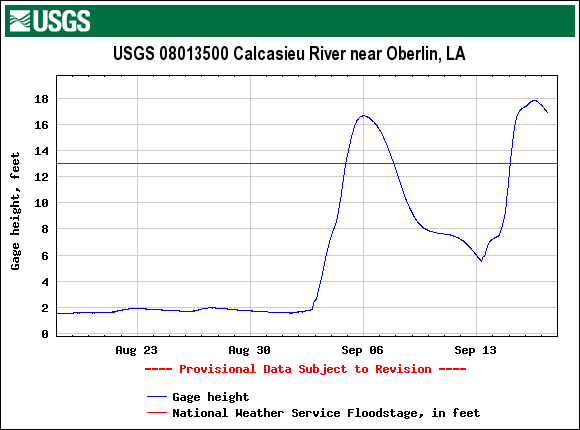
2. Calcasieu-Oberlin USGS_08013500 |
13. ACOE-Lower Atchafalaya-Morgan City No image available |
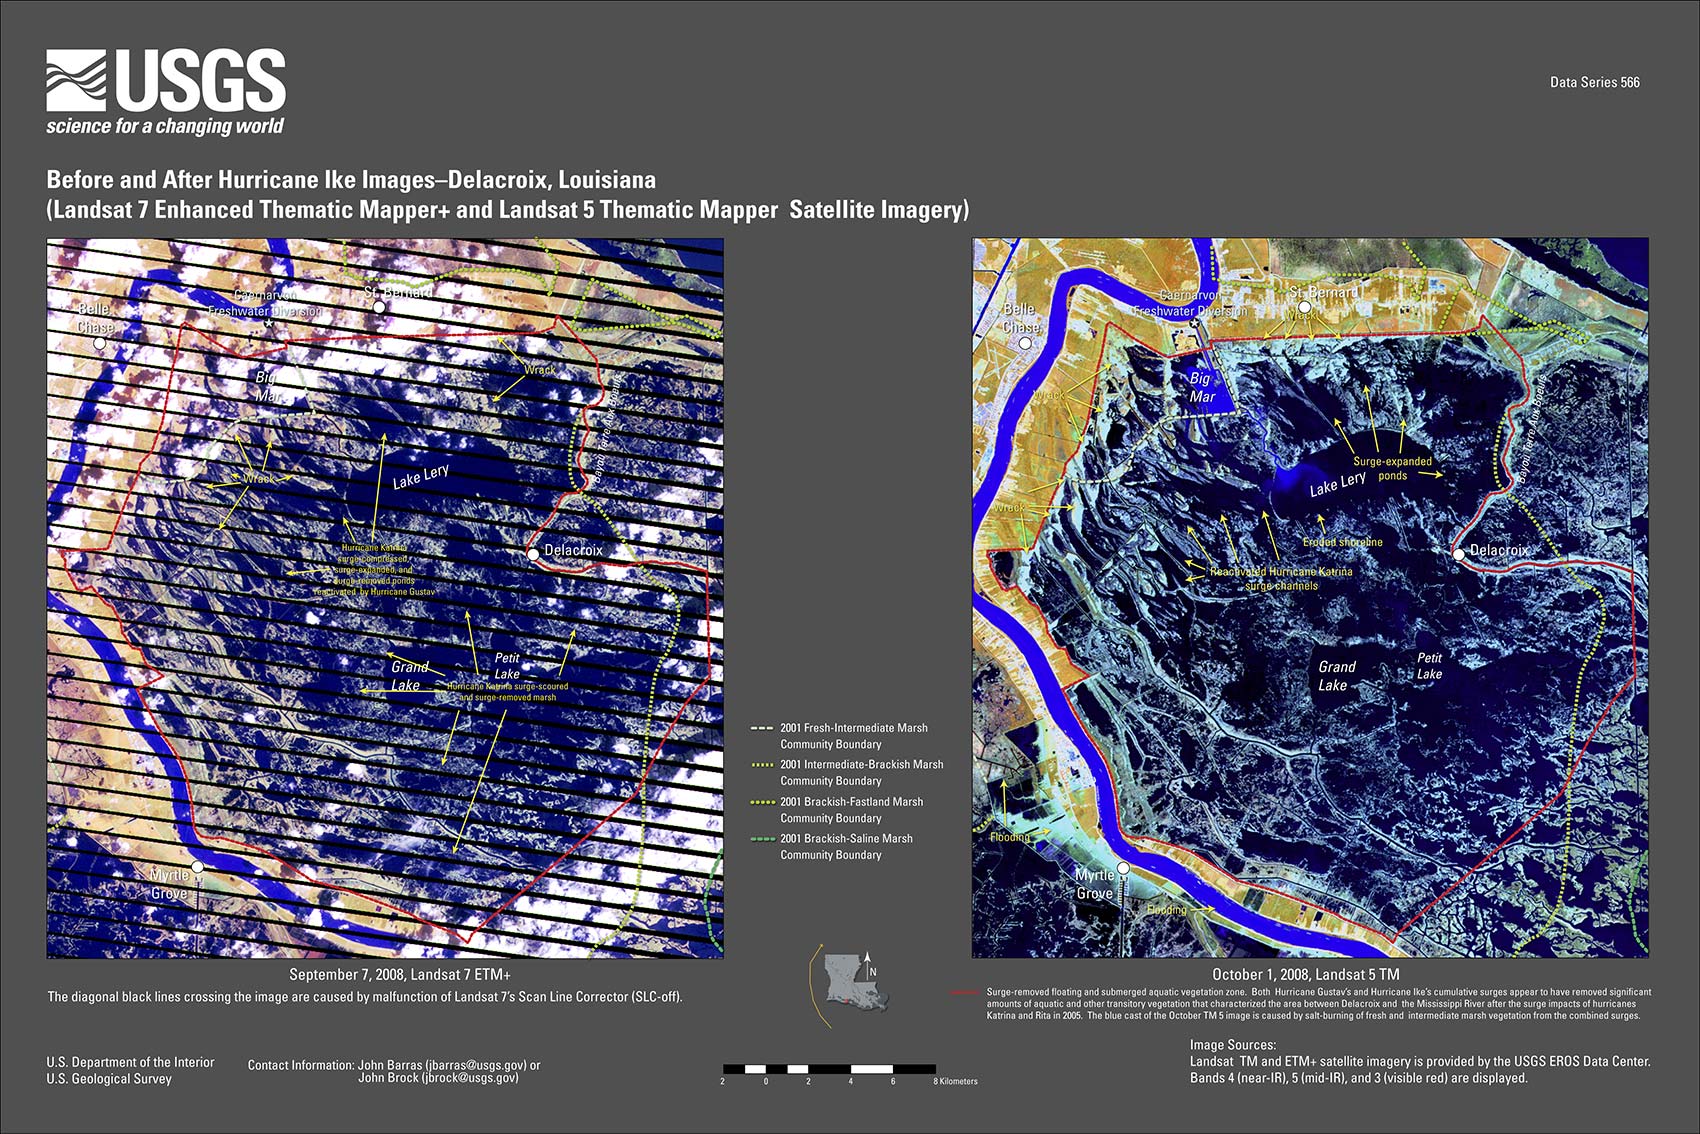
| 3. Delacroix-Ike (440 KB jpeg) PDF (3.5 MB) |
3. Calcasieu-Kinder USGS_08015500 |
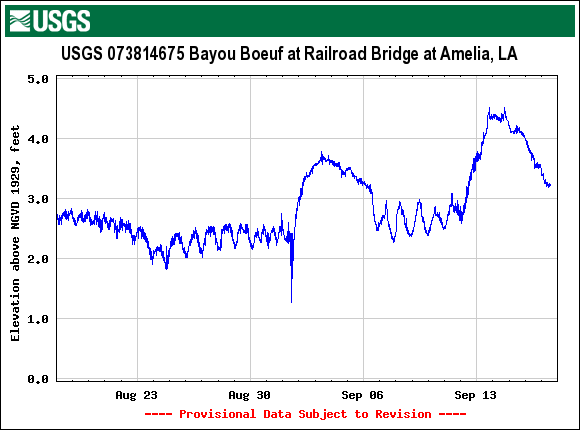
14. Bayou Boeuf RR Bridge-Amelia USGS_073814675 |
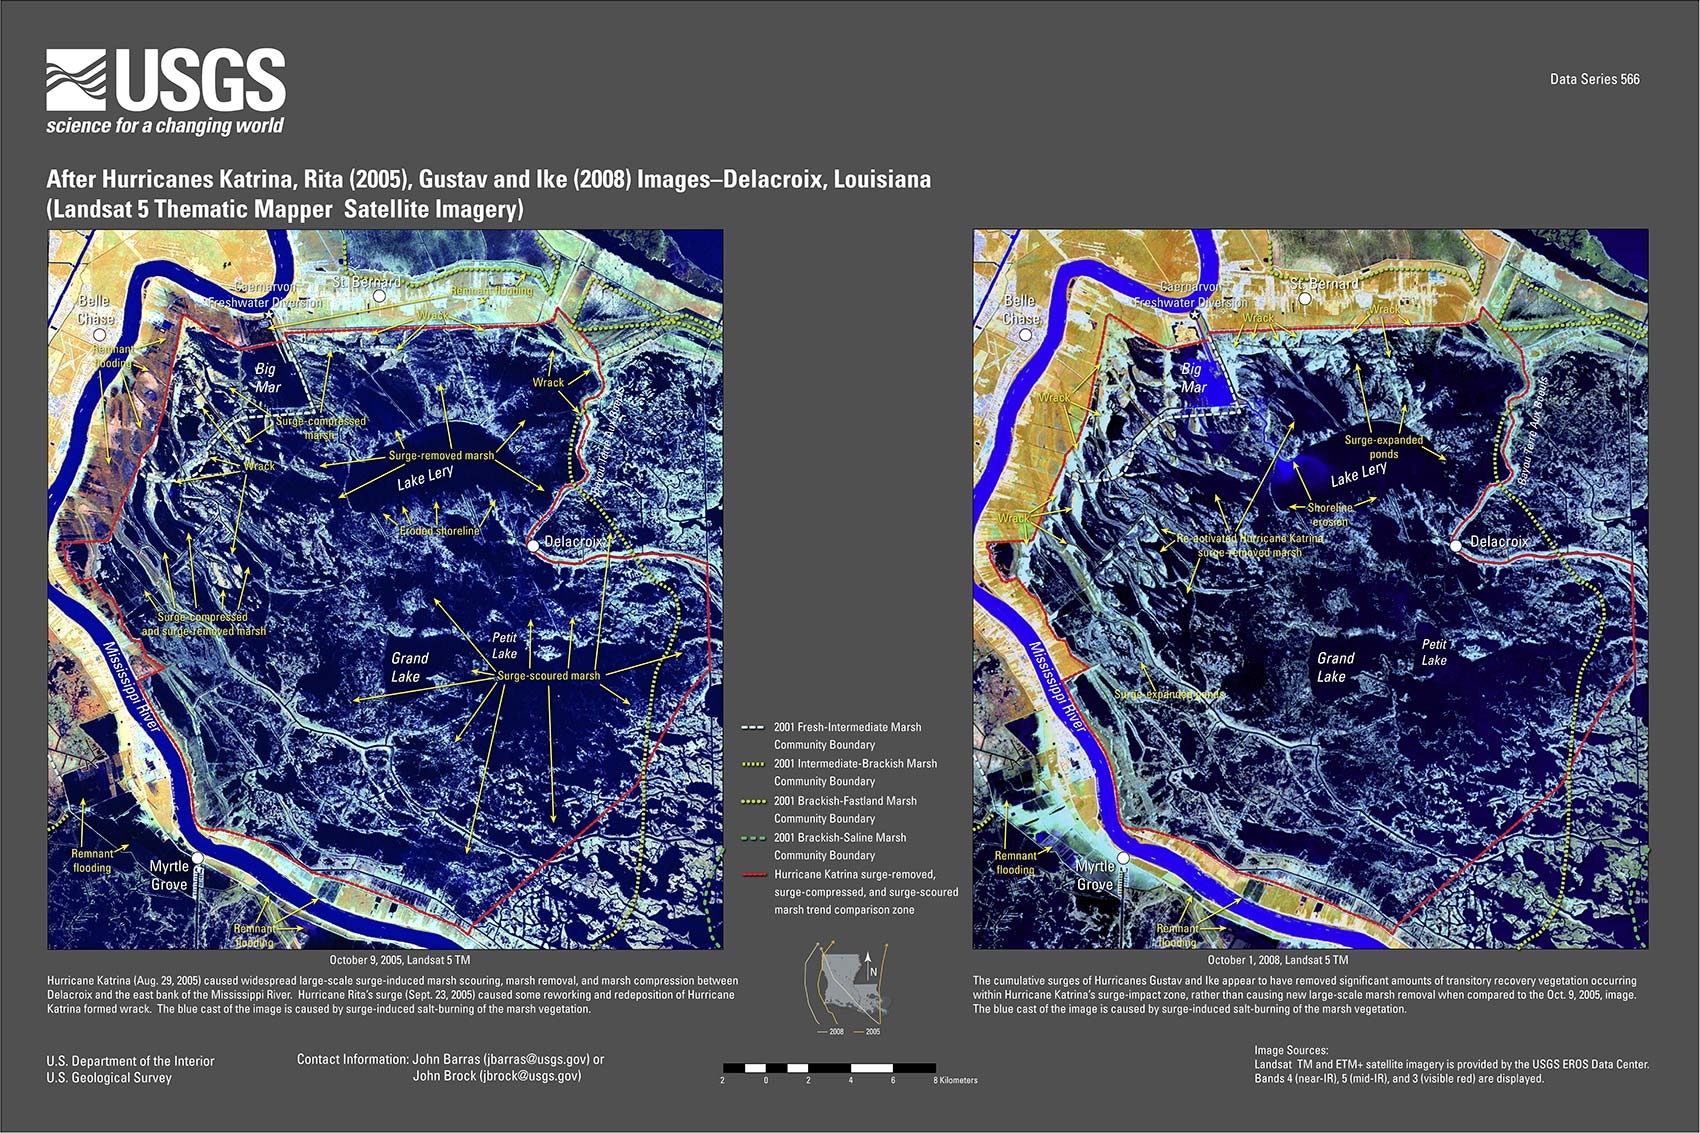
| 4. Delcroix-Katrina, Rita, Gustav and Ike (450 KB jpeg)
PDF (3.2 MB) |
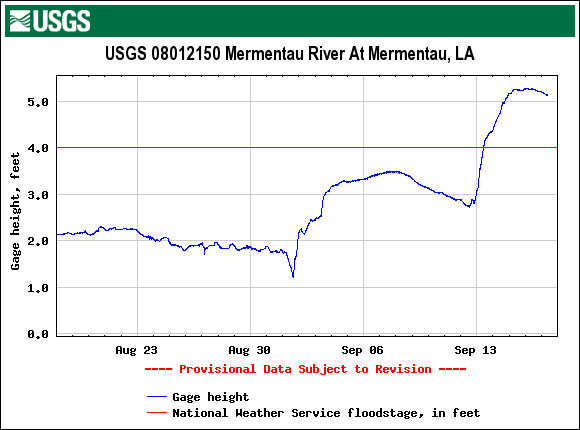
4. Mermentau River-Mermentau USGS_08012150 |
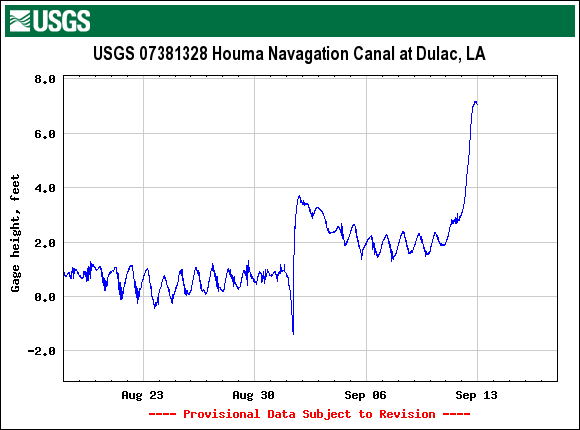
15. Houma Navigation Canal-Dulac USGS_07381328 |
| 5. Delacroix Trends 1956-2008 (360 KB jpeg)
PDF (2.3 MB) |
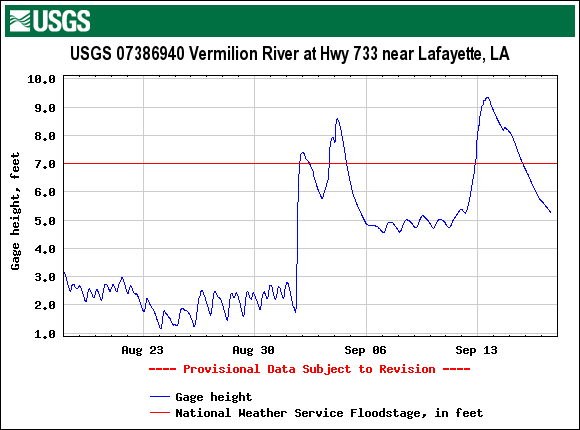
5. Vermillion River-Lafayette USGS_07386940 |
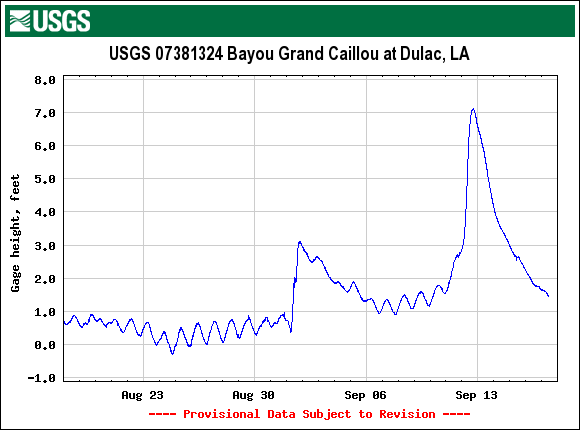
16. Bayou Grand Cailou-Dulac USGS_07381324 |
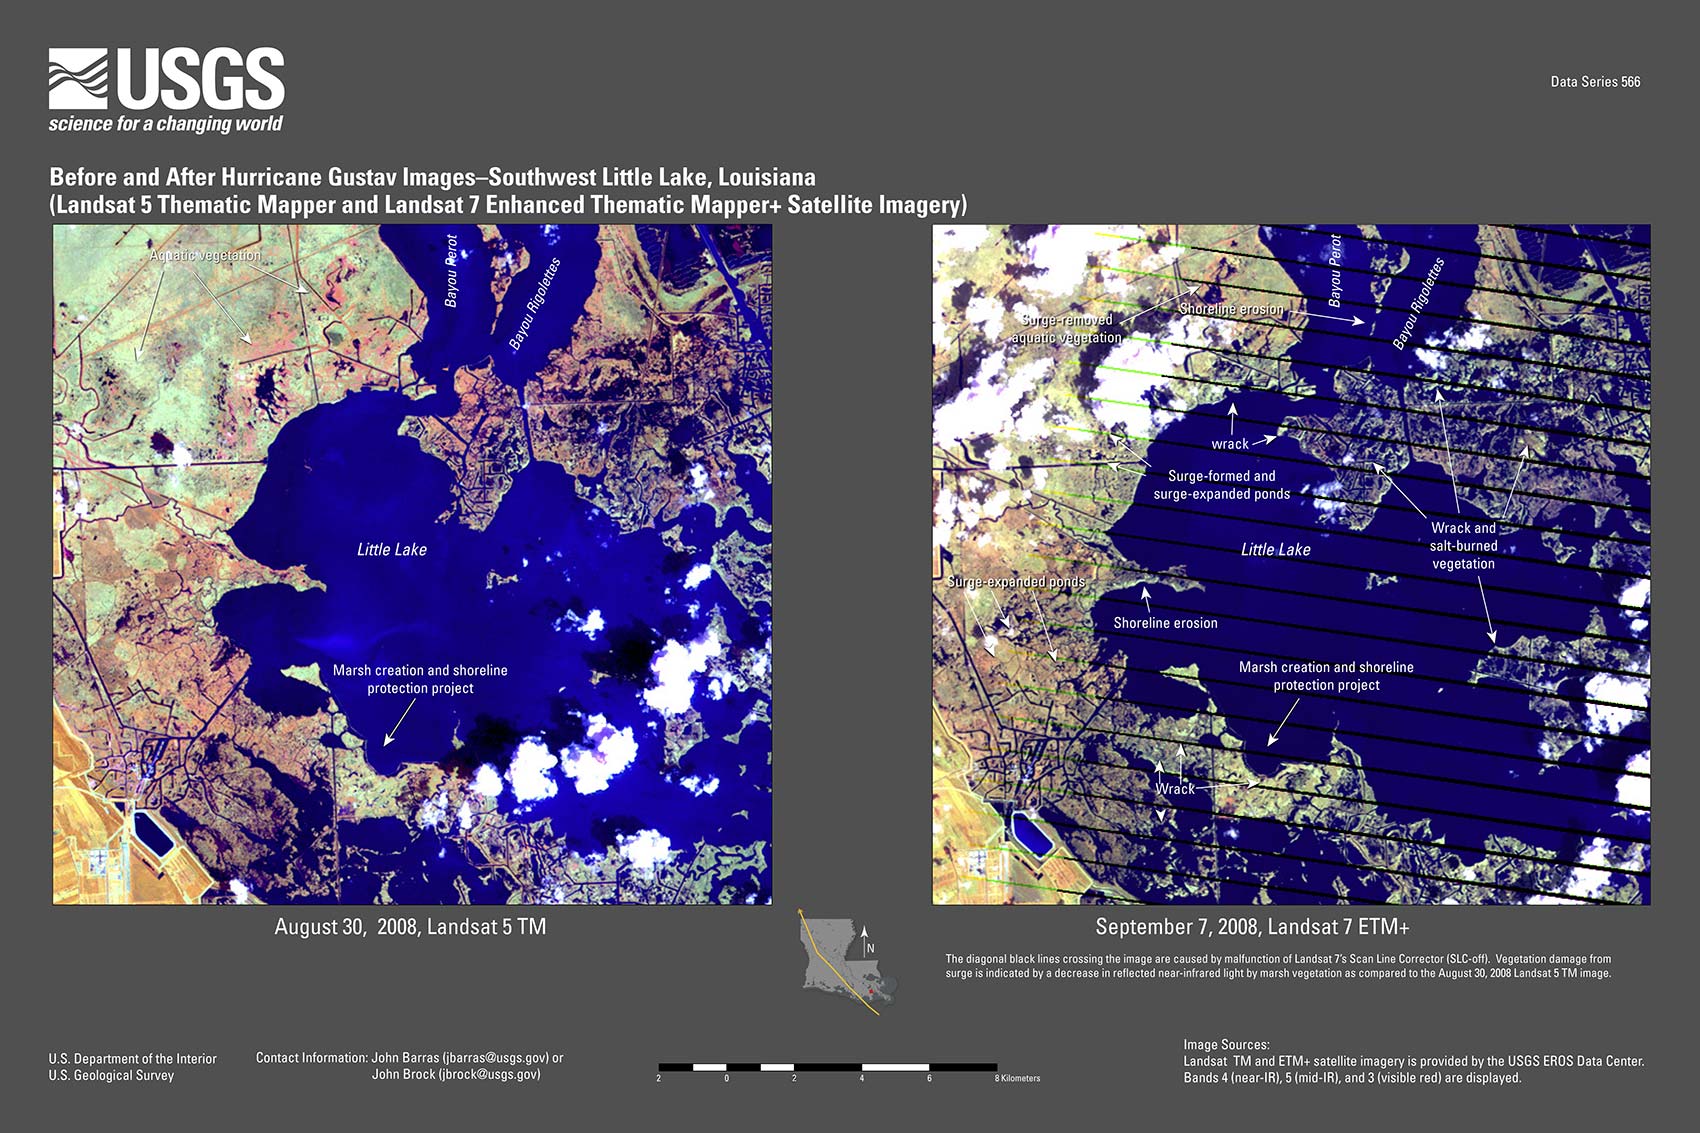
| 6. Southwest Little Lake-Gustav(315 KB jpeg)
PDF (1.8 MB) |
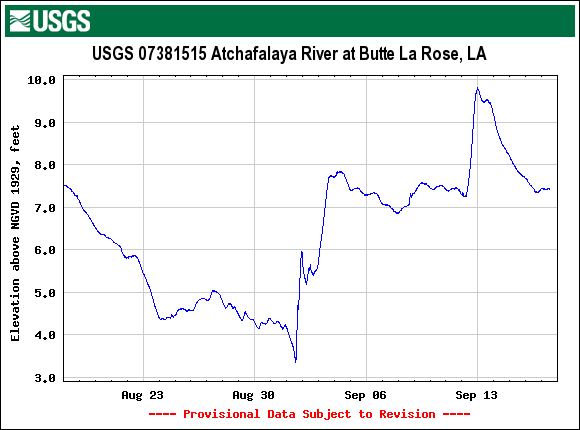
6. Atchafalaya River-Butte LaRose USGS_07381515 |
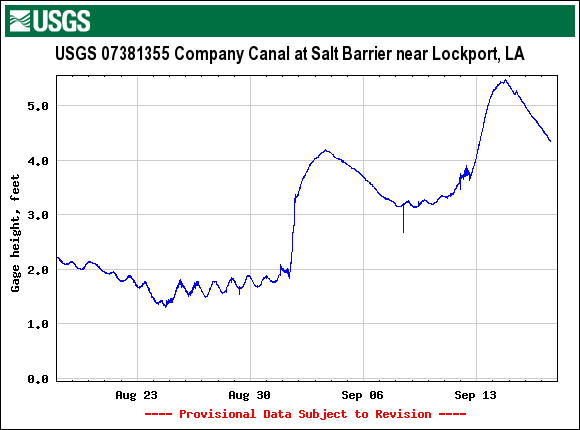
17. Company Canal Salt Bar-Lockport USGS_07381355 |
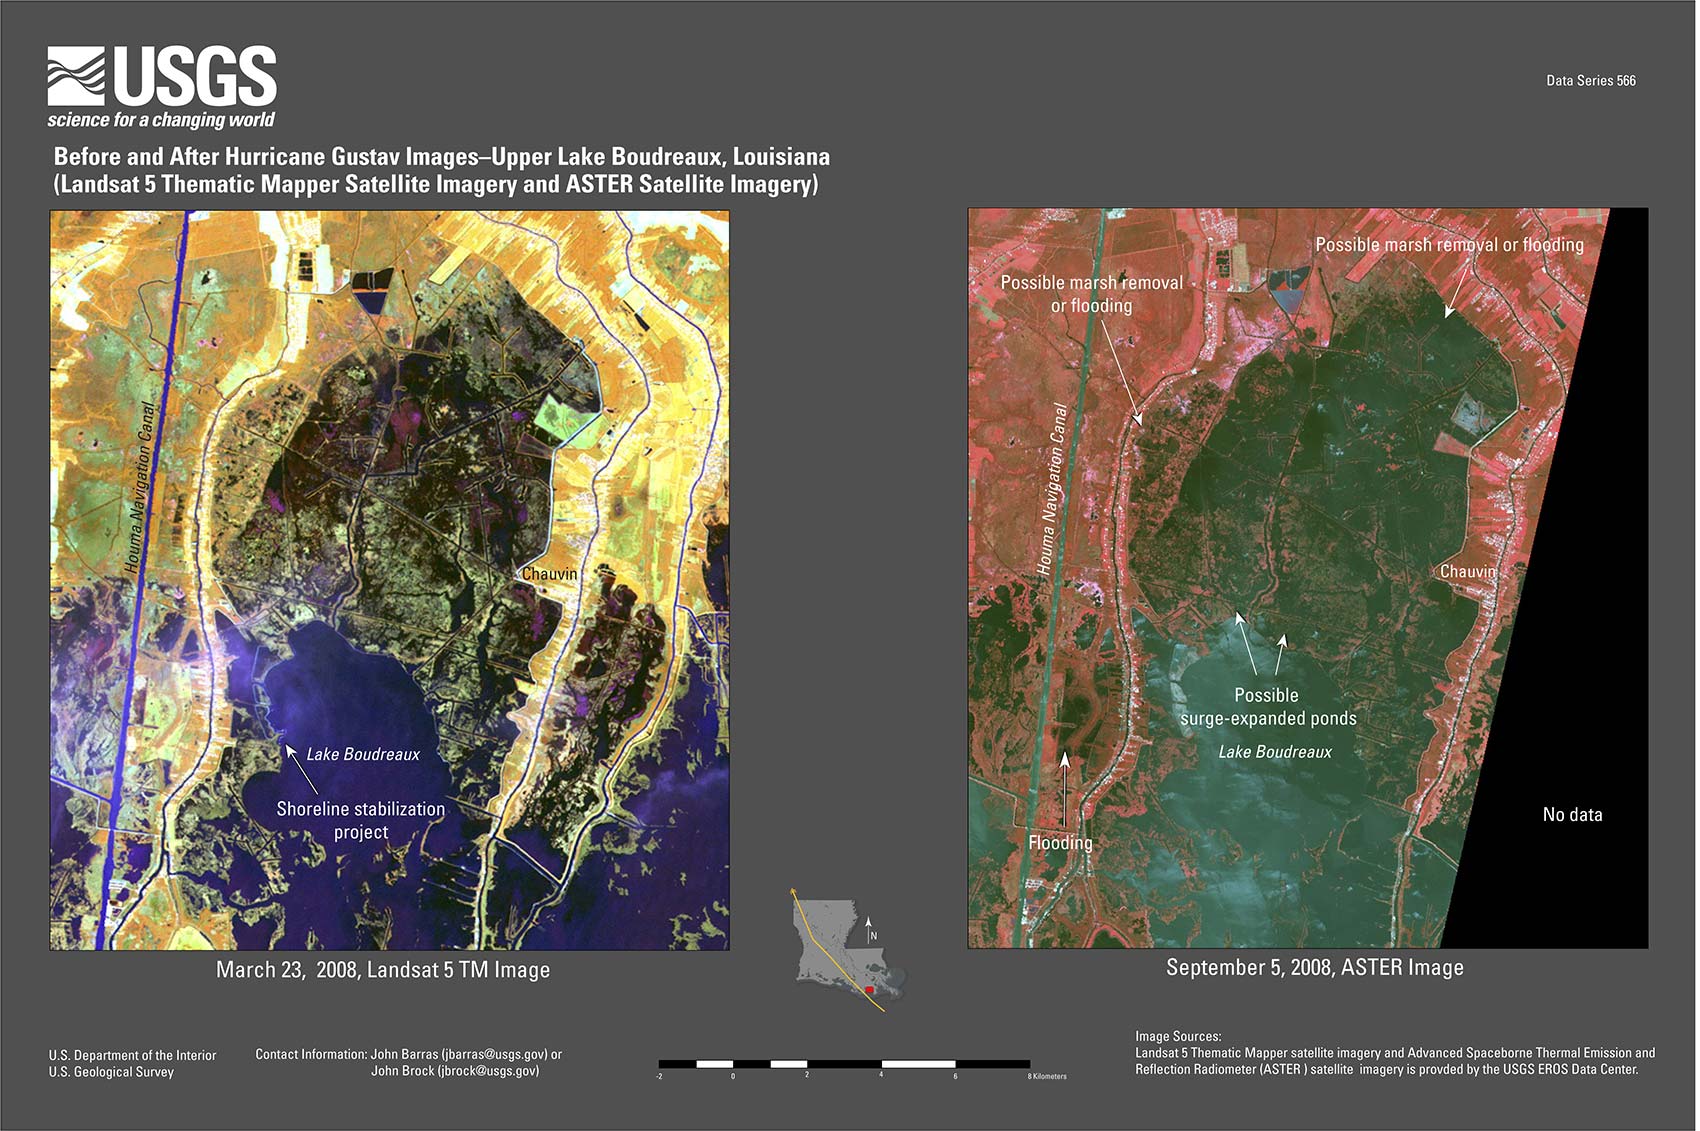
| 7. Upper Lake Boudreaux-Gustav (275 KB jpeg)
PDF (1.8 MB) |
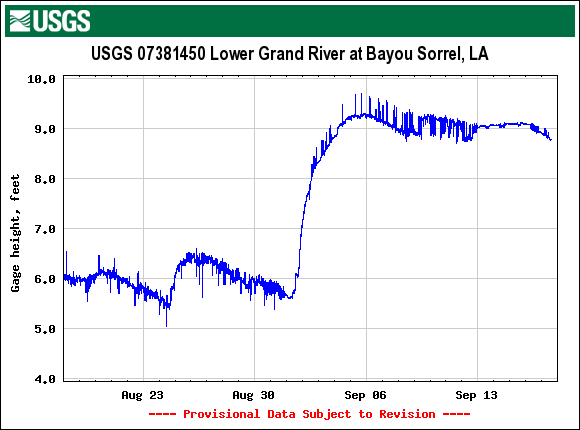
7. Lower Grand River-Bayou Sorrel USGS_07381450 |
18. Company Canal-Lockport USGS_07381350 |
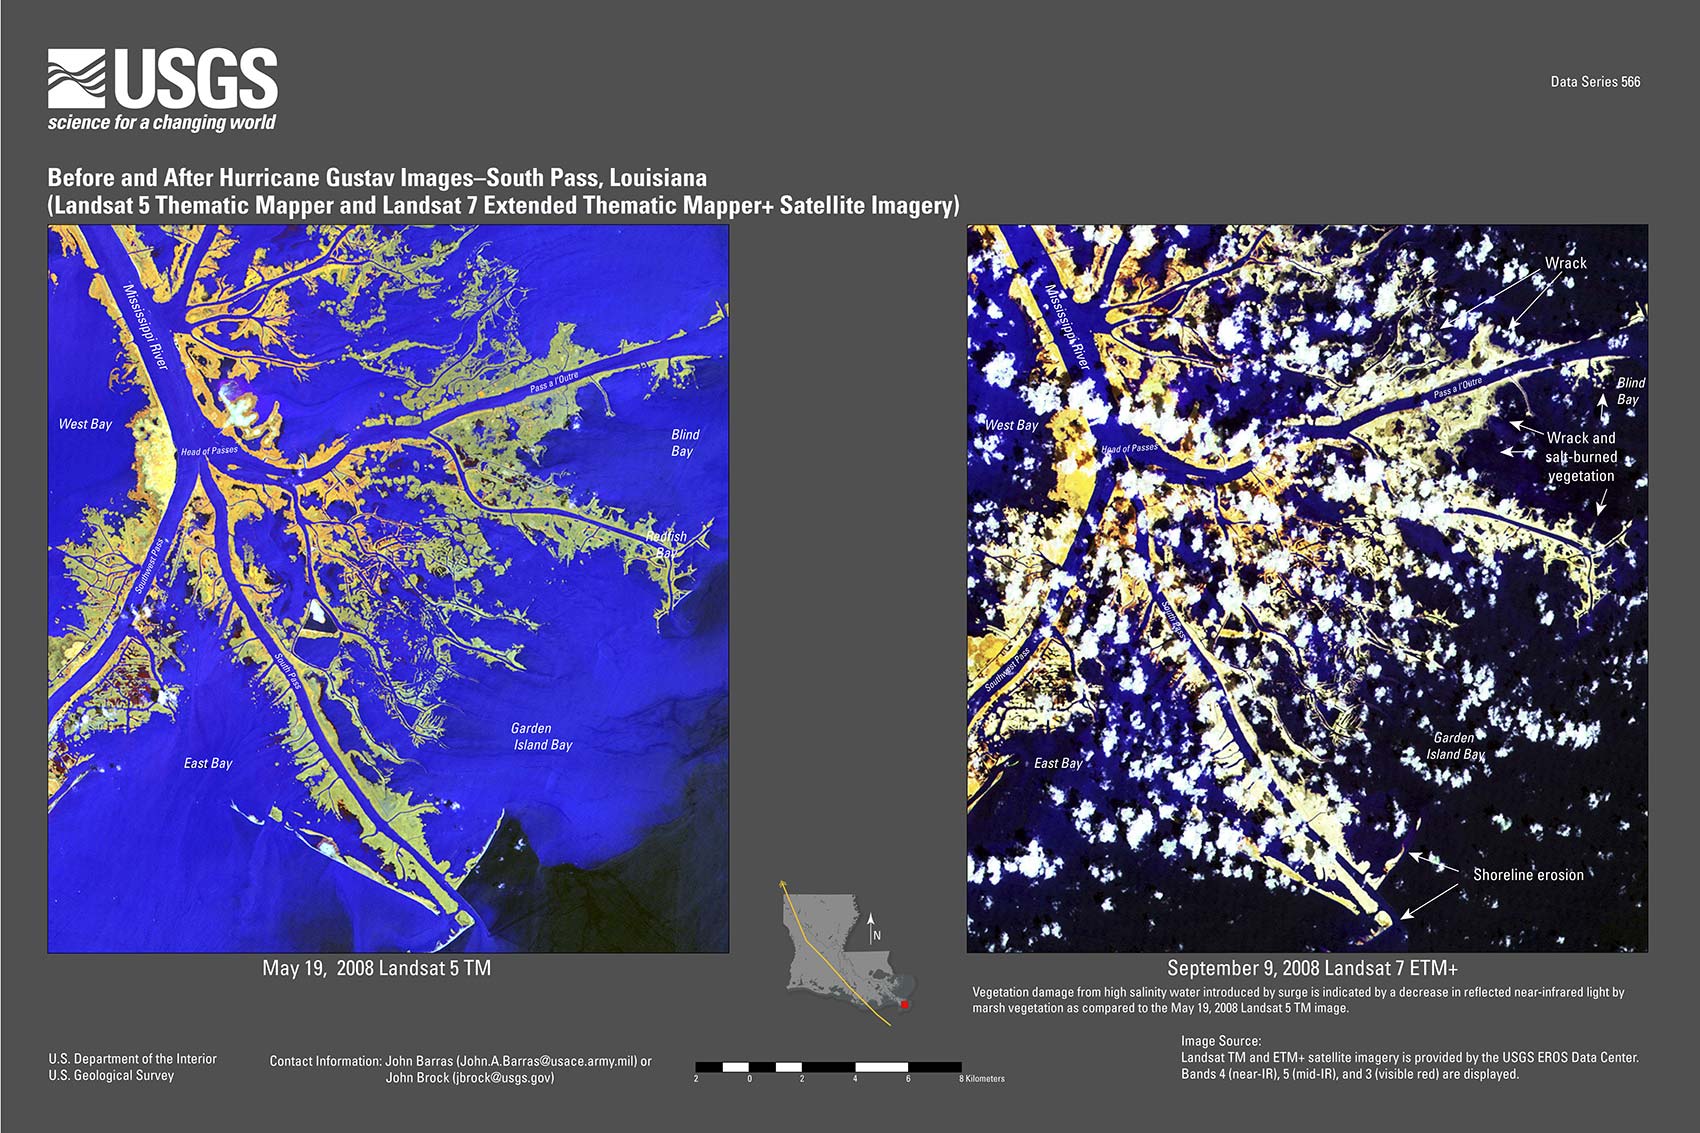
| 8. South Pass-Gustav (340 KB jpeg)
PDF (2.2 MB) |
8. Buffalo Cove-Round Isle-Charenton USGS_07381567 |
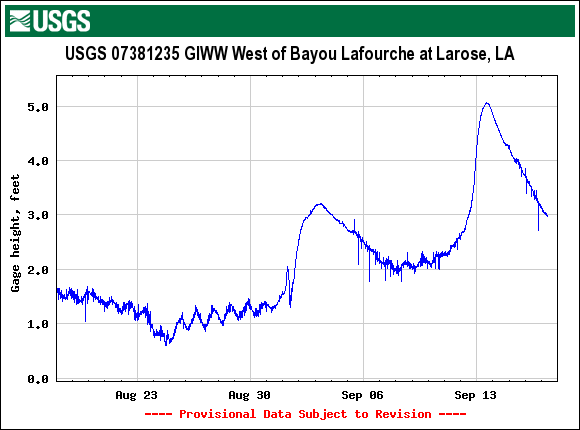
19. GIWW Bayou Lafourche-Larose USGS_07381235 |
| 9. Chandeleur Islands-Gustav (152 KB jpeg)
PDF (1.6 MB) |
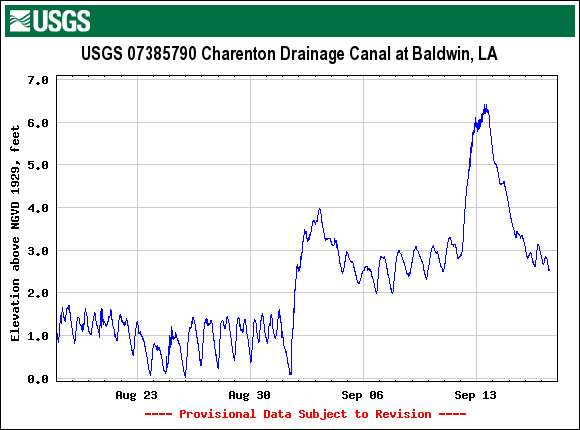
9. Charenton Canal-Baldwin USGS_07385790 |
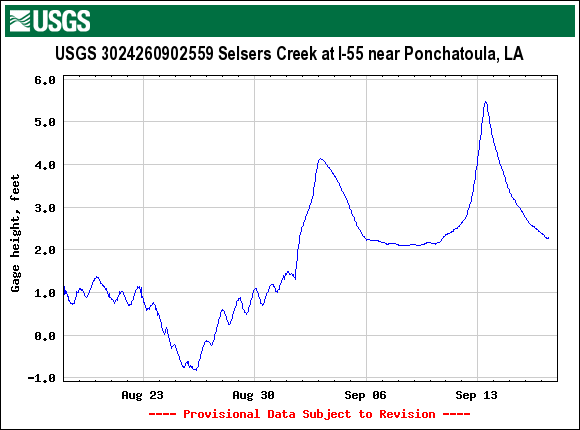
20. Selsers Creek-Ponchatoula USGS_3024260902559 |
| 10. Atchafalaya Delta-Ike (380 KB jpeg)
PDF (2.9 MB) |
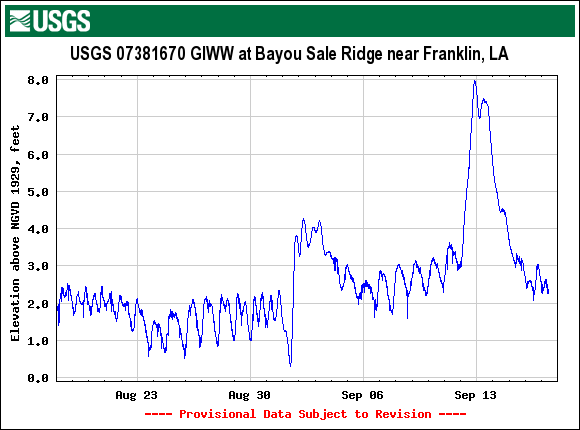
10. GIWW Bayou Sale Ridge-Franklin USGS_07381670 |
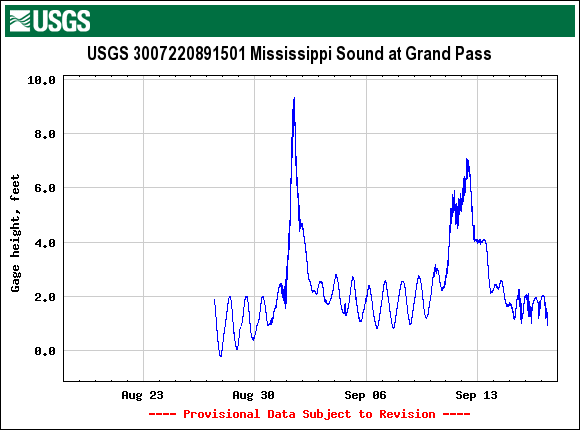
21. MS Sound- Grand Pass USGS_300722089151 |
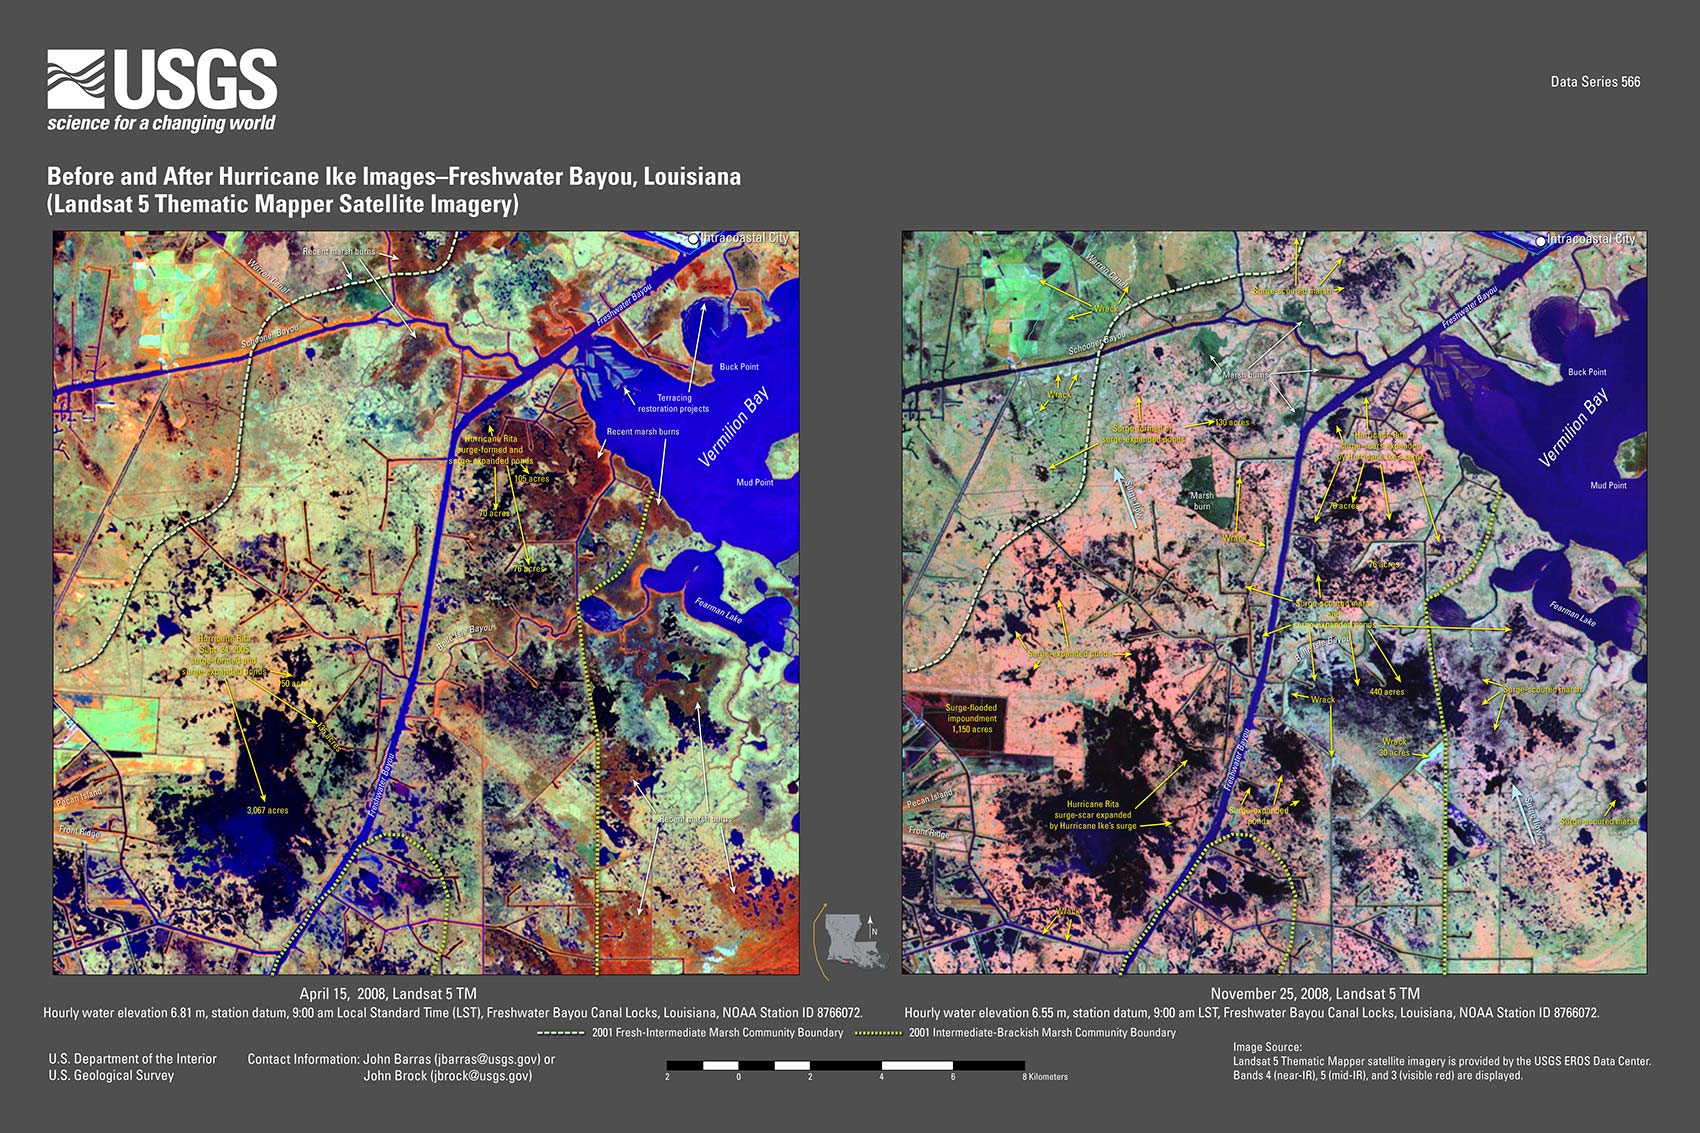
| 11. Freshwater Bayou-Ike (408 KB jpeg)
PDF (2.5 MB) |
11. Wax Lake Outlet-Calumet USGS_07381590 |
|
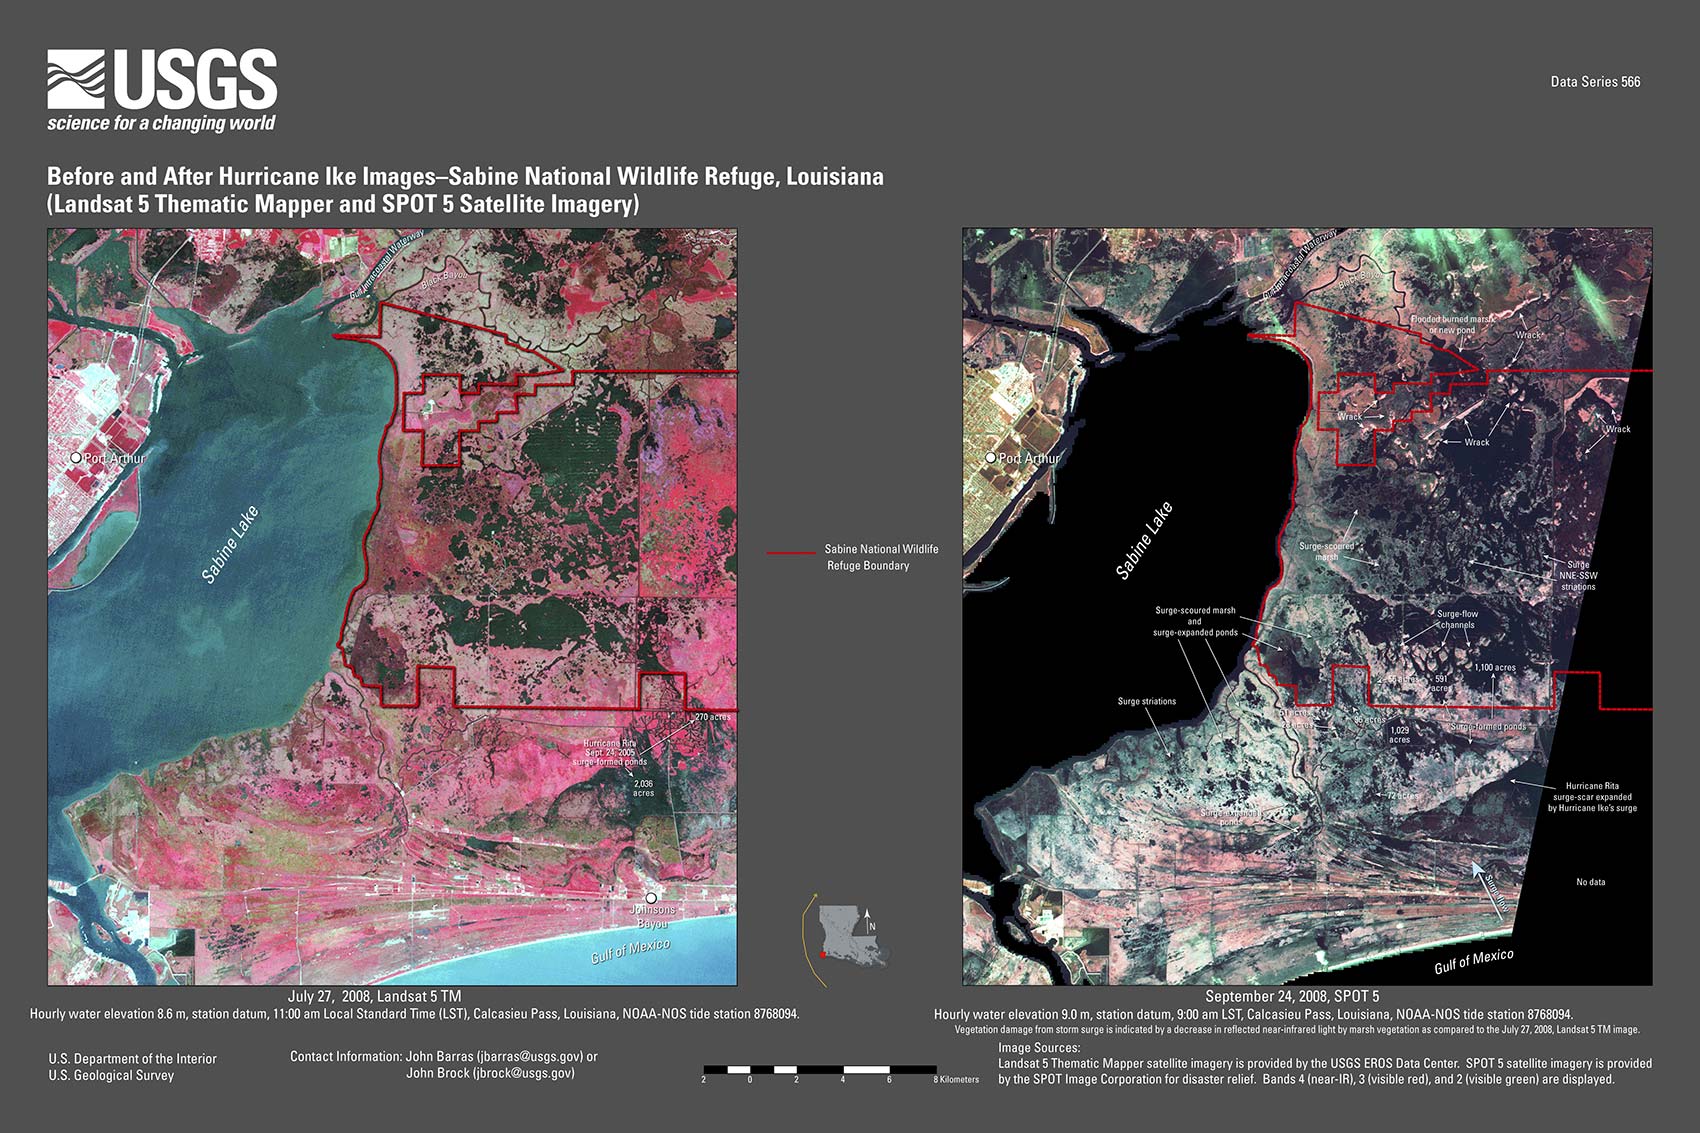
| 12. Sabine National Wildlife Refuge-Ike SPOT and TM5 (320 KB jpeg)
PDF (4.9 MB) |
||
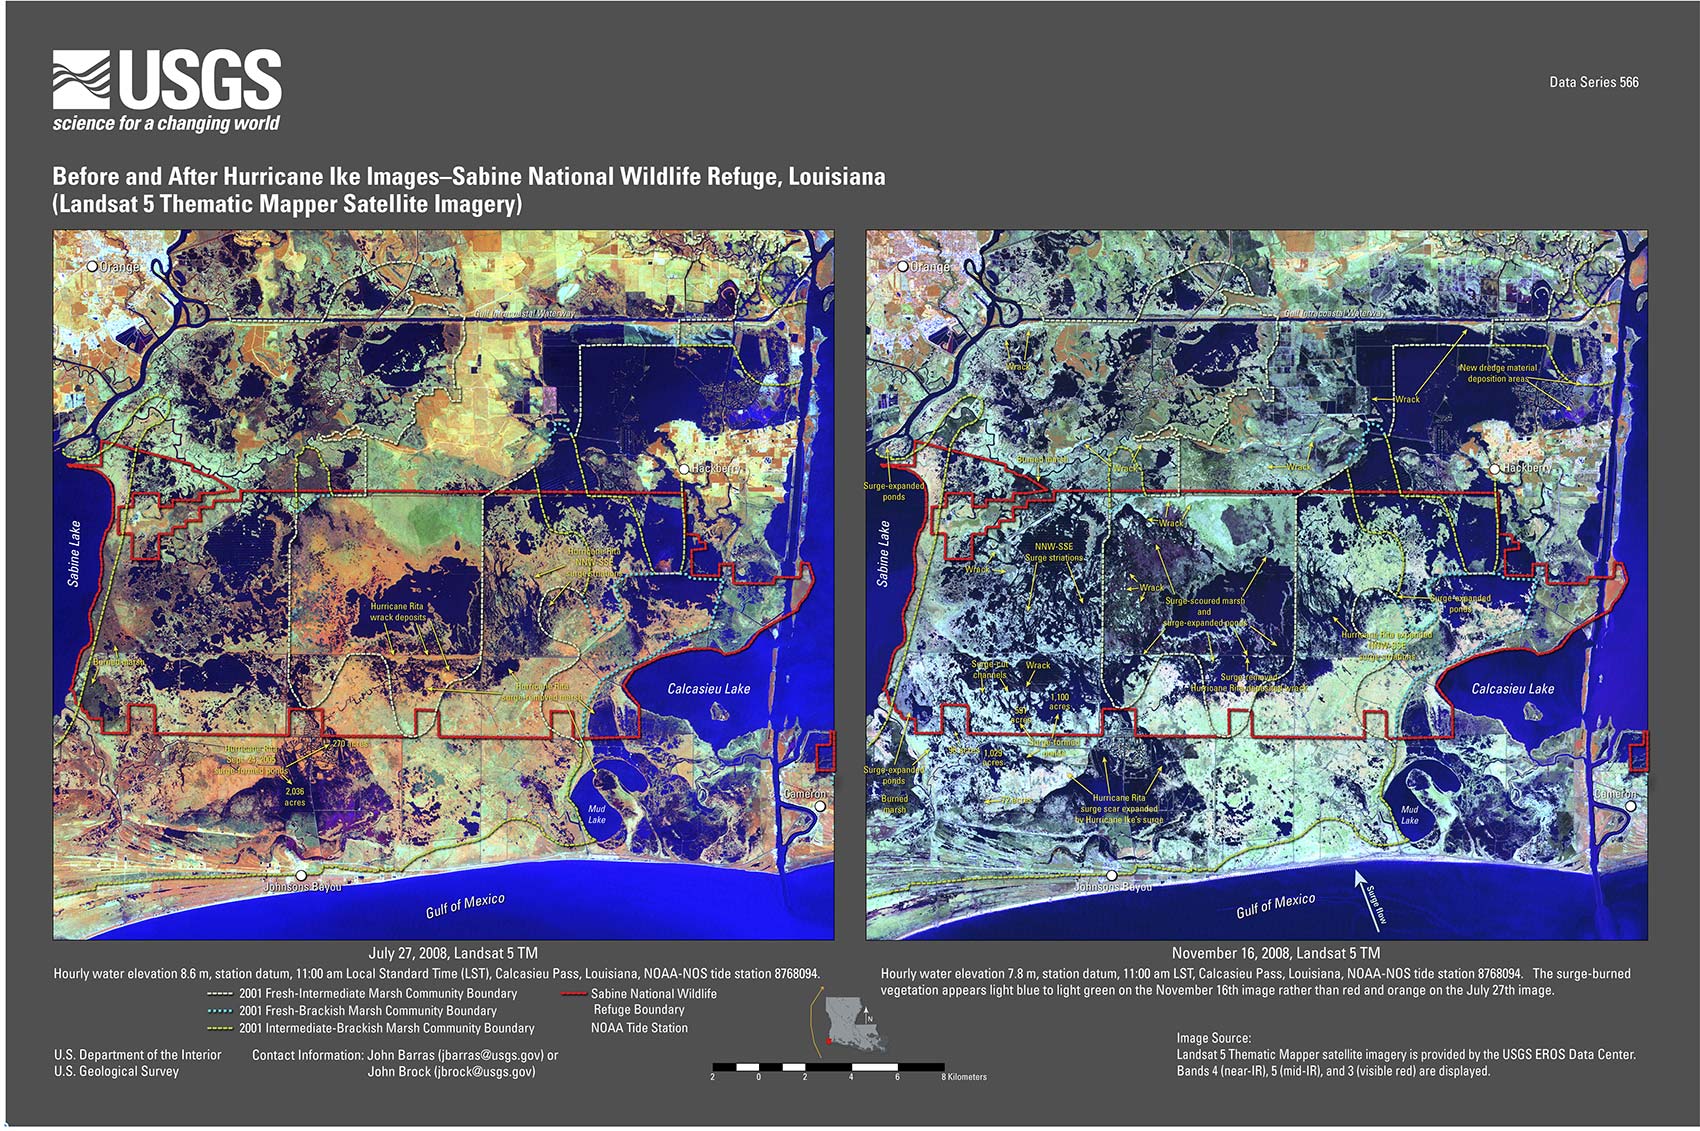
| 13. Sabine National Wildlife Refuge-Ike TM5 only (460 KB jpeg)
PDF (5.8 MB) |
||
| 14. Johnsons Bayou Trends 1956-2008 (280 KB jpeg)
PDF (2 MB) |
||
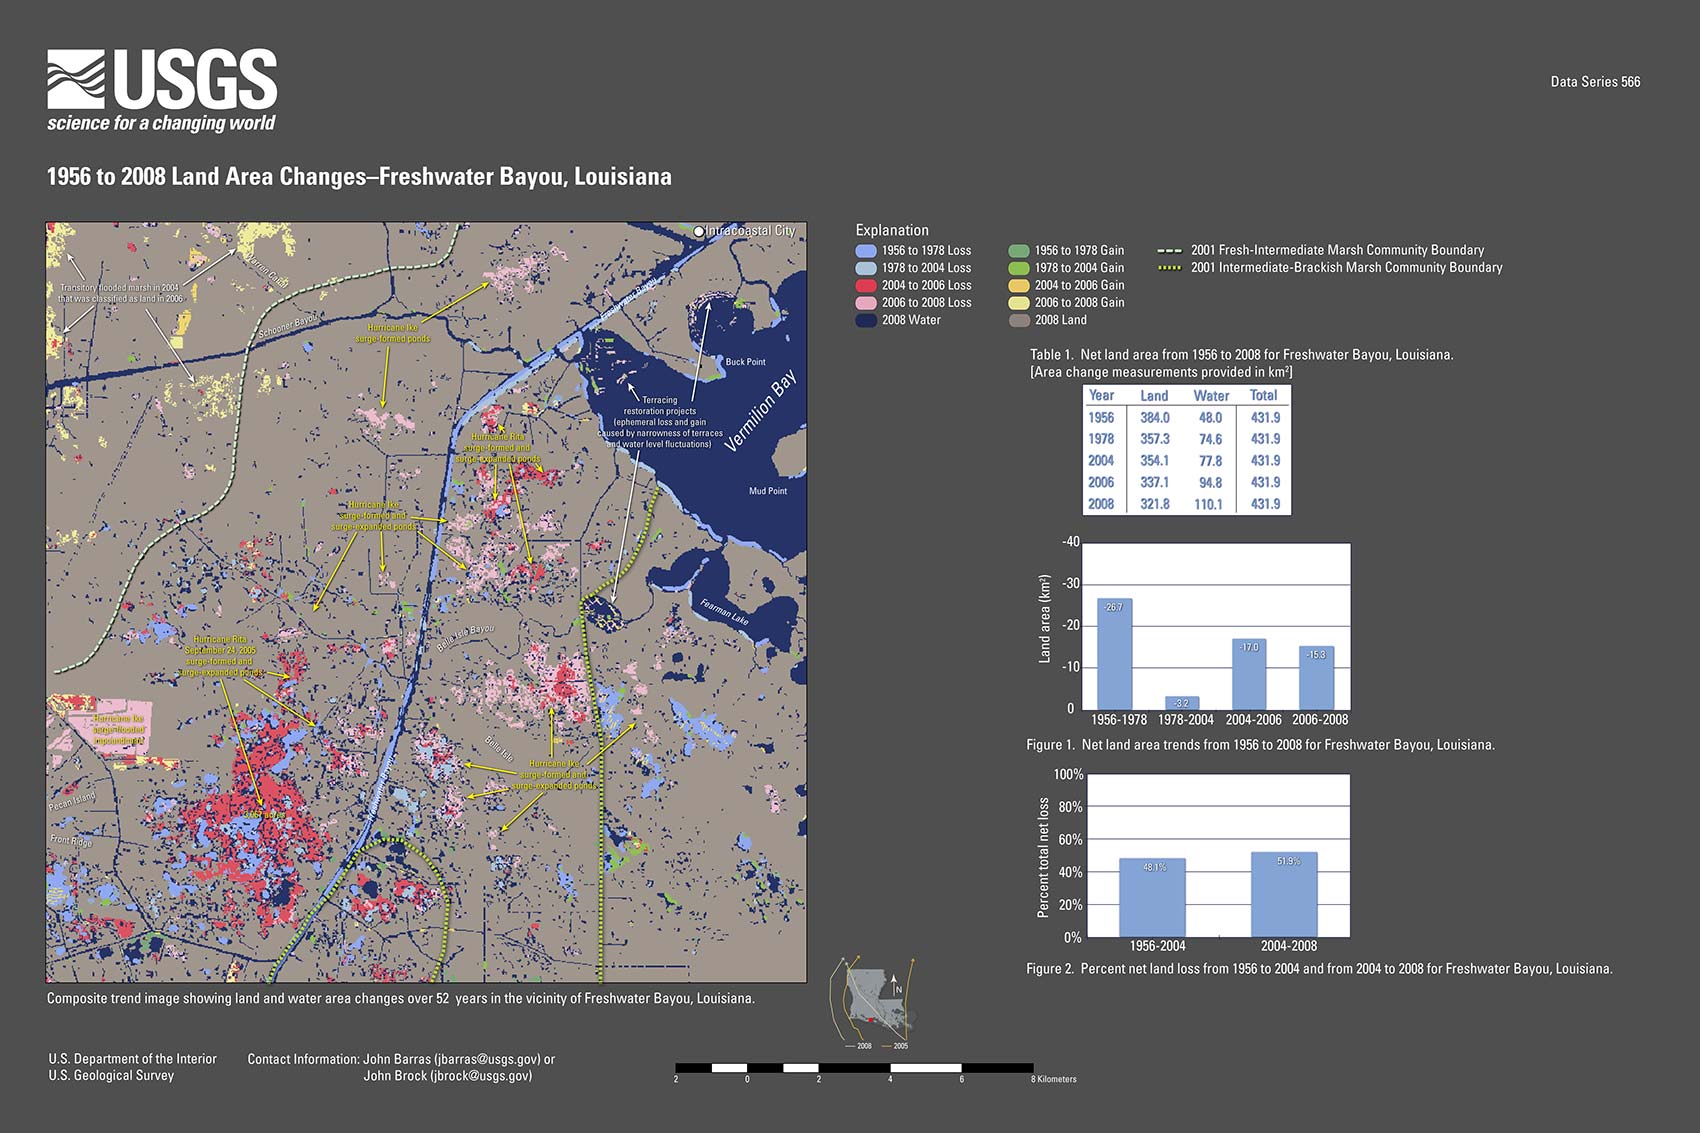
| 15. Freshwater Bayou Trends 1956-2008 (230 KB jpeg)
PDF (1.7 MB) |
||
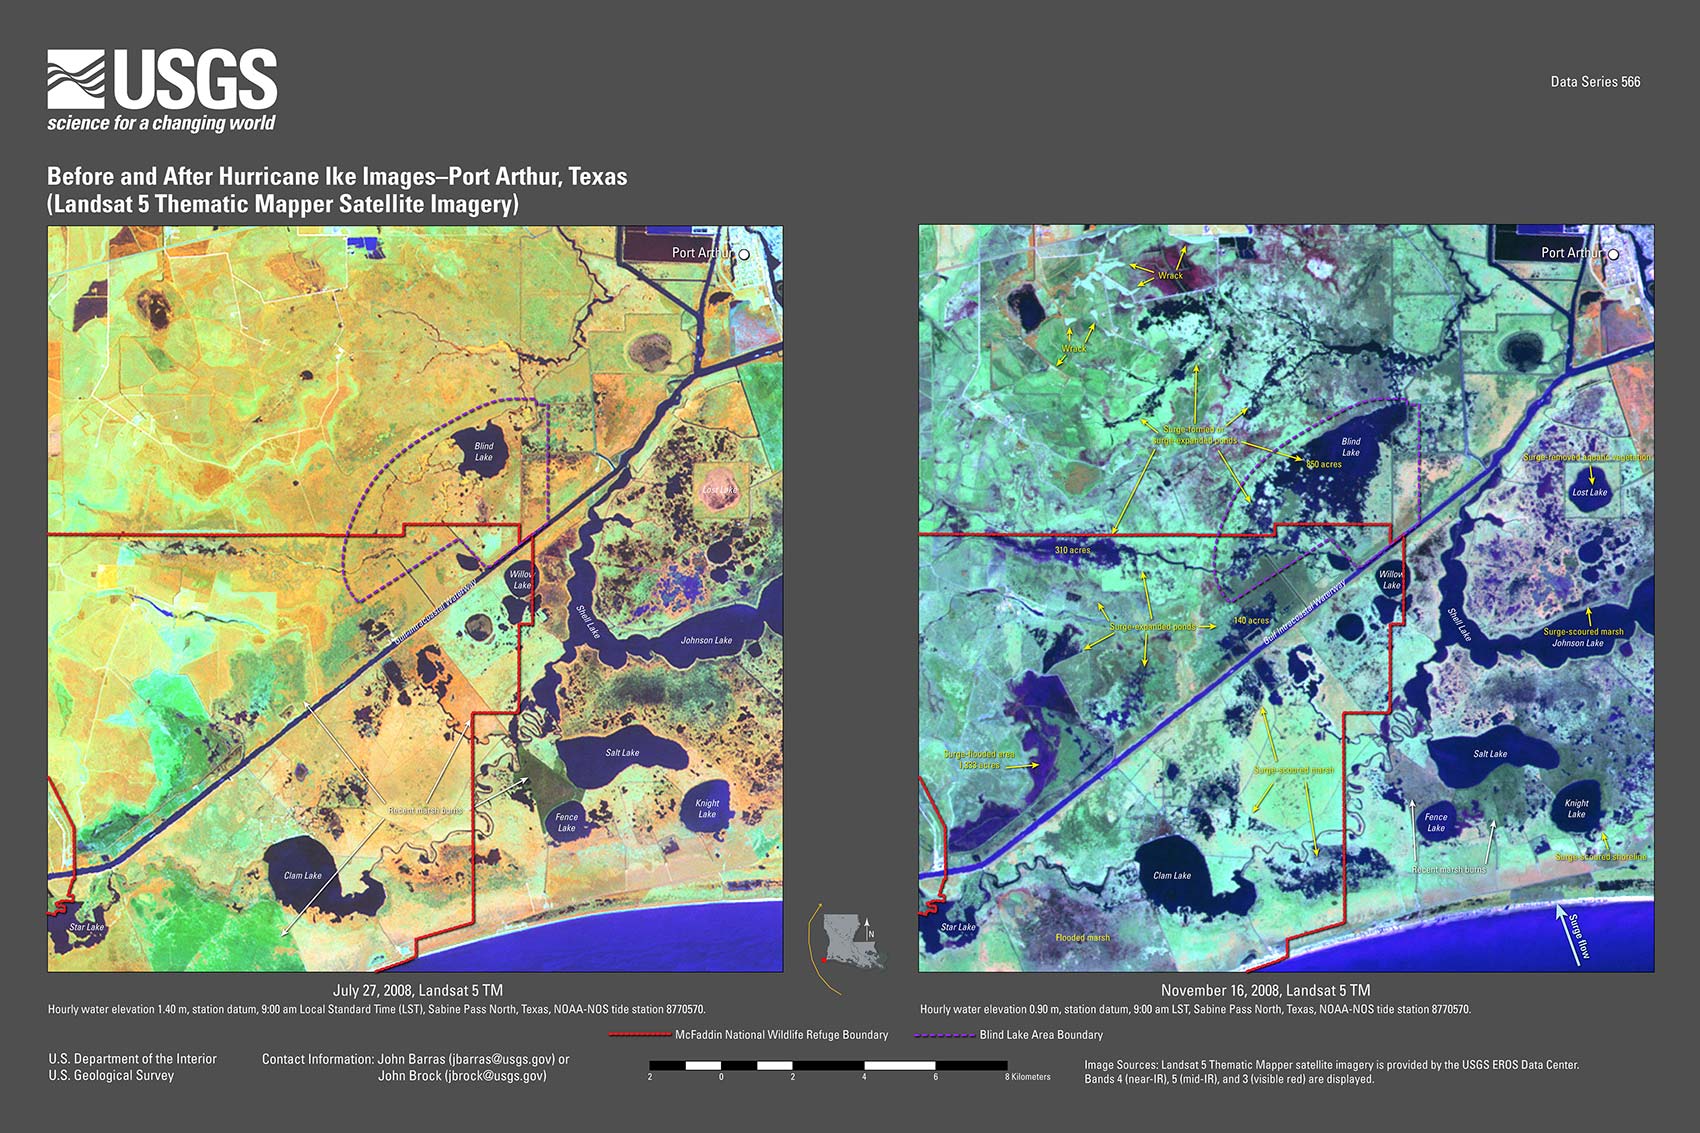
| 16. Port Arthur, Texas-Ike (336 KB jpeg) PDF (2.5 MB) |
||
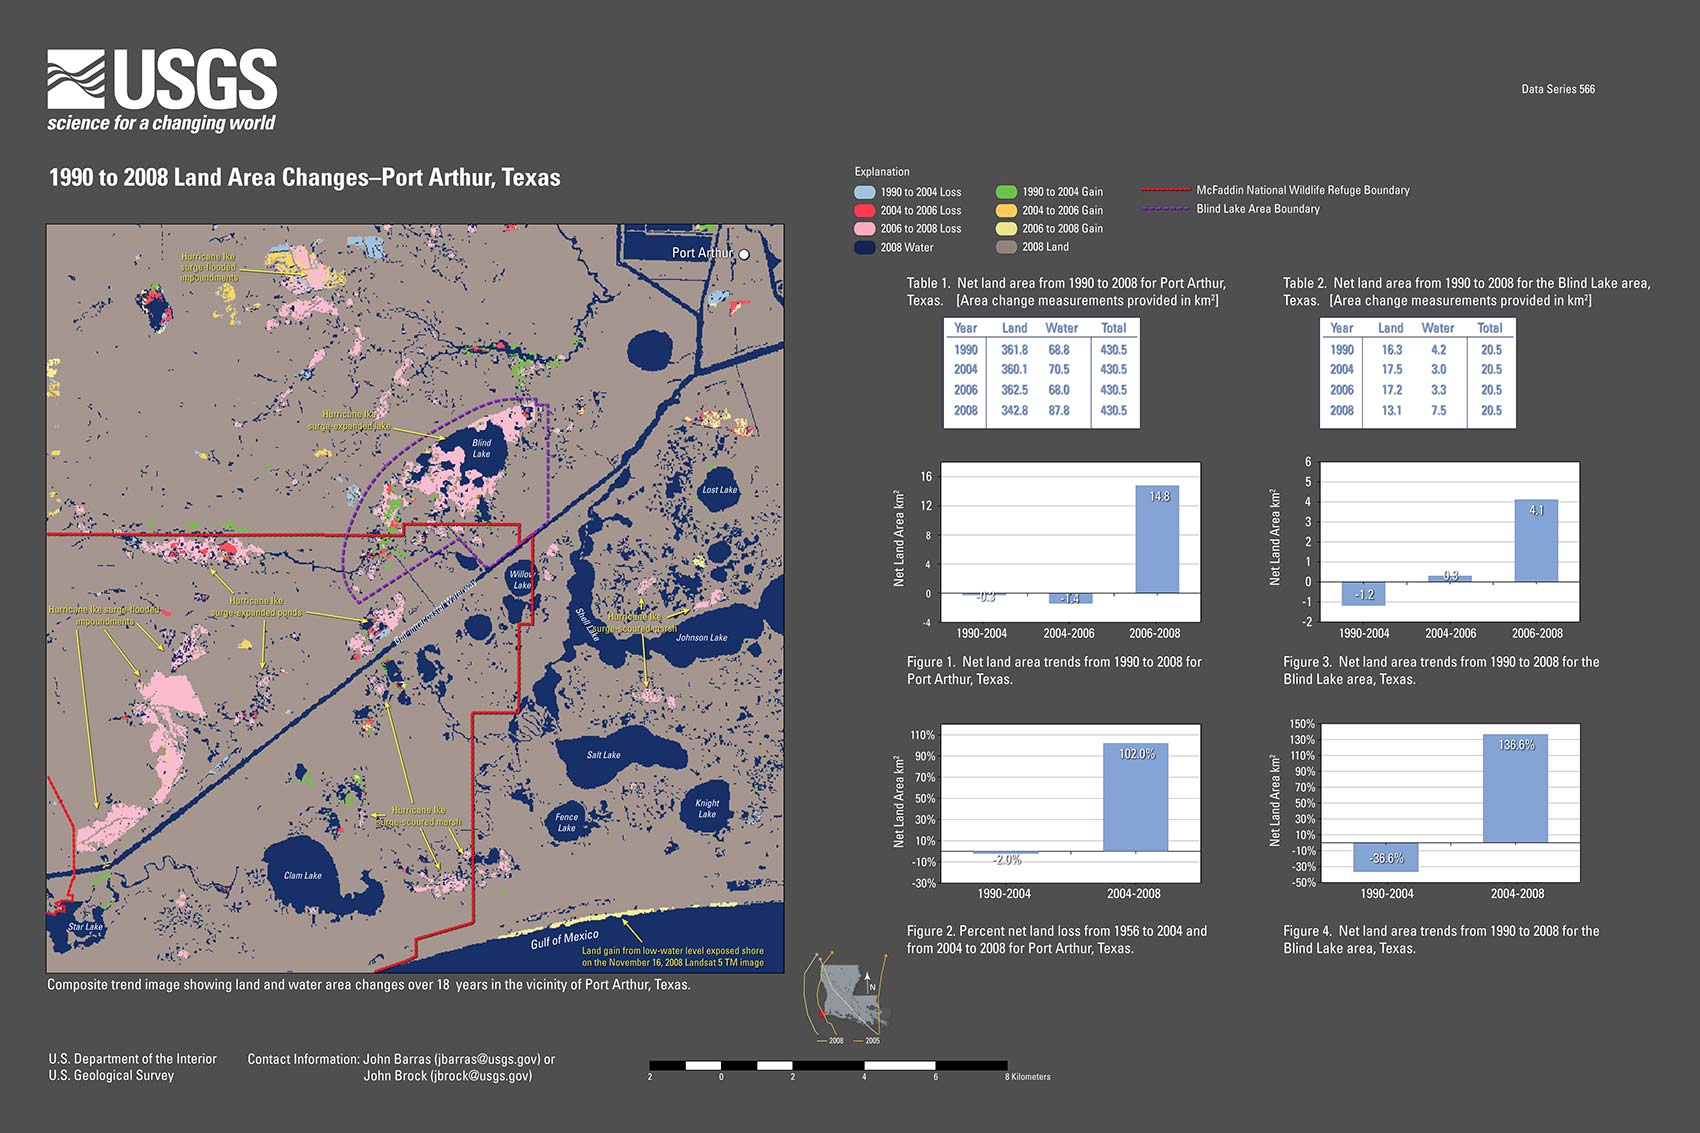
| 17. Port Arthur, Texas-Trends 1990-2008 (220 KB jpeg) PDF (3.8 MB) |
||
![]()

![]() U.S. Department of the Interior |
U.S. Geological Survey
U.S. Department of the Interior |
U.S. Geological Survey
URL: http://pubsdata.usgs.gov/pubs/ds/566/html/location_map.html
Page Contact Information: Contact USGS
Page Last Modified: Monday, 28-Nov-2016 15:49:00 EST
