U.S. Geological Survey Data Series 651
Click on an inset map to view the area in greater detail.
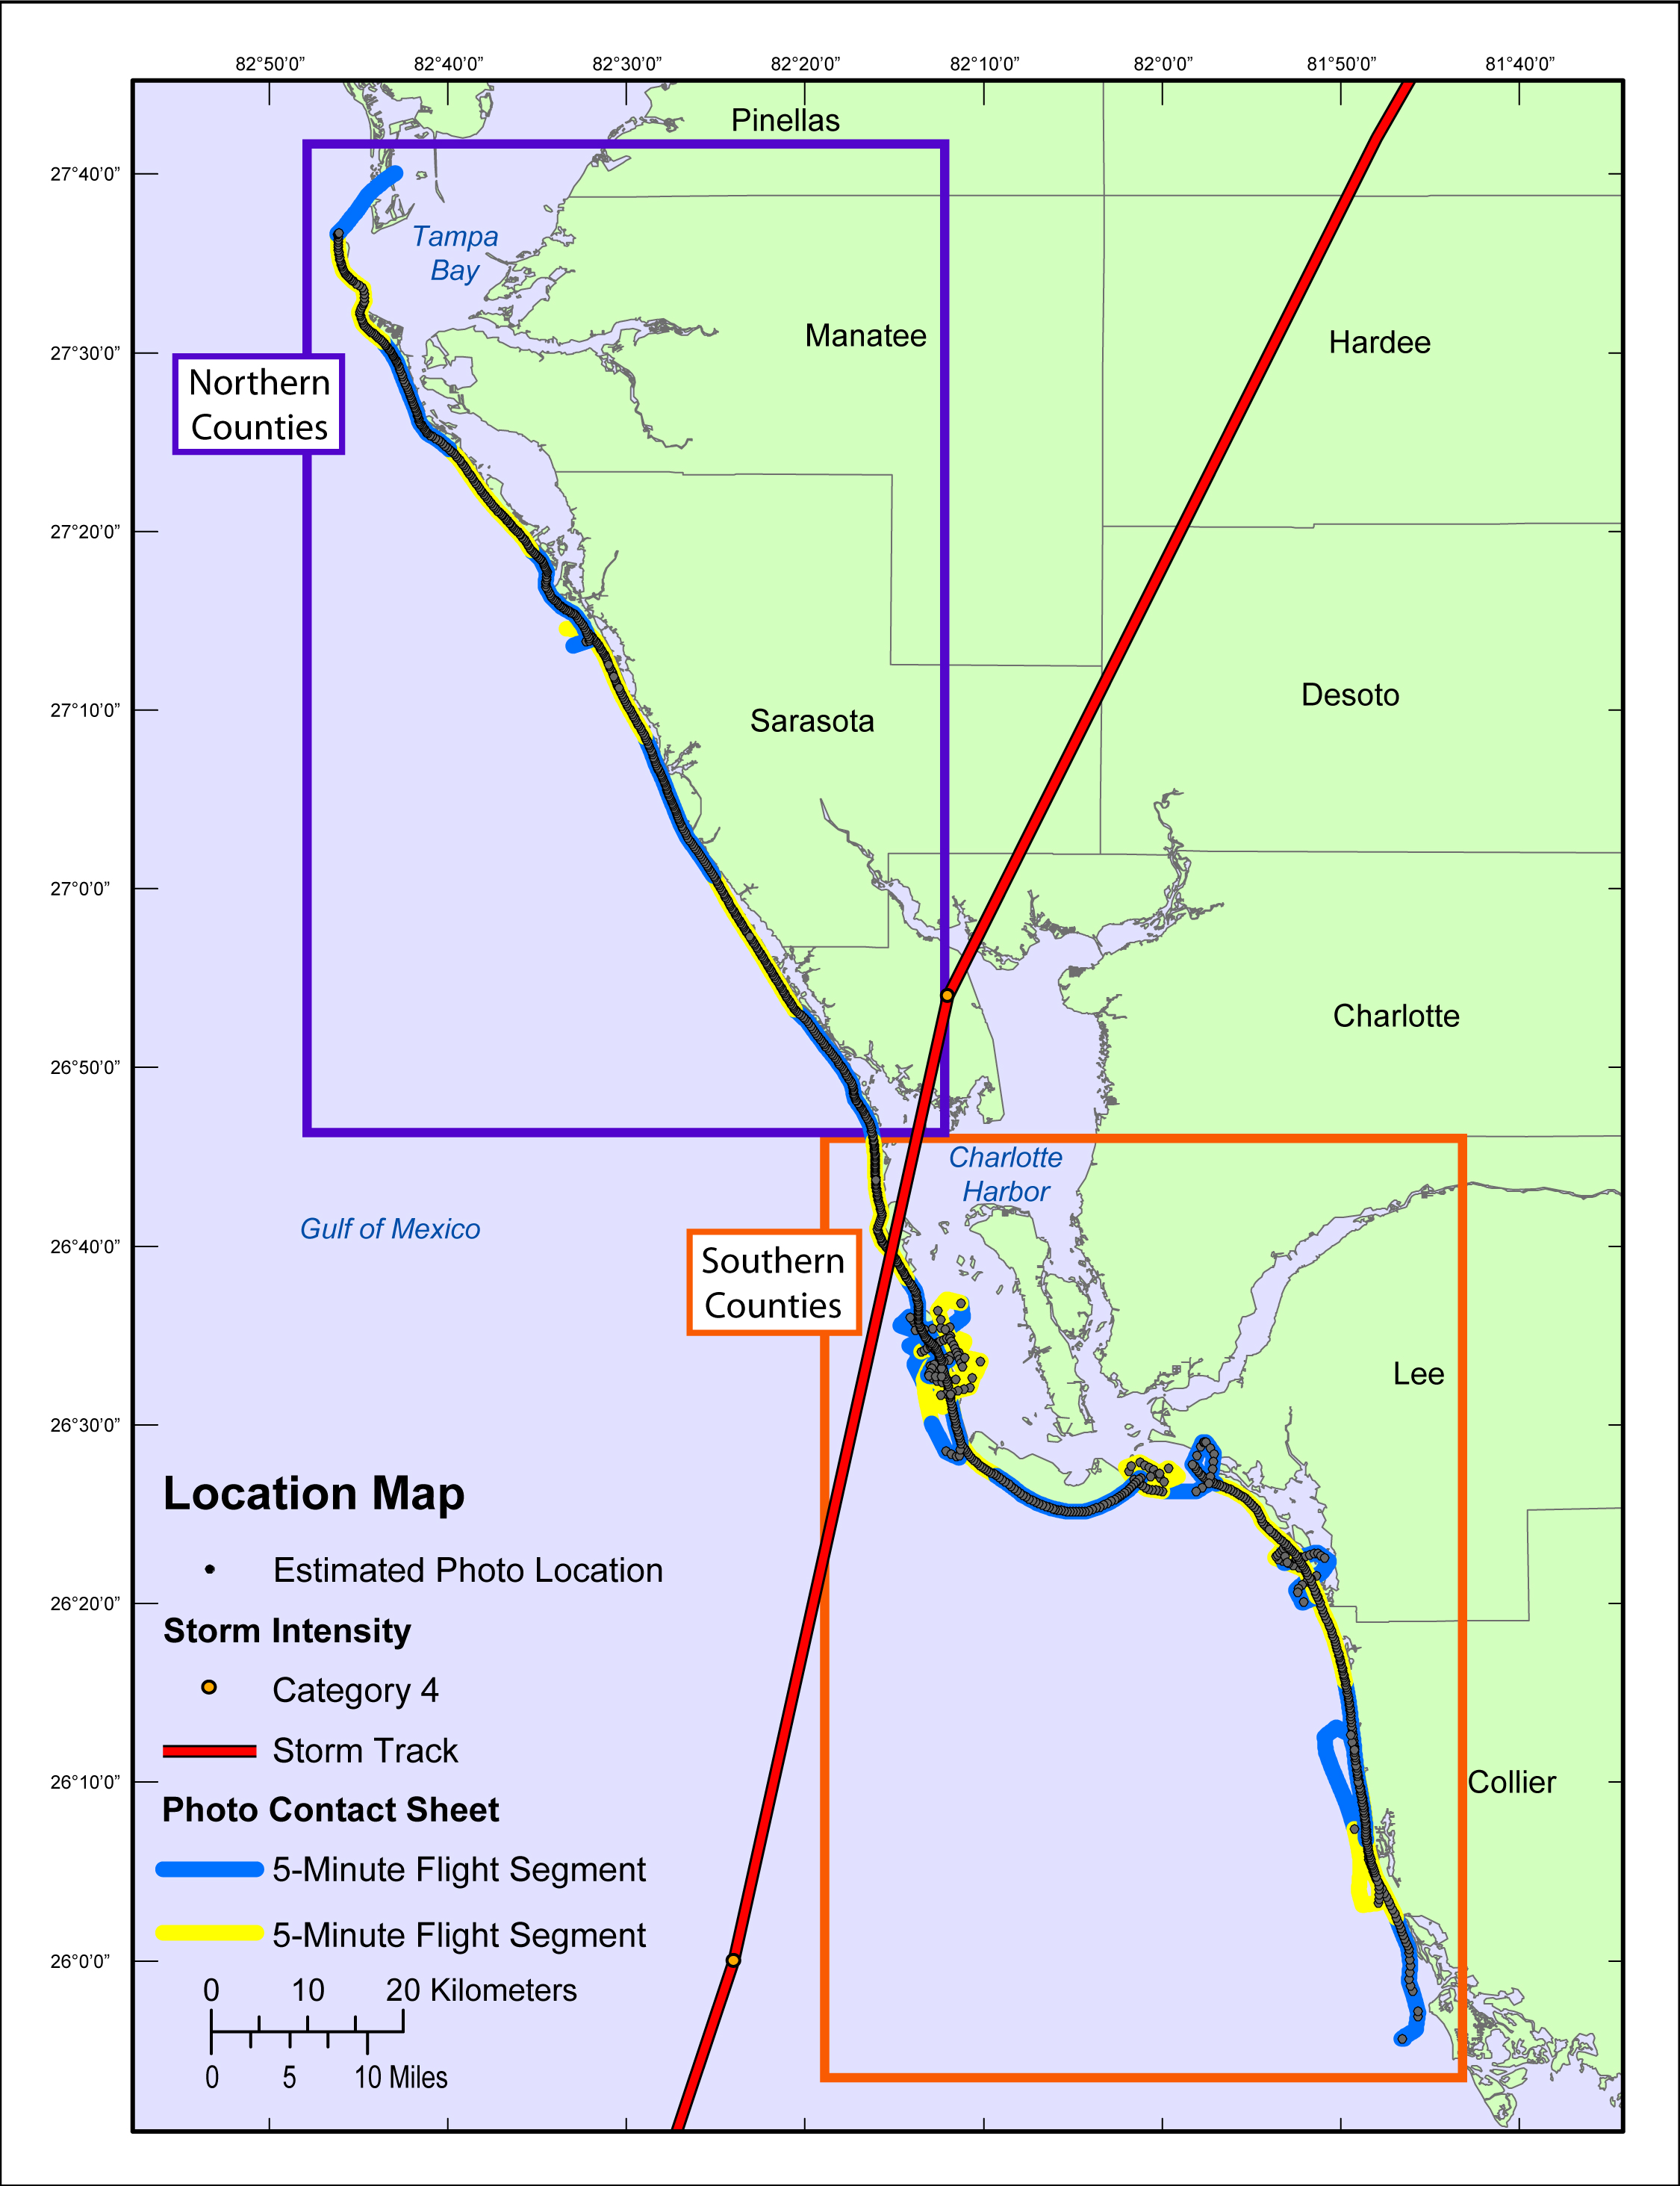
| Figure 2. Location map of all survey data collected during USGS field activity 04CCH01. Map showing the post-Hurricane Charley flight path study area. Blue and yellow colored sections of the flight path correspond to 5-min flight segments that link to a contact sheet of associated photo thumbnails. Gray dots show the estimated location of where the photograph was taken. Red line shows the storm track, and orange dot designates the category based on the Saffir-Simpson Hurricane Wind Scale. The map insets link to a more detailed view of the area. The insets also exhibit how the full-size photographs are divided on the DVD version of this report, northern counties (Pinellas, Manatee, Sarasota, and Charlotte; Disc 1) and southern counties (Lee and Collier; Disc 2) (Internet version unaffected). |

![]() U.S. Department of the Interior |
U.S. Geological Survey
U.S. Department of the Interior |
U.S. Geological Survey
URL: http://pubsdata.usgs.gov/pubs/ds/651/html/all.html
Page Contact Information: GS Pubs Web Contact
Page Last Modified: Monday, 28-Nov-2016 18:41:09 EST
