U.S. Geological Survey Data Series 675
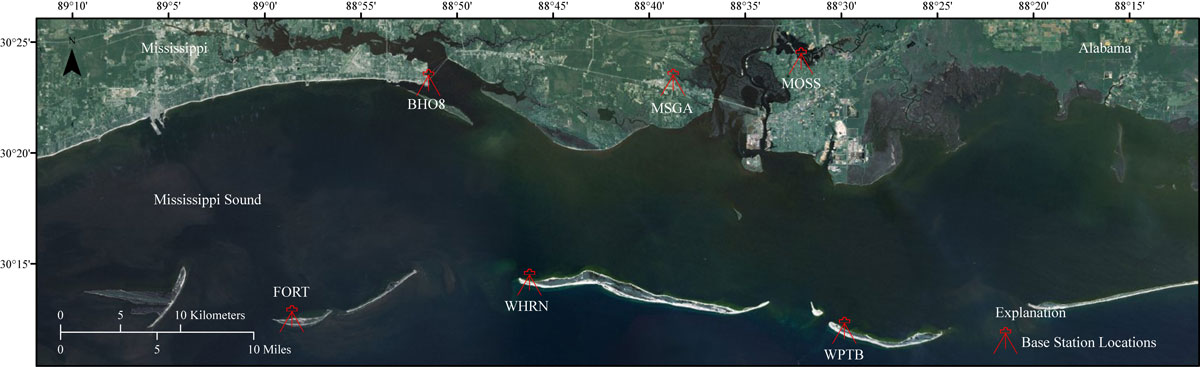
Figure 1. Study area for USGS Cruises 08CCT01, 08CCT02, 09CCT03, and 09CCT04 offshore Gulf Islands National Seashore, Miss., from West Ship Island, Miss., to Dauphin Island, Ala. |
Figure 2. Diagram of SANDS data acquisition showing land-based GPS station (base) and ship-board receivers (rover). [larger version] |
Figure 3. Map showing GPS base station locations for 2008-2009 survey. The site names and their affiliations are as follows: BH08 (NGS PID = BH0866), MSGA (NGS-CORS PID =DJ8941), MOSS (NGS PID = BH0314), FORT (NGS PID = BH1894 ), WHRN (USGS), and WPTB (USGS). [larger version] |
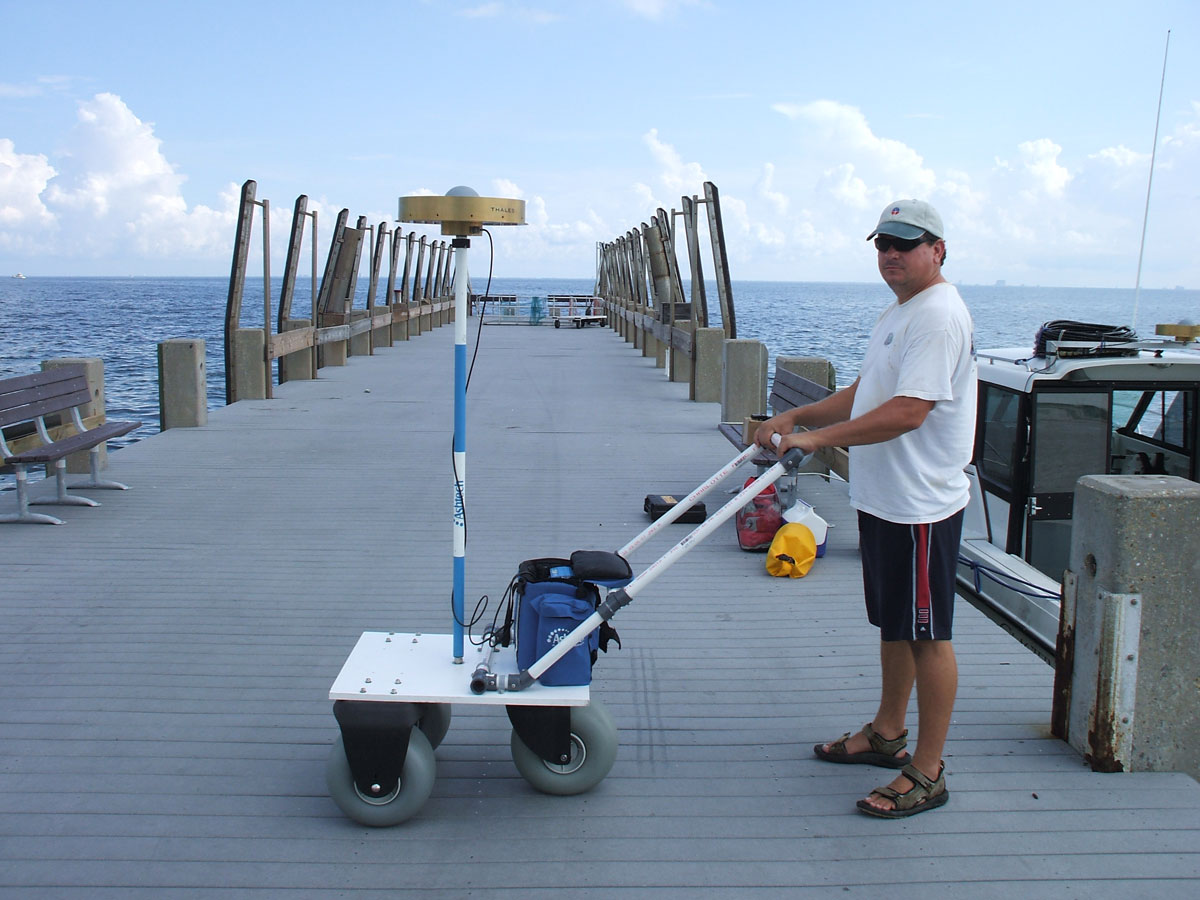
Figure 4. Some examples of the GPS base stations and their components. From left to right, BH08, located on the seawall in Biloxi; FORT, atop Fort Massachusetts on West Ship Island; and WHRN, on the western end of Horn Island. |
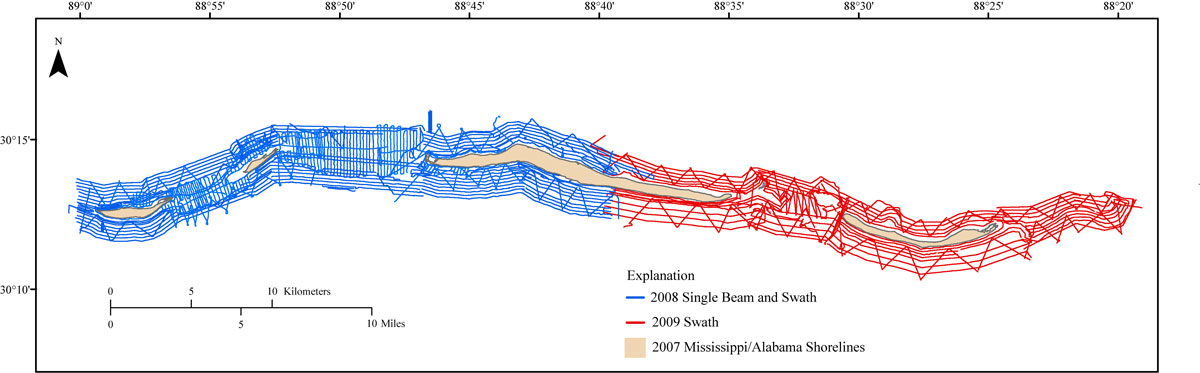
Figure 5. Trackline map showing single beam and swath survey coverage for the RV Survey Cat and the RV G.K. Gilbert for 2008 (blue) and 2009 (red). [larger version] |
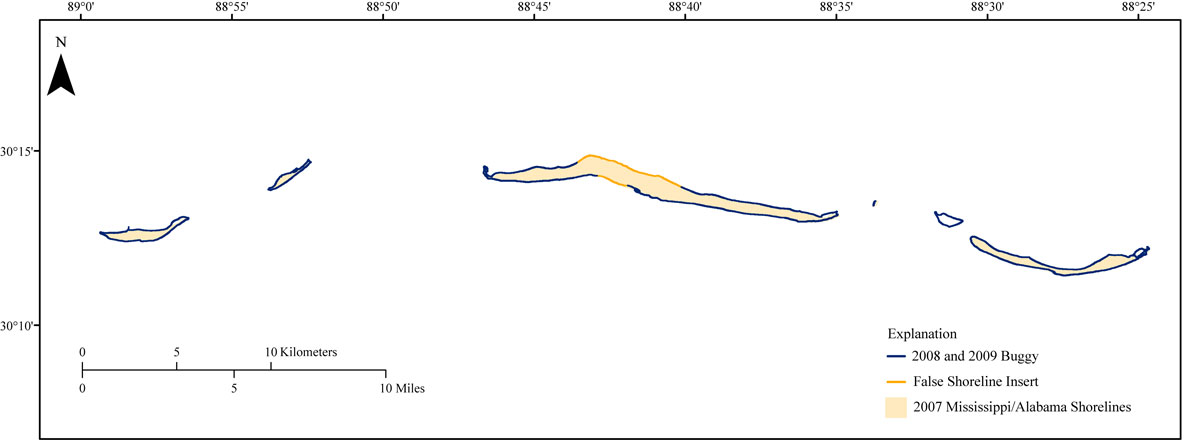
Figure 6. Trackline map of shoreline survey coverage using the portable buggy. [larger version] |
Figure 7. Photographs of the hardware components on the RV Survey Cat. [larger version] |
Figure 8. Photographs of the hardware components on the RV G.K. Gilbert. During acquisition the pole is vertical with the Thales choke ring antenna and the Octopus F190 antennas at the top and the transducers at the base with the swath transducers forward and the Knudsen transducer aft. [larger version] |
Figure 9. A screen shot of SWATHplus data acquisition and processing interface. [larger version] |
Figure 10. The portable push buggy used to map the island shorelines during the 2008-2009 surveys. The buggy is equipped with a fixed-height antenna mount with a Thales choke ring antenna connected to an Ashtech Z-Xtreme GPS. [larger version] |
Figure 11. A flowchart indicating steps taken during the post-processing of single beam and swath bathymetry. Blue boxes and green boxes represent 2008 and 2009 processing, respectively. [larger version] |
Figure 12. A map of the gridded single beam and swath bathymetry data for 2008 and 2009. The grid cell size is 50 meters, the data range is +1.59 to -19.59 meters with the positive values representing points on the shorelines and the negative values representing the bathymetry. Shoreline file is from 2007 processed EAARL LiDAR. [larger version] |
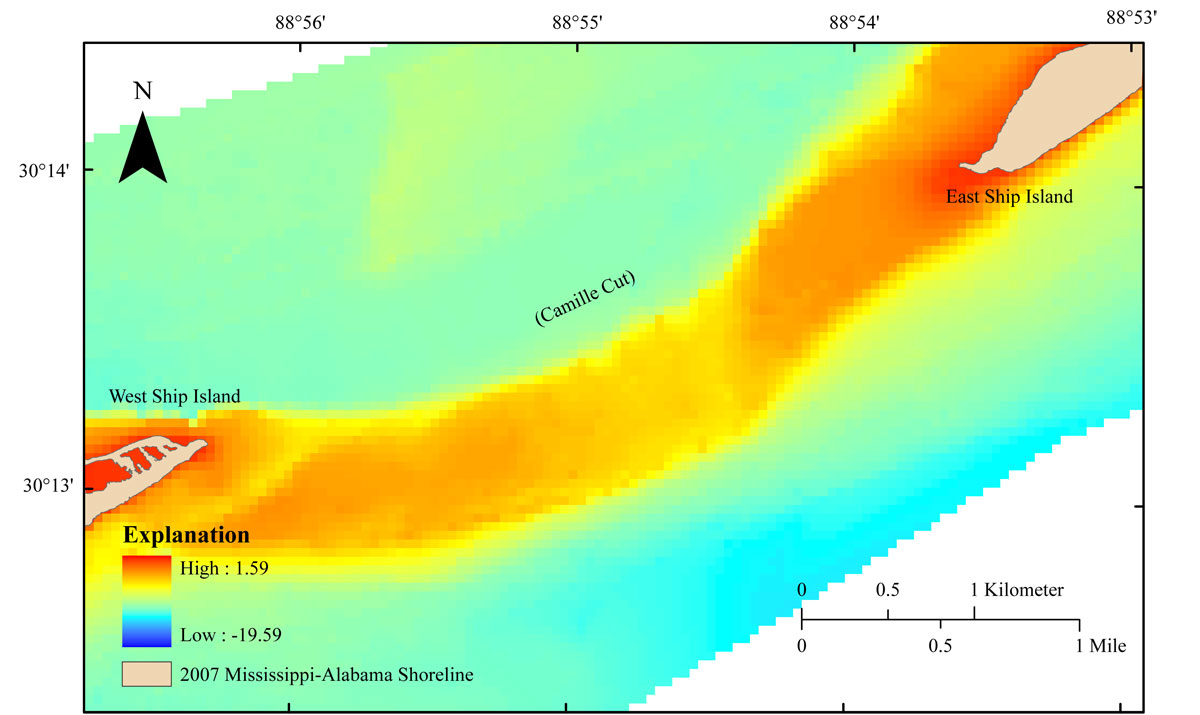
Figure 13. GeoTIFF image of Camille Cut. Image from the 2008-2009 50-meter bathymetry grid. Grid values range from +1.59 to -19.59 meters. Shoreline file is from 2007 processed EAARL LiDAR. [larger version] |
Figure 14. GeoTIFF image of Dog Keys Pass. Image from the 2008-2009 50-meter bathymetry grid. Grid values range from +1.59 to -19.59 meters. Shoreline file is from 2007 processed EAARL LiDAR. [larger version] |
Figure 15. GeoTIFF image of Horn Island Pass. Image from the 2008-2009 50-meter bathymetry grid. Grid values range from +1.59 to -19.59 meters. Shoreline file is from 2007 processed EAARL LiDAR. [larger version] |
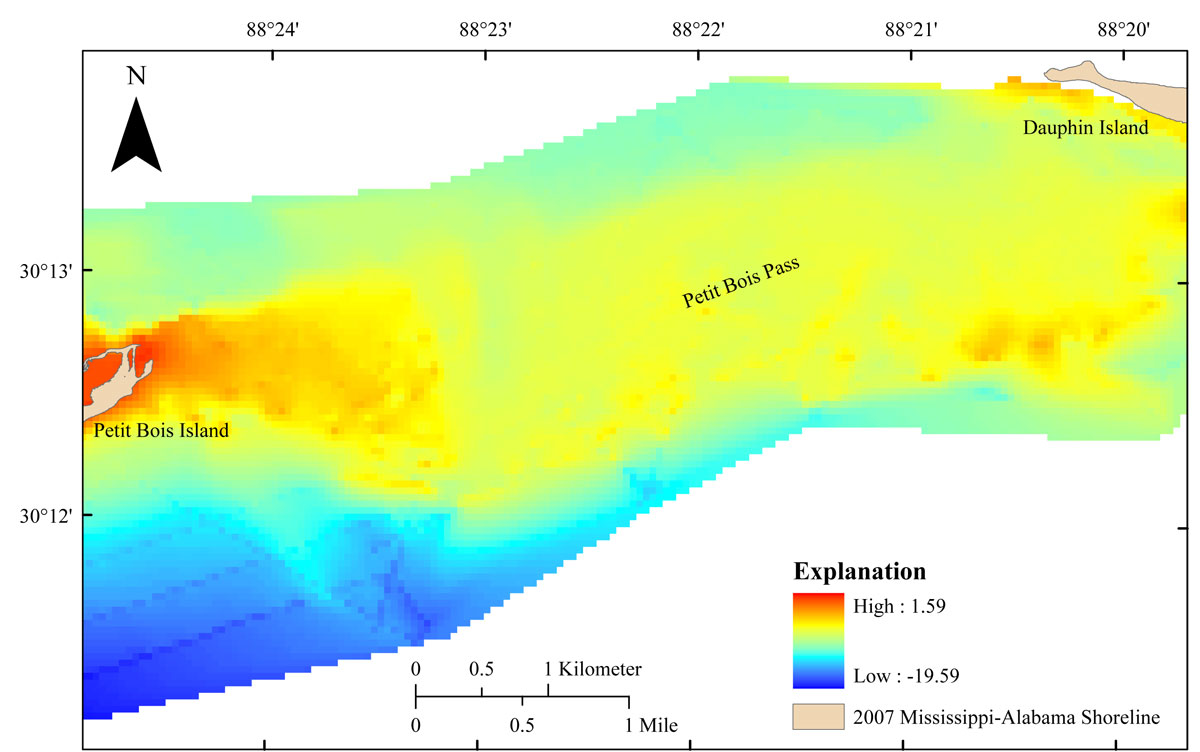
Figure 16. GeoTIFF image of Petit Bois Pass. Image from the 2008-2009 50-meter bathymetry grid. Grid values range from +1.59 to -19.59 meters. Shoreline file is from 2007 processed EAARL LiDAR. [larger version] |
Figure 17. Image of the intersection of the 2008 single beam and swath data and the 2009 swath data. Trackline colors are indicative of survey year, vessel, and technique. Crossing labels and their respective values are listed in table 1. [larger version] |
Figure 18. A basic graphical representation of four shoreline scenarios encountered by the walking surveyor (A) a gentle sloping shoreline, (B) an inlet preventing an obstacle making the area non-traversable, (C) scarp formations in which the water was lapping at the base forcing the surveyor to walk atop the scarp, and (D) a steep shoreline in which the buggy was tilted due to a high-angled beach face. [larger version]
|
Table 1. Differences between crossings of single beam and swath survey lines at the intersection of 2008 and 2009 bathymetry datasets. |

![]() U.S. Department of the Interior |
U.S. Geological Survey
U.S. Department of the Interior |
U.S. Geological Survey
URL: http://pubsdata.usgs.gov/pubs/ds/675/html/figuresandtables.html
Page Contact Information: GS Pubs Web Contact
Page Last Modified: Monday, 28-Nov-2016 18:39:52 EST
