Home | Acronyms | Figures and Tables | Positioning and Navigation | Equipment and Processing | Results and Images | Logs | Metadata | Software
Data Results
2008-2009 50-meter Bathymetry Map
Camille Cut Map
Dog Keys Pass Map
Horn Island Pass Map
Petit Bois Pass Map
Crossing Results between 2008 and 2009 Bathymetry Data
Discussion and Conclusions
Data Results
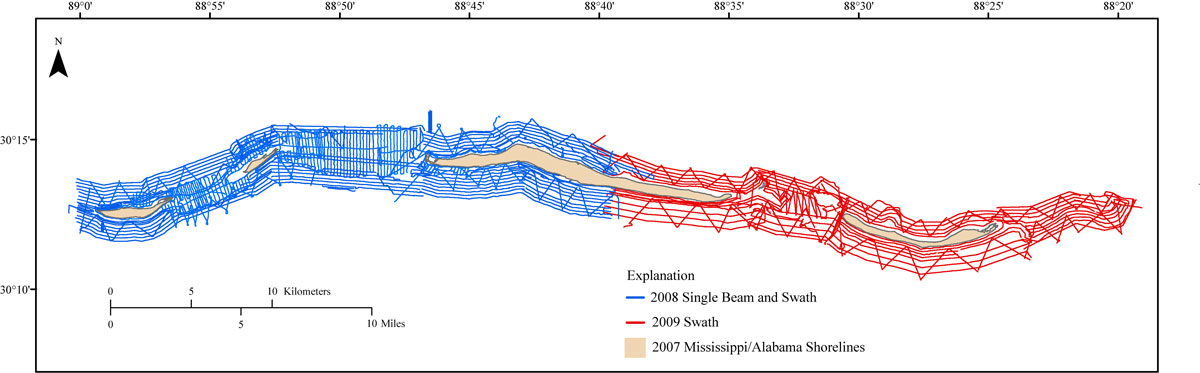
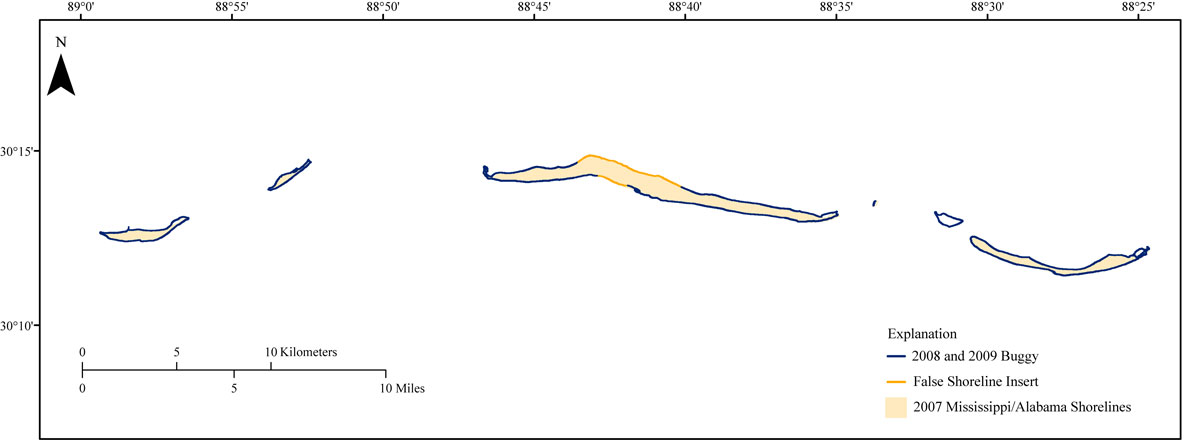
The vessel survey coverage for 2008-2009 resulted in 1,733,333 differentially corrected x,y,z data points. The portable-buggy shoreline survey produced 85,632 differentially corrected x,y,z points, while the interpolated shoreline insert added 1,263 x,y,z data points (fig. 5 and fig. 6).
The raster image of the 2008 and 2009 data (fig. 12) ranges in orthometric height from +1.59 m to -19.59 m. The positive values represent the shorelines and the negative values represent bathymetric measurements, both relative to the ellipsoid. Figures 13 - 16 are a closer examination of the passes including Camille Cut, Little Dog Keys and Dog Keys Pass, Horn Island Pass, and Petit Bois Pass. The variable relief respective to each pass is clearly defined.
2008-2009 50-meter Map
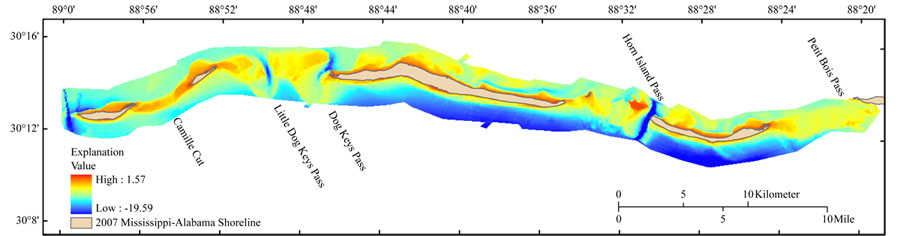
Figure 12. A map of the gridded single beam and swath bathymetry data for 2008 and 2009. The grid cell size is 50 meters, the data range is +1.59 to -19.59 meters with the positive values representing points on the shorelines and the negative values representing the bathymetry. Shoreline file is from 2007 processed EAARL Lidar. [larger version] |
Camille Cut Map
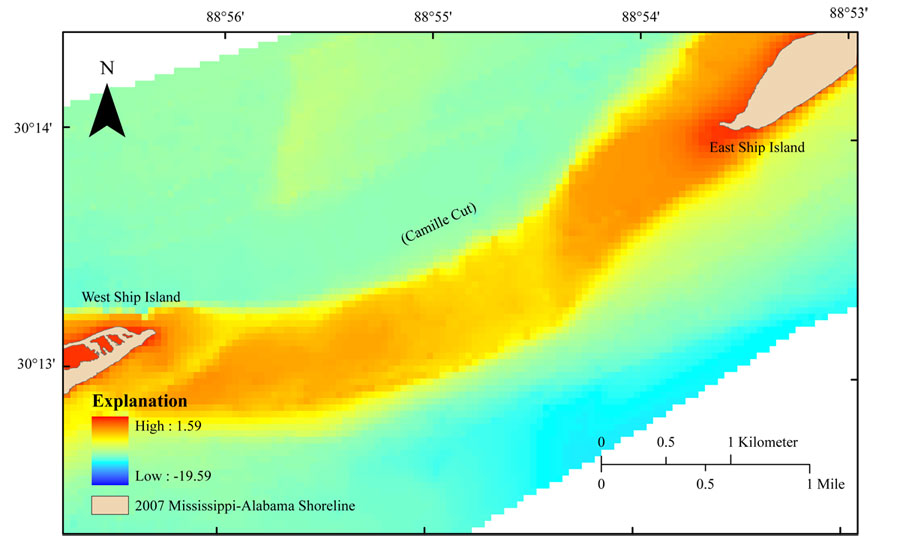
Figure 13. GeoTIFF image of Camille Cut. Image from the 2008-2009 50-meter bathymetry grid. Grid values range from +1.59 to -19.59 meters. Shoreline file is from 2007 processed EAARL Lidar. [larger version] |
Dog Keys Pass Map
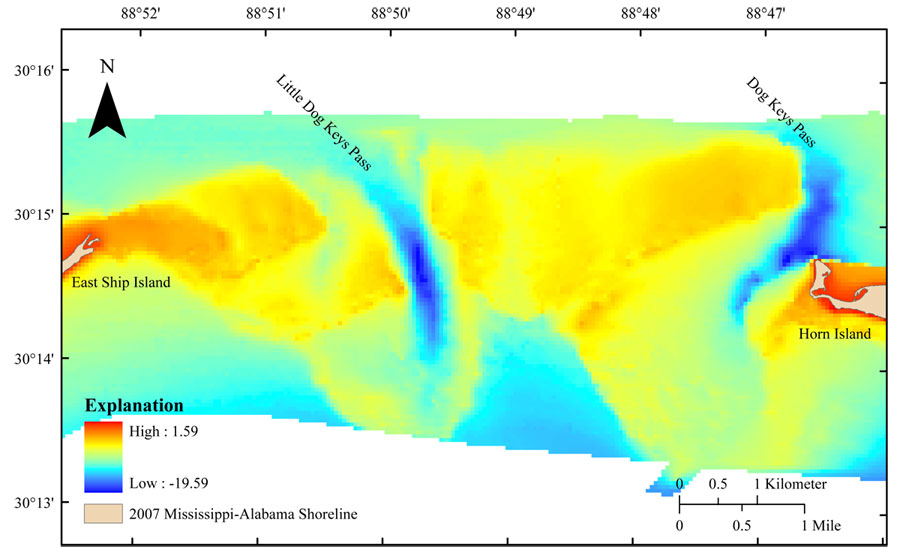
Figure 14. GeoTIFF image of Dog Keys Pass. Image from the 2008-2009 50-meter bathymetry grid. Grid values range from +1.59 to -19.59 meters. Shoreline file is from 2007 processed EAARL Lidar. [larger version] |
Horn Island Pass Map
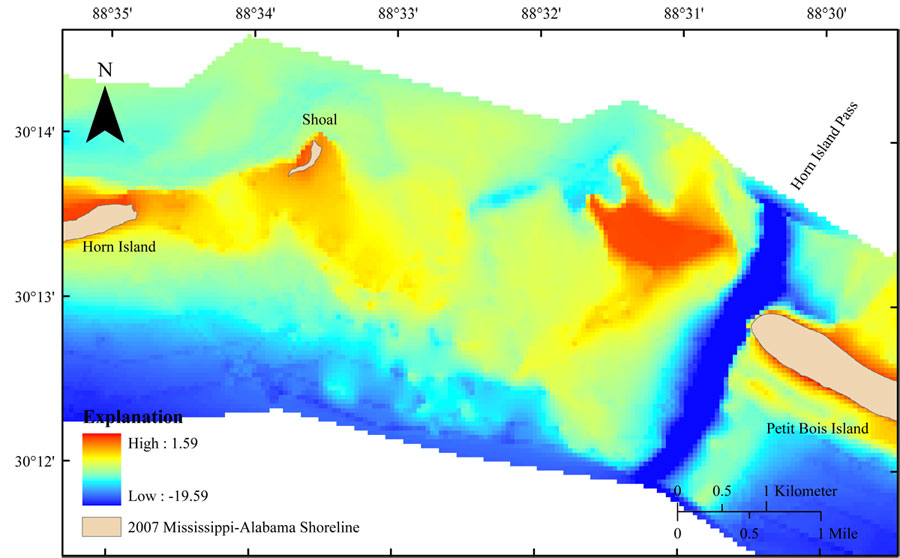
Figure 15. GeoTIFF image of Horn Island Pass. Image from the 2008-2009 50-meter bathymetry grid. Grid values range from +1.59 to -19.59 meters. Shoreline file is from 2007 processed EAARL Lidar. [larger version] |
Petit Bois Pass Map
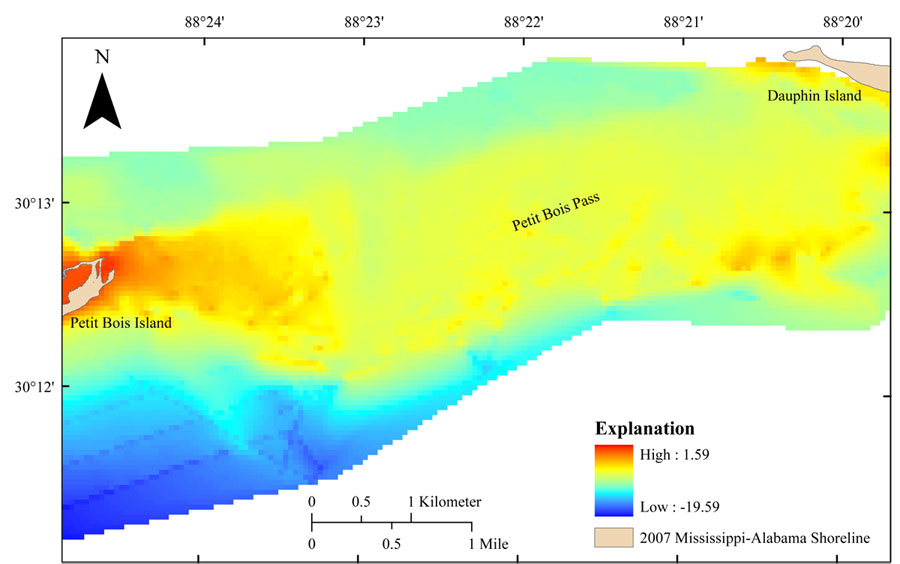
Figure 16. GeoTIFF image of Petit Bois Pass. Image from the 2008-2009 50-meter bathymetry grid. Grid values range from +1.59 to -19.59 meters. Shoreline file is from 2007 processed EAARL Lidar. [larger version] |
Crossing Results between 2008 and 2009 Bathymetry Data
Figure 17 displays the trackline intersection between the 2008 and 2009 data located at Horn Island. The difference in depth values between lines that intersect are a measurement of reproducibility in the survey. Differences may be due to numerous factors including but not limited to: (1) internal instrument error, (2) human error in measurments, (3) lower quality GPS sessions as a result of poor atmospheric conditions, (4) rough sea state versus calm sea state, (5) averaging the swath values over a larger area than a single-beam site, and (6) the fact that surveys were conducted 1-year apart and elevations may have changed.
Forty-two crossing areas were reviewed, and table 1 lists the minimum, maximum, and average differences between 215 crossing values; 127 on the sound side and 88 on the gulf side. Differences range from 0.00 m to 0.88 m with an average of 0.29 m. Differences on the sound side were lower than the average difference on the gulf side (table 1). The average difference of 0.29 m is within the acceptable range of error found inherent in the system, environmental conditions, and processing procedures.
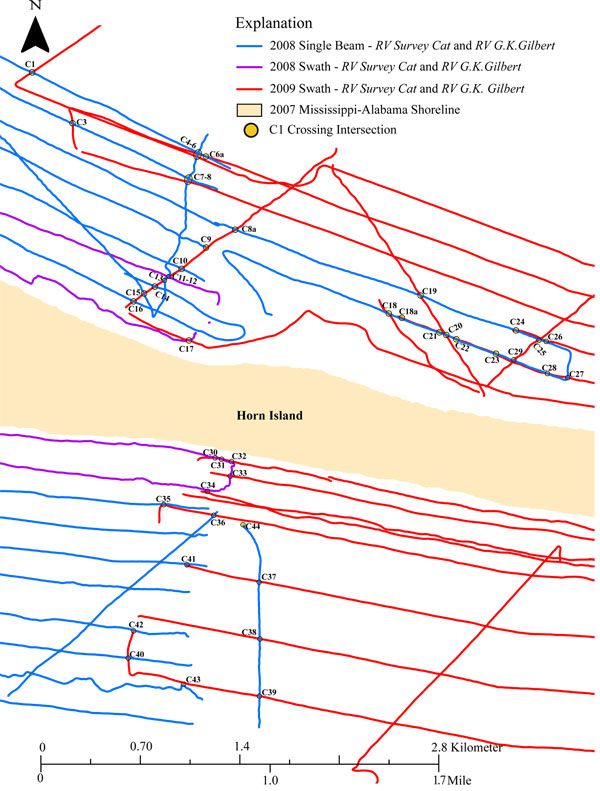
Figure 17. Image of the intersection of the 2008 single beam and swath data and the 2009 swath data. Trackline colors are indicative of survey year, vessel, and technique. Crossing labels and their respective values are listed in table 1. [larger version] |
Statistic |
All |
Sound Side |
Gulf Side |
|---|---|---|---|
Count |
215 |
127 |
88 |
Minimum (m) |
0.00 |
0.00 |
0.00 |
Maximum (m) |
0.88 |
0.77 |
0.88 |
Average (m) |
0.29 |
0.24 |
0.35 |
Table 1. Differences between crossings of single beam and swath survey lines at the intersection of 2008 and 2009 bathymetry datasets. |
Discussion and Conclusions
Shallow water surveys such as this are very sensitive to subtle vertical offsets caused by equipment and environmental conditions such as antenna offsets and water heights. Referencing the depth values to an Earth-centered reference system reduces the vertical error that may occur when using an independent water level datum.
This survey shows that single-beam data can be successfully combined with swath data for acceptable results. Processing the navigation data externally is time consuming and detail oriented but improves the spatial accuracy of the final grid.
The crossing values between the 2008 and 2009 survey (fig. 17 and table 1) indicate that multiple surveys can be merged accurately. Analysis of line crossings is the best measurement for revealing inaccuracies in data collection and processing. A maximum difference of 0.88 m was found on the gulf side at crossing C36 in figure 17.
All other crossings values on that same day were acceptable. The GrafNav files and field logs did not indicate GPS problems, weather, or equipment problems. There was no solid indication that this crossing was a problem. Also, when considering that Hurricane Gustav passed through this area between survey times, due to the shallower water, it is possible that some or all of the 0.80 m difference between the 2008 and 2009 surveys can be attributed to natural conditions in the nearshore zone.
The study provided a unique opportunity to compare collection and processing procedures between single beam and swath bathymetric systems. In comparison, acquisition of swath bathymetry in shallow water produced a lot of noise in the data that was not adequately removed by software filters. Post-processing and editing of the swath data was the most time consuming task, with little or no improvement in accuracy over the single-beam system. For large-area shallow-water surveys where 100 percent data overlap is not desired, single-beam surveys produce a more efficient product.
Collection of shoreline data was necessary to obtain current shoreline positions and elevations at the time of the surveys. Positions along the high-water mark were surveyed, and tide was not considered. Other conditions that impacted the buggy survey included the large island perimeters, the summer heat intensity, and the safety of the walking scientist. Despite these variables, the portable-buggy derived shoreline was a reasonable and affordable method for this type of survey. The data from the shoreline survey improved the 2008-2009 bathymetry grid by providing a boundary of elevations for the grid. This constraint forced the algorithm to more accurately interpolate bathymetry between the nearshore survey trackline and the shoreline and include elevations above sea level across the width of the islands, providing a more appropriate representation of the islands and the nearshore bathymetry (fig. 12).
Some different shoreline features were encountered that caused the buggy to divert from the strandline. Figure 18 is a graphic representation of four types of shoreline scenarios encountered. These are not unique to a particular island and do not occur in any type of sequence. The majority of the shorelines walked were gentle slopes in which the buggy was considered relatively level (fig 18A). Some small scale inlets were encountered and ranged from approximately 1 to 5 m across (fig. 18B). In some instances these inlets were shallow, and the buggy could float, so the surveyor could traverse the inlet safely. However, in other instances inlets had strong rushing waves and were steep and deep enough to make it dangerous to traverse. This type of inlet usually opened to a large tidal pool. It appeared that these inland depressions may be filled at a high tide or during a long wind event that pushes water onto the island. In these cases, the surveyor would survey the edges around the inland depression to get back to the shoreface. These depressions most notably were located on the eastern ends of both East Ship Island and Petit Bois Island. In other areas, most often on the gulf side of the island, a scarp of up to 1 m existed in which the buggy could not follow the shoreline. Deep water was lapping at the base of the scarp, forcing the surveyor to walk the buggy along the scarp (fig. 18C). Where the shoreline was steeply sloping, the buggy platform was tilted (fig. 18D). The angle of the antenna compromised the integrity of the position. If a motion sensor had been used, the geometrical measurements could be applied to the final position and the data quality. Overall, this method is considered applicable for surveys in which other survey methods such as LiDAR cannot be conducted.
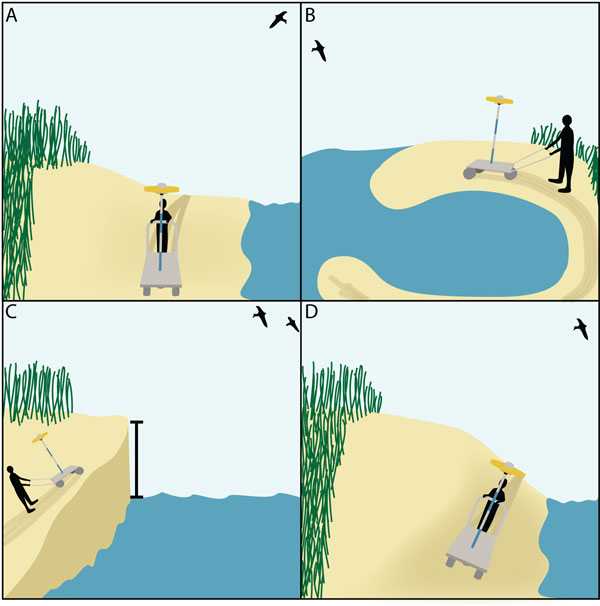
Figure 18. A basic graphical representation of four shoreline scenarios encountered by the walking surveyor: (A) a gentle sloping shoreline, (B) an inlet preventing an obstacle making the area non-traversable, (C) scarp formations in which the water was lapping at the base forcing the surveyor to walk atop the scarp, and (D) a steep shoreline in which the buggy was tilted due to a high-angled beach face. [larger version] |
