
| The Colorado Plateau covers 210,000 km 2 (130,000 mi 2) of Utah, Colorado, New Mexico, and Arizona. Management of this region’s resources requires an understanding of how its climate has varied in the past and may change in the near future. Recent studies by U.S. Geological Survey (USGS) and other scientists suggest that the region may become drier for the next 2 to 3 decades, in a pattern similar to the drought of 1942–1977. The region’s population has increased fourfold since the mid-1950s, creating the possibility of severe consequences if such a drought were repeated. |
The Colorado Plateau, one of the most visually captivating parts of the United States, covers 210,000 km 2 (130,000 mi 2) of Utah, Colorado, New Mexico, and Arizona (fig. 1). Geologically, the plateau contains extensive areas of colorful, nearly horizontal, and essentially bare sedimentary rocks that are sculpted into plateaus, mesas, and deeply incised canyons, of which Grand Canyon is the classic example. The average elevation of the plateau is 1,500 m (5,000 ft), with peaks that rise to more than 3,700 m (12,000 ft). The region is arid to semiarid with sparse vegetation in the lowlands, forests in the mountains, and lush vegetation along the watercourses. The spectacular scenery, diverse ecosystems, and numerous important archeological sites are protected in 30 national parks and monuments.
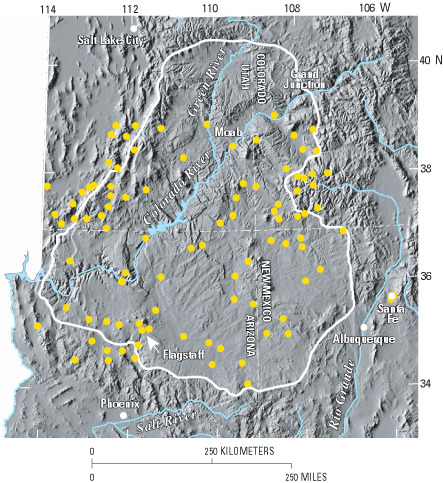 |
| Figure 1. Regional setting of the Colorado Plateau (white outline), showing the 97 long-term weather stations (yellow dots) used to document the region’s precipitation history. |
Ranchers, environmental
organizations, and agencies responsible for resource management in the parks,
monuments, and other Federal and state lands of the region have a need to understand
its long-term climate and how its climate may change in the near future. Regional
precipitation varied substantially in the 20th century and is expected to decrease
over the next 20 to 30 years. Scientists from diverse disciplines recently participated
in a workshop to consider how landscapes and ecosystems in the Southwest might
respond to a drier climate (Schmidt and Webb, 2001). A change to drier climate—particularly
reduced winter rainfall—would have a variety of interrelated effects on
plateau ecosystems. These may include reduced groundwater recharge, lower baseflow
in perennial streams, increased frequency of dust storms and strong winds, weakening
of biological soil crusts, reduction of plant cover and possible changes in
species composition, remobilization of sand from previously stable dunes, and
increased frequency of forest and range fires. This fact sheet discusses the
20th century precipitation patterns of the plateau, shows their relation to
global climatic indices, and points out how precipitation may change in upcoming
decades.
Long-Term Variability
of Annual Precipitation
Average annual precipitation
on the Colo-rado Plateau, based on analysis of daily records from 97 long-term
weather stations (fig. 1), ranges from 136 to 668 mm/yr (5.4 to 26.3 in/yr),
with a median precipitation of 300 mm/yr (11.8 in/yr). Annually, precipitation
varied substantially during the 20th century (fig. 2).
Three multidecadal precipitation regimes are apparent in the precipitation history:
1905–1941, 1942–1977, and 1978–1998. Although the choice of limiting
dates for these regimes is somewhat subjective, the middle period was clearly
dry and was sandwiched between two wetter episodes. The early part of the dry
regime (1942–1956) was recognized as a drought in the 1960s (Gatewood and
others, 1964), perhaps the severest drought in the past 400 years in New Mexico
(Swetnam and Betancourt, 1998). This drought affected much of the Southwest
and lasted until 1977, although precipitation increased somewhat after 1956.
The first 5 years of the 20th century (1900–1904) was the culmination of
an 11-year drought in the Southwest that began in 1893 (Gatewood, 1962).
The annual variability of
precipitation is consistent among the stations. Wet years, defined as having
precipitation above the 20th century regional median, typically have more than
50% of the stations reporting precipitation above the median. From 1942 to 1977,
moisture was below normal at more than 50% of the stations for 32 of the 36
years. Excluding the 1900–1904 drought and 1999–2000, the relatively
wet precipitation regimes (fig. 2) were characterized
by wet conditions in 18 of 37 and 14 of 21 years, respectively. Aside from the
severe drought of 1989, climate from 1978 to 1998 was consistently wet compared
with the preceding 36 years.
Seasonal Precipitation
Regional precipitation is
biseasonal, occurring mostly during the cool and warm seasons, defined here
as October 16 to April 15 and June 15 to October 15, respectively. Cool-season
precipitation is caused primarily by frontal systems originating in the eastern
North Pacific Ocean. Warm-season rainfall is related to the Mexican monsoon,
a seasonal reversal of atmospheric circulation that transports moisture over
the plateau from the Gulf of Mexico and (or) the Gulf of California. Seasonal
precipitation is expressed in figure 3 as a standardized anomaly index (SAI);
indices near zero indicate normal precipitation, while those substantially above
or below zero indicate relatively wet or dry conditions. Seasonal precipitation
has three multidecadal patterns similar to those of annual precipitation. The
two wet regimes were characterized by several unusually moist seasons, whereas
during the 1942–1977 dry regime neither season was unusually wet except
the winter or cool season of 1973.
Colorado Plateau Precipitation
and Global Climate
Precipitation variability
on the Colorado Plateau is linked spatially and temporally with events in the
tropical Pacific and northern Pacific Ocean. Specifically, episodes of unusually
wet or dry climate result from interrelated global-scale fluctuations of sea-surface
temperature (SST), atmospheric pressure, and atmospheric circulation patterns.
These fluctuations operate on two timescales, providing an important means of
understanding and predicting precipitation patterns. Short-term climate variation,
with a period of 4 to 7 years, is associated with El Niño and La Niña
activity as expressed by several indicators, including the Southern Oscillation
Index (SOI) and equatorial SST. Multidecadal climate variation follows a pattern
best expressed by the Pacific Decadal Oscillation (PDO), a phenomenon of the
northern Pacific Ocean.
Short-Term Variation—El
Niño and La Niña
The SOI is the standardized
difference in sea-level atmospheric pressure between Darwin, Australia, and
Tahiti. A sustained negative value of the SOI portends the large-scale, anomalous
warming of SST in the tropical eastern Pacific Ocean. This phenomenon is generally
referred to as El Niño, a term originally applied to the weak, seasonal
(usually late December), warm, and south-flowing current off the coast of Peru
(Trenberth, 1997). Warm SST in the eastern equatorial
Pacific Ocean and sustained negative SOI indicate El Niño conditions,
whereas cool SST and sustained positive SOI indicate La Niña conditions.
The fully developed interaction between atmosphere and ocean is termed ENSO
(El Niño-Southern Oscillation). El Niño conditions tend to bring
wet winters to the Southwest and increased streamflow through southerly displacement
of storm tracks, although drought may also occur, whereas La Niña conditions
reliably bring dry winters (Cayan and others, 1999).
Seasonal precipitation in the Colorado Plateau region correlates negatively with the SOI (fig. 4). The strength of the correlation is modest, but the probability (P) that precipitation is independent of SOI is negligible (that is, probability of no relation is less than 0.05 or P<0.05). Time series of ENSO activity and seasonal precipitation are given in figure 5. Identification of ENSO events and their influence on global and regional climate is the subject of considerable climate research. Indeed, there is no universal definition of what constitutes an ENSO event (Trenberth, 1997). The ENSO chronology plotted in figure 5 is based on the SOI, the SST in the equatorial region of the Pacific Ocean at 5°N to 5°S, 90° to 150°W (called the Niño3 region), and the chronologies of Trenberth (1997), Ropelewski (1999), and the Climate Prediction Center (2001). In the following analysis, Colorado Plateau seasonal precipitation was classified as ENSO (El Niño or La Niña ) or non-ENSO (that is, background climate) on the basis of the above sources and the conditions of SST and SOI from the midpoint to 6 months preceding a particular season.
The relation between ENSO
and Colorado Plateau precipitation is complicated and contradictory when examined
in detail (fig. 5). Nevertheless, several general
relations are statistically significant (P<0.05). During El Niño,
the frequency of above-normal cool-season precipitation increased above the
background climate; on the other hand, precipitation during La Niña is
typically less than precipitation during El Niño. ENSO activity varies
in strength, which in turn affects precipitation (fig.
6). During both the cool and warm seasons, weak El Niño conditions
were usually associated with below-normal precipitation. The variability of
warm-season precipitation during strong El Niño events exceeded non-ENSO
conditions. Briefly, in both seasons, strong El Niño episodes increased
the variability (warm season) of precipitation or the frequency (cool season)
of above-normal precipitation relative to non-ENSO climate, whereas strong La
Niña episodes typically produced normal, relatively low variability warm-season
precipitation and typically below-normal cool-season precipitation.
Long-Term Variation—The
PDO
Recent and possible future
climate variation related to the PDO and other ENSO-like indicators of multidecadal
climate variability is a recently developed tool for climatological research.
The PDO is partly related to SST and atmospheric pressure of the northern Pacific
Ocean (Mantua and Hale, 2002). Changes in these parameters evidently trigger
sharp transitions from one climate regime to another, altering the climate of
North America for periods of 2 to 3 decades (Zhang and others, 1997). Phase
shifts of the PDO are thought to affect the spatial connection between ENSO
and precipitation in the Western United States (McCabe and Dettinger, 1999).
The PDO is not a completely independent predictor of climate variability, because
it correlates with and is dependent on ENSO variability, although it produces
essentially the same patterns of temporal variability as more robust indicators.
Precipitation in the Colorado
Plateau region is modestly correlated (P<0.05) with the PDO (fig.
7). The three precipitation regimes shown by the annual (fig.
2) and seasonal (fig. 3) precipitation time series
are largely in phase with the PDO (fig. 8). This in-phase
relation is shown well by the dry episode of 1942–1977, which corresponds
to a period of low indices and a prolonged cool phase of the PDO. The early
phase of the PDO is associated, although in a complicated manner, with the relatively
wet conditions from 1905 to 1941. The strong warm phase of the PDO beginning
around 1977 is readily associated with the wet climate beginning in 1978. Of
particular interest is the downward shift in the PDO beginning in 1999, with
concomitant decreased precipitation that continued through the winter of 2002.
The weather, SST, and surface-pressure patterns of 1999–2002 suggest to
climatologists that the transition to another regime is presently underway (Ze’ev
and Smith, 2001), signaling the end of the warm PDO phase and the wet climate
of 1978–1998.
Implications
Precipitation in the Colorado
Plateau region has varied substantially during the past century. This multidecadal
variability has implications for ecosystem processes and land management. Precipitation,
along with other climate variables, affects the spatial scale, frequency, and
magnitude of natural disturbances to the ecosystem (Swetnam and Betancourt,
1998) as well as the recovery rates from natural and human disturbances. For
example, the results of studies of floral and faunal population dynamics and
the affects of grazing are dependent on the prevailing climate. Inferences and
projections based on these studies may not be valid or may need adjustment or
reappraisal if applied during a different climate regime.
Recent trends in Colorado
Plateau precipitation and the PDO suggest that the climate of the region may
become drier for the next 2 to 3 decades in a pattern that could resemble the
drought of 1942–1977. Although there are many uncertainties and assumptions,
including using a single index (PDO) to predict multidecadal climate variability
(Schmidt and Webb, 2001), it is important to consider the potential affects
of climate variation on the human and natural resources of the region. Water
resources were heavily affected during the early part of the 1942–1977
drought (Gatewood and others, 1964). The population of the region has increased
fourfold since the mid-1950s, substantially increasing the demand for water
in a region without abundant supplies and creating the possibility of severe
or catastrophic consequences if such a drought were repeated.
The work of USGS and other scientists is leading to a better understanding of the past and probable future climate of the Colorado Plateau. This work is only part of USGS efforts to provide information crucial to sound planning policies for land use and energy and other resource management. These efforts are also helping to protect lives and property from drought, landslides, and other hazards.
By Richard Hereford, Robert H. Webb, and Scott Graham
Edited by
James W. Hendley II and Peter H. Stauffer
Graphics by Sara Boore and Susan Mayfield; Web layout by Carolyn Donlin
For more
information contact:
Scientist-in-Charge
U.S. Geological Survey
2255 North Gemini Drive
Flagstaff, AZ 86001
(928) 556-7024
or
http://climchange.cr.usgs.gov/info/sw/
For questions about the content of this report, contact Richard Hereford
Download a copy of Acrobat Reader for free
| PDF version of this fact sheet (756 KB) |
| Help | PDF help | Geopubs main page | Fact Sheets |
| Department
of the Interior | Privacy Statement
| Disclaimer | Accessibility
|
URL of this
page: https://pubs.usgs.gov/fs/2002/fs119-02/
Maintained by: Michael Diggles
Created: November 6, 2002
Last modified: May 17, 2005 (mfd)