National Assessment of Coastal Vulnerability to Sea-Level Rise:
Preliminary Results for the U.S. Atlantic Coast
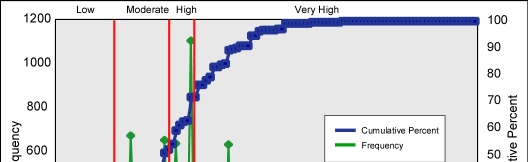
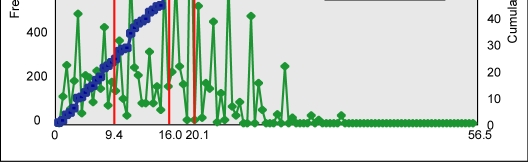
Figure 2. Histograms showing the frequency of occurrence and cumulative frequency of coastal vulnerability index (CVI) values for U.S. Atlantic coast. The vertical red lines delineate the chosen ranges for low, moderate, high, and very high risk areas.
 |
 |
| Introduction | Risk Variables |
Data Ranking |
CVI | Results | Discussion | Summary | References |
|
Web Page by
Donna Newman [an error occurred while processing this directive] |