 |
|||||
|


|
 |
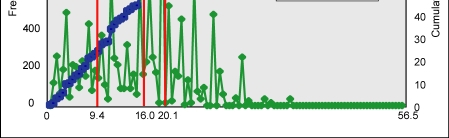 |
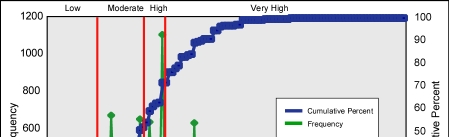
Figure 2. Histograms showing the frequency of occurrence and cumulative frequency of coastal vulnerability index (CVI) values for U.S. Atlantic coast.The vertical red lines delineate the chosen ranges for low, moderate, high, and very high risk areas
Histograms of the CVI values are shown in Figure 2. The CVI scores are divided into low, moderate, high, and very high-risk categories based on the quartile ranges and visual inspection of the data (Figure 2). CVI values below 8.7 are assigned to the low risk category. Values from 8.7-15.6 are considered moderate risk. High-risk values lie between 15.6-20.0. CVI values above 20.0 are classified as very high risk.
Figure 3 shows a bar graph of the percentage of shoreline in each risk category. A total of 9,472 km of shoreline is ranked in the study area. Of this total, 27 percent of the mapped shoreline is classified as being at very high risk due to future sea-level rise. Twenty-two percent is classified as high risk, 23 percent as moderate risk, and 28 percent as low risk.
The mapped CVI values (Figure 1) show numerous areas of very high vulnerability along the coast, particularly along the mid-Atlantic coast (Maryland to North Carolina) and northern Florida. The highest vulnerability areas are typically high-energy coastlines where the regional coastal slope is low and where the major landform type is a barrier island. A significant exception to this is found in the lower Chesapeake Bay. Here, the low coastal slope, vulnerable landform type (salt marsh) and high rate of relative sea-level rise combine for a high CVI value.
The coastline of northern New England, particularly Maine, shows a relatively low vulnerability to future sea-level rise. This is primarily due to the steep coastal slopes and rocky shoreline characteristic of the region, as well as the large tidal range.
| Previous Page | Contents | Back to Top | Title Page | Next Page |
| Introduction | Risk Variables |
Data Ranking |
CVI | Results | Discussion | Summary | References |
|
Web Page by
Donna Newman [an error occurred while processing this directive] |