![]()

These profiles show cross-section images of the lake bottom and the underlying sediment layers. They are created by generating sound waves in the water and recording their reflected echos. Channel 1 (above) used a hydrophone streamer receiver and shows deeper penetration into the sub-bottom compared to Channel 2 data (below). Only Channel 1 was recorded on the E-W lines; both channels were recorded on the N-S lines. Channel 2 profiles, recorded using a focused in-line cone receiver, show higher vertical resolution and frequency.
The vertical axis is in milliseconds of 2-way reflection time and is proportional to depth. The displayed profiles show ~70 milliseconds of data, equivalent to ~50 m of depth. The horizontal length of the profile is ~ 1 km. Vertical exaggeration is therefore about 10:1.
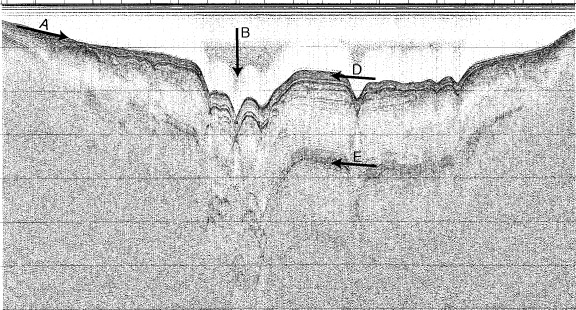
The profile runs along the edge of the prominent deep hole in the east side of the lake. The lake bottom (Arrow A) slopes smoothly from its southwest end and then suddenly drops to a depth of ~ 20 m depth at arrow B. We suspect that this hole is due to either collapse or explosive excavation of the ground due to volcanic activity. There are no deposits from such an event, and thus it would have occurred prior to the last period of glacial advance and scouring, some 12,000 years ago. The Channel 1 profile shows a deep reflection from a layer about 30 m below the lake bottom (Arrow C). This may be the contact between lake sediments and deeper volcanic bedrock. On Channel 2, reflections from finely bedded shallow sediments are shown by Arrow D. Layers as thin as 20 cm can be resolved. Multiple reflections from the lake bottom can be seen in places (Arrow E), and do not represent sub-bottom features.
The original data, available in SEG-Y format, are of much higher resolution and detail than can be shown on the images here.