![]()
In order to determine the optimum location for sampling of lake-floor sediments, we undertook a program of bathymetric and geophysical profiling of the lake bottom. The bathymetric data, in essence, are a topographic map of the lake floor. We also collected seismic reflection profiles to look at the structure and thickness of sediments on the lake floor. The profiles can determine whether the sediments are neatly layered or chaotic and boulder-strewn.
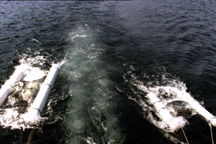
The bathymetric, geophysical, and lake sampling programs were conducted from a 22-foot whaler, R/V Fast Eddie, September 16 through 19, 1999. The field notes for all boat operations are included in Appendix I.
Bathymetry measurements were made with a Lowrance fathometer
operating at 192 kilohertz, which also logged surface water
temperature. Seismic reflection profiles were acquired using a
Geopulse transducer (a "boomer) and two hydrophone receivers: a short
3-element streamer and a line-in-cone Seistec vertical array. The
east-west lines were acquired with the streamer only, while the
northeast-southwest lines were acquired with both receivers. The
Geopulse source creates a wideband (2500-4500 Hz) pulse with a single
positive pressure transient of up to 218 dB//1m Pa @1m. The reflection data were recorded
digitally at 16 kHz sampling, 200 msec record length, at a repetition
rate twice per second. Vertical resolution of better than 50 cm to a
subbottom depth of approximately 25 meters and lateral resolution on
the order of 1 meter were achieved. Positioning was accomplished with
differential Global Positioning System (GPS). Absolute position
accuracy was approximately ± 10
m.
 |
 |
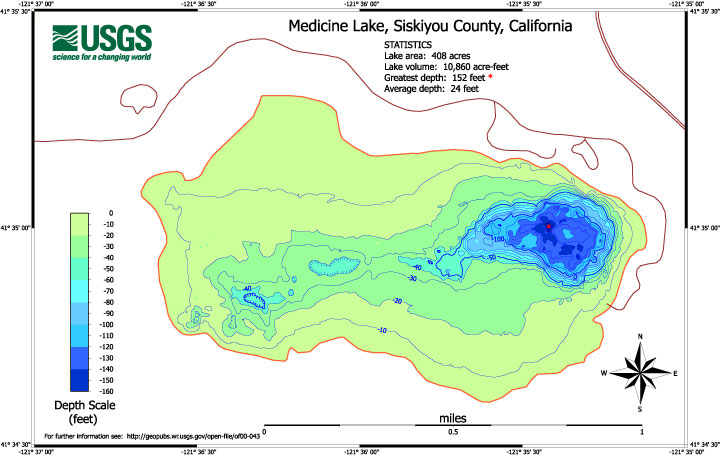
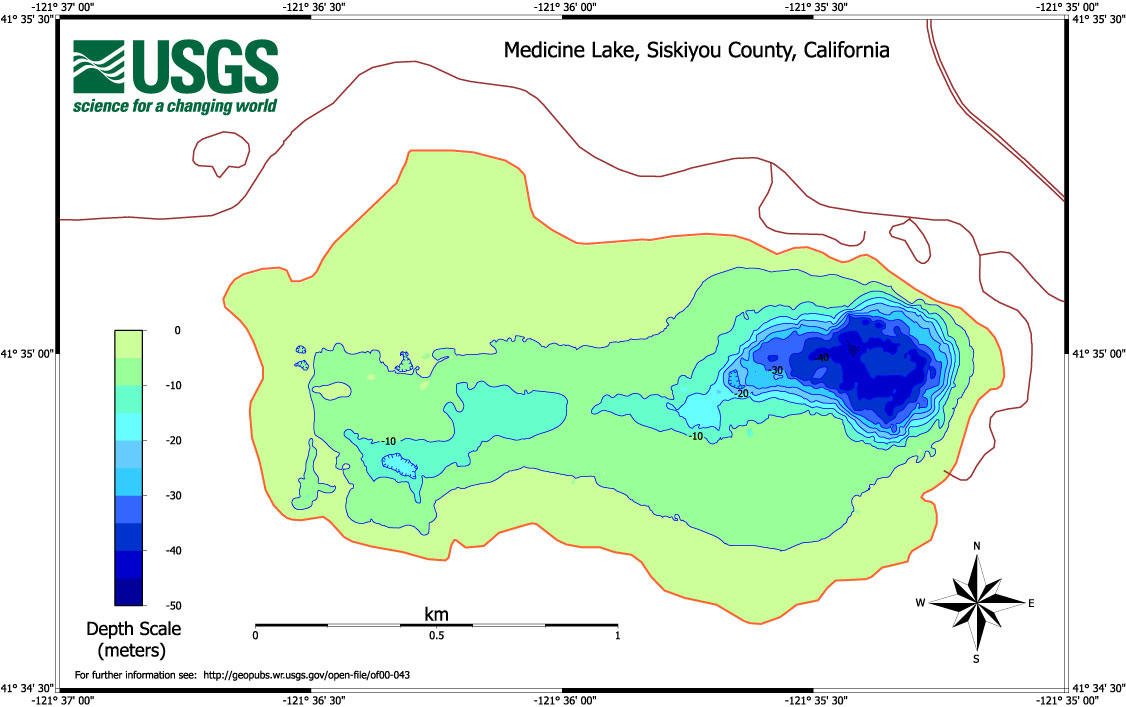
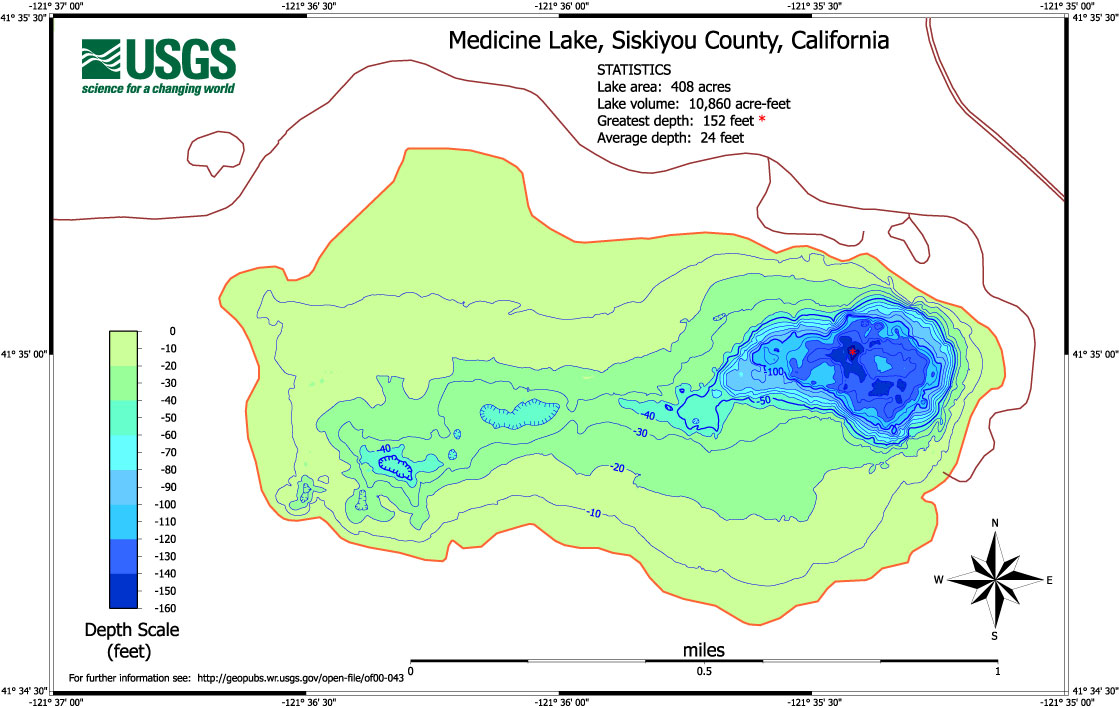
Two bathymetric figures of the lake were generated: Map 1 is contoured at 5-meter intervals; Map 2 is contoured at 10-foot intervals. The bathymetric maps were created by gridding the trackline data at approximately 4-meter grid interval, and fitting the grid with a minimum-curvature surface (Smith and Wessells, 1990). The gridding and contouring was accomplished with the Generic Mapping Tools (GMT) Package (Wessells and Smith, 1998). Further information regarding this package is available at: http://imina.soest.hawaii.edu/gmt/. The data are available in Appendix III.
Maps 1, 2 and 3 (layer within Map 1) are also available as Adobe Illustrator® 8.0 files. Click here to see Figure B5: A 3-D perspective view of the lake bathymetry, as would be seen from the southwest .
The locations of the seismic reflection profiles are shown in Map 3 (Figure B6), and a REPRESENTATIVE SEISMIC LINE(Figure B7), with explanatory annotation, is also provided. Information about the acquisition of the track lines is available in Appendices II . The actual bathymetric data are available in Appendix III.
The seismic reflection profile data are available on in SEG-Y exchange format (Barry and others, 1975) via FTP. Click here for more information.
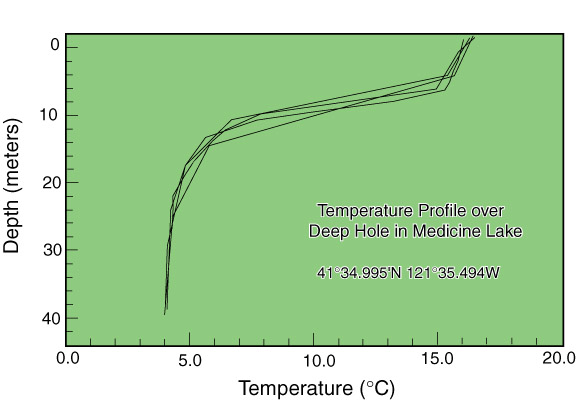
The temperature of the lake as a function of depth to 40 meters was measured with a conductivity-temperature-depth instrument. The temperature profile is shown below in Figure B9.
Barry, K.M., Cavers, D.A., and Kneale, C.W., 1975,
Recommended standards for digital tape formats: Geophysics, v. 40, p.
344-352
Smith, W. H. F., and P. Wessel, 1990, Gridding with
continuous curvature splines in tension, Geophysics, vol. 55 (3), pp.
293-305
Wessel, P., and W. H. F. Smith, 1998, New, improved version of
Generic Mapping Tools released, EOS Trans. Amer. Geophys. U., vol. 79
(47), pp. 579